MRD:CPYX
H + H2 system
Transition state region and position
The total gradient of the potential energy surface is 0 both at a minimum and at a transition structure. At a minimum, the gradient is negative before that point and positive after that point. The transition state is the maximum point on the minimum energy path, which means that it is at a relative minimum along 1 direction and at a relative maximum along the crossing direction. This point is known as a saddle point, as it is neither a minimum nor a maximum.
Good. Some discussion using second partial derivatives would have been nicer, though. Je714 (talk) 16:17, 31 May 2017 (BST)
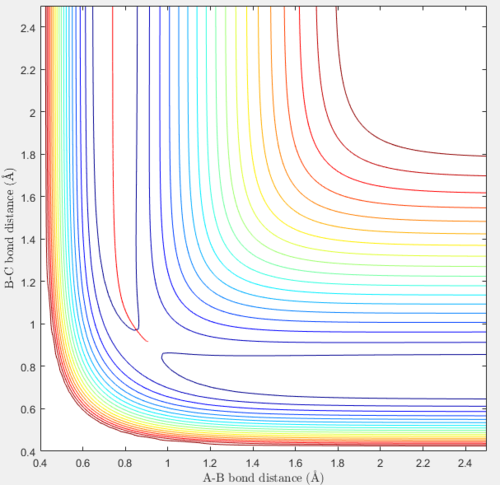
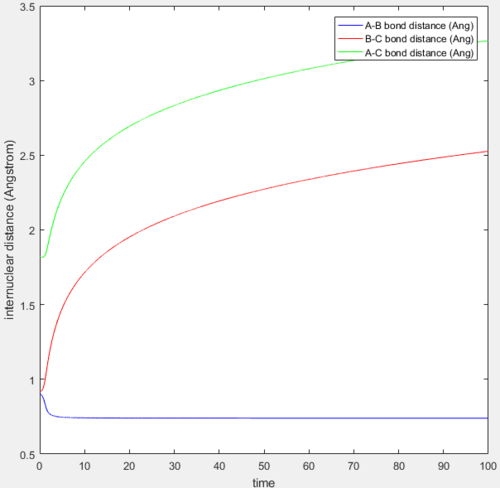
The transition state position rts is estimated to be 0.90775 Å (5.s.f.). When the initial conditions of r1 = r2 = 0.90775 Å and p1 = p2 = 0 are tested, the system does not seem to vibrate and the bond distances remain at 0.90775 Å until t=8.63, when atom C starts to move away from the newly-formed vibrating molecule AB. This is shown in the plot of internuclear distances against time below. The above initial conditions at time values of 0 < t < 8.63 also produced a trajectory where all the atoms remained at their initial position. This means that the trajectory only stays on the ridge when the bonds have zero momenta and this is the optimal distance between each of the 3 H atoms when they are all bonded to one another in the transition state.
The TS is a mathematical construct. In practice, you can always run a sufficiently long simulation in which the system will fall off towards the products or reactants. Je714 (talk) 16:17, 31 May 2017 (BST)

Comparison between the reaction path/mep and the trajectory using the same initial conditions
Thorough explanation, GJ. Je714 (talk) 16:18, 31 May 2017 (BST)
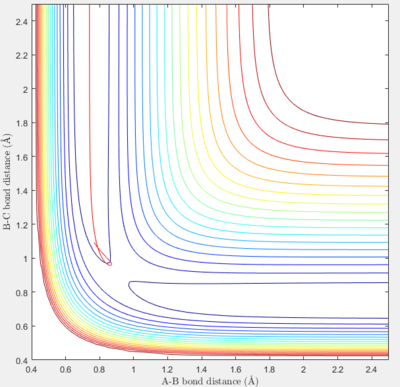
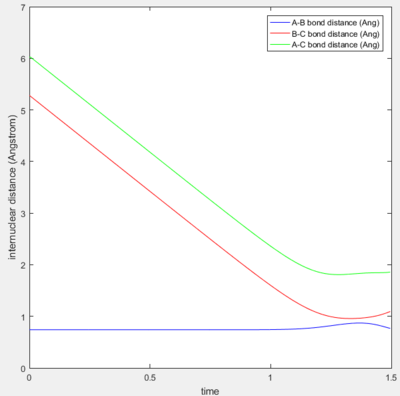
A mep and a trajectory with its calculation type as Dynamics were run separately using the initial conditions of r1 = rBC = 0.91775 Å, r2 = rAB = 0.90775 Å and p1 = p2 = 0 and compared. All atoms A, B and C refer to H atoms and all internuclear distances, time and internuclear momenta values which do not have to be very accurate are reported to 2.d.p.
If the initial conditions r1 = rBC = 0.90775 Å and r2 = rAB = 0.91775 Å were used instead, the trajectory will be a reflection of the original trajectory in the diagonal connecting the origin and the corner corresponding to the maximum internuclear distance values. In the internuclear distance and internuclear momentum vs time plots, the lines for the new A-B bond will be the same as the lines for the original B-C bond and the lines for the new B-C bond will be the same as the lines for the original A-B bond. The shapes of the plots will otherwise be the same.
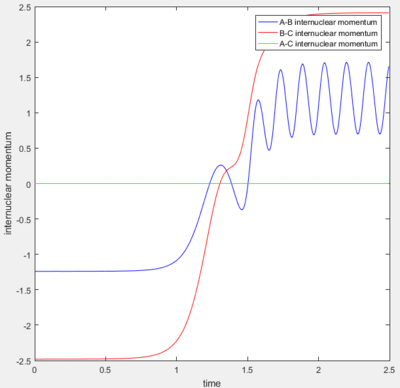
A calculation with initial positions at the final positions of the trajectory obtained above and the initial momenta the same as the final momenta in the trajectory obtained above but with their signs reversed, was performed. This means that rAB, rBC, AB momentum and BC momentum were set to 0.74 Å, 5.28 Å, -1.24 and -2.48 respectively. The results of the calculation are shown below.
Reactive and unreactive trajectories
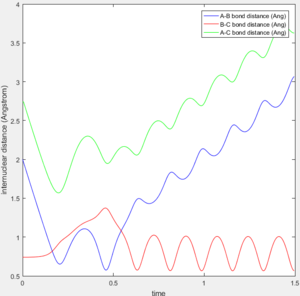
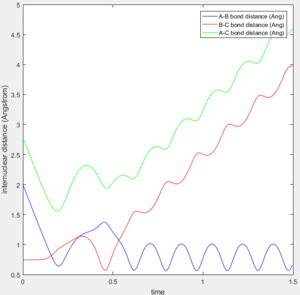
In the following table, the initial positions are r1 = rBC = 0.74 Å and r2 = rAB = 2.00 Å. The momentum values are recorded in the table and the reactivity of their trajectories is shown.
Comparison of Transition State Theory predictions with experimental values
The main assumptions of Transition State Theory are that an activated complex is in equilibrium with the reactants, the rate of formation of products from this activated complex depends on the rate at which it passes through a transition state and every trajectory that passes through the transition state structure is reactive.[1]
From the results obtained in the previous part, the main factor influencing the outcome of the first 3 trajectories is the amount of kinetic energy present in the system, as the magnitudes of the internuclear momenta are relatively low. If the reactants have enough kinetic energy to reach the transition state and cross the activation barrier, products will be formed and the trajectory will be reactive. If the reactants do not have enough kinetic energy, the transition state will not be reached and products will not be formed. The reactive trajectories in this category all pass through the transition state structure and the 2nd trajectory which is unreactive does not pass through the transition state structure as the reactants do not have enough kinetic energy. These results show that the assumptions of the Transition State Theory are largely valid. Thus, Transition State Theory predictions for reaction rate values will be similar to experimental reaction rate values when the reactants approach each other at reasonably low levels of translational and vibrational energy.
The last 2 trajectories from the previous part have a very high kinetic energy in the system, as the magnitudes of internuclear momenta are high and around 2 times the values in the previous trajectories. According to the assumptions of the Transition State Theory, they both have enough kinetic energy so they should both pass through the transition state and form products. However, the 4th trajectory is unreactive while the last trajectory is reactive, even though their trajectories both show that they pass through a transition state. This means that not every trajectory that passes through the transition state structure is reactive and some trajectories that pass through the transition state structure will cross the barrier again and revert back to the reactants. This is because the orientation and direction in which the reactants approach each other, as well as their rotational and vibrational states, can influence the success of their collision, and this is the main factor influencing the outcome of these trajectories. Thus, Transition State Theory predictions for reaction rate values will be an overestimate and will be higher than experimental rate values as Transition State Theory assumes that collisions at the transition state will always be successful and this is not always the case.
Good. Minor point: the limitations regarding the equilibrium between TS and reactants are not really applicable here, since we're simulating a triatomic collision in isolation -- and not an ensemble of particles. Je714 (talk) 16:25, 31 May 2017 (BST)
F - H - H system
Energetics of the F + H2 and H + HF reactions
The F + H2 reaction is exothermic and the H + HF reaction is endothermic.
In the F + H2 reaction, a H - H bond is broken and a H - F bond is formed. Bond breaking is endothermic while bond forming is exothermic. The H - F bond is very strong (565 kJ/mol) due to the polarized nature of the H - F covalent bond and the high electronegativity difference between H, which has a moderate electronegativity, and F, which has a very high electronegativity. In contrast, the H - H bond is non-polar, so it is much weaker (432 kJ/mol) than the H - F bond. As the formation of the H - F bond releases more energy than the amount of energy used in the dissociation of the H - H bond, the F + H2 reaction releases energy to the surroundings in the form of heat and is exothermic.
In the H + HF reaction, a strong H - F bond is broken and a weaker H - H bond is formed. As the dissociation of the H - F bond requires more energy than the energy released through the formation of the H - H bond, this reaction takes in energy from the surroundings in the form of heat and is endothermic.
Transition state position and activation energies
When A is a F atom and B and C are both H atoms, the transition state is located at approximately rAB = 1.8100 Å and rBC = 0.74649 Å (5.s.f.). The plot of internuclear distance vs time where AB and BC both have zero momenta is shown below.
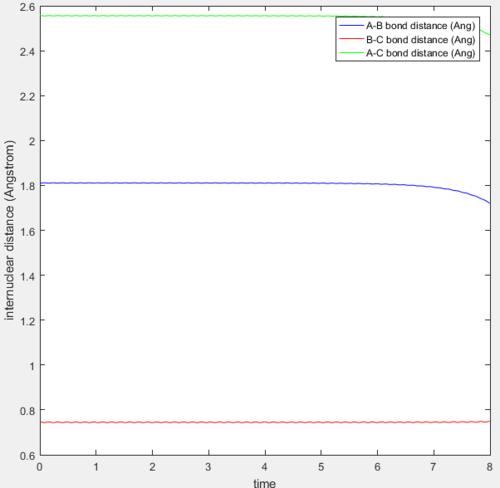
From this plot, the bond distances rAB and rBC remain constant until t=6.5. This means that these bond distances are at their optimum values in the transition state when all 3 atoms are bonded, and this structure stays on the ridge on the trajectory and does not fall off into reactants or products.
The activation energies for the F + H2 and H + HF reactions can be calculated using the energies of the reactants for each reaction and the energy of the transition state. These energy values can be found from the contour plot and they are recorded below.
Energy of H + H-F: -133.9 Kcal/mol
Energy of F + H-H: -103.9 Kcal/mol
Energy at the transition state: -103.7 Kcal/mol
These values can be used to find the activation energies for the H + HF and the F + H2 reactions, which are reported below.
Activation energy for H + HF reaction = -103.7 - (-103.9) = 0.2 Kcal/mol
Activation energy for F + H2 reaction = -103.7 - (-133.9) = 30.2 Kcal/mol
Other methods can be used to find the activation energies for these reactions. A mep using the initial conditions of rFH = 1.82 Å, rHH = 0.74649 Å, pFH = pHH = 0 was performed. The potential energy vs time plot shown below shows an initial energy of -103.75 Kcal/mol (2.d.p.), which corresponds to the energy of the transition state, and a final energy after 900 000 steps of -104.01 Kcal/mol (2.d.p.) which is the energy of F + H2. Thus, a better estimate of the activation energy for the F + H2 reaction is -103.75 - (-104.01) = 0.26 Kcal/mol.

A mep using the initial conditions of rFH = 1.80 Å, rHH = 0.74649 Å, pFH = pHH = 0 was performed. The potential energy vs time plot shown below shows an initial energy of -103.76 Kcal/mol (2.d.p.), the energy of the transition state, and a final energy of -133.92 Kcal/mol (2.d.p.), which is the energy of H + HF. Thus, a better estimate of the activation energy for the H + HF reaction is -103.76 - (-133.92) = 30.16 Kcal/mol.

Reaction dynamics
Reactive trajectories for the F + H2 reaction
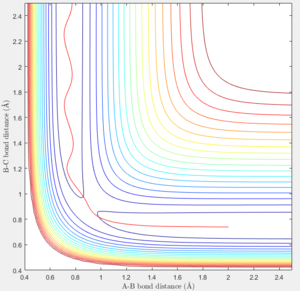
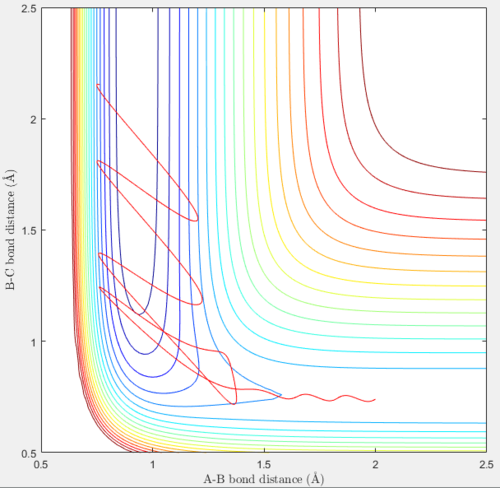
A set of initial conditions that results in a reactive trajectory for the F + H2 reaction are rHF = 2.00 Å, rHH = 0.74 Å, pHF = -2.00 and pHH = -1.25. The reaction energy is released as kinetic energy, in the form of the relative translational energy of the H atom away from the HF molecule as well as vibrational energy of the HF molecule itself. This is confirmed by the contour plot and the plot of internuclear momentum vs time shown below.
 |
 |
From the plots above, the H2 molecule has some vibrational energy initially, as shown in both the plots above where the trajectory and initial internuclear momentum pHH oscillate. The F atom moves towards the H2 molecule to form a transition state structure and then a HF molecule and a H atom. From the contour plot, the newly-formed HF molecule vibrates between energy levels quite high above the minimum energy path, and this vibration is much more extensive than the initial H2 molecule. In the initial part of the trajectory, even with vibrations present in the H2 molecule, the contour lines are not crossed until the transition state structure dissociates to form products. The internuclear momentum pHF also oscillates between -5.98 and 9.23, which is a large range, at large values of t. This is because the newly-formed HF molecule is in a vibrationally excited state. The internuclear momentum pHH at large values of t is a constant but rather low positive value of 1.83, as the H atom leaves the HF molecule with some but not much translational energy. From the contour plot, the products contain more vibrational energy in the HF molecule than translational energy in the leaving H atom.
This can be confirmed experimentally by using infrared chemiluminescence, where vibrationally excited molecules emit infrared radiation as they return to the ground state. Reactants with particular vibrational and translational energy levels can be shot at each other to react and the populations of the vibrational states of the HF molecules formed can be determined by measuring and comparing the intensities of the peaks in the infrared emission spectrum.[1]
Setting rHH = 0.74 Å, rFH = 2.00 Å and pFH = -0.5, the values of pHH in the range -3 to 3 that result in reactive trajectories do not fall into a few particular ranges, but range across the whole spectrum. However, low magnitudes of pHH from -0.90 to 0.32 result in reactive trajectories. Outside this range of values, for trajectories with even a small range of pHH values, their general reactivity cannot be meaningfully predicted. Changing the internuclear distance rFH only slightly can also make an unreactive trajectory reactive or make a reactive trajectory unreactive.
This is because the reaction of F + H2 is an exothermic reaction which requires a very small amount of energy of 0.26 Kcal/mol to achieve a transition state structure. Thus, the main factor determining the reactivity of a trajectory for this reaction is not the amount of kinetic energy in this system, but the direction and orientation of approach, the rotational states and the vibrational states of the reactants. In this system, setting a low initial magnitude of pHH which corresponds to very little kinetic energy in the H - H bond allows the F atom to approach and collide with the H2 molecule in a linear configuration easily. The products of a H atom and a vibrationally excited HF molecule will be formed easily as energy is released in the form of vibrational energy in the HF molecule as the products are formed. However, setting a large value of pHH means that the amount of kinetic energy in the system is high, allowing the F atom and the HF molecule to orbit around each other after collision, so they approach each other in random directions and all memory of the initial approach direction is lost. The reactants also rotate if they spend much time around the transition state, so they may or may not eventually approach each other in directions, rotational states and vibrational states that lead to the formation of products.
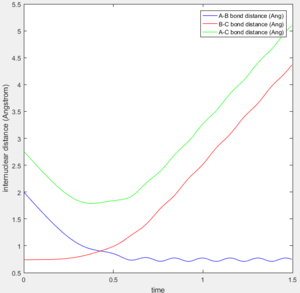
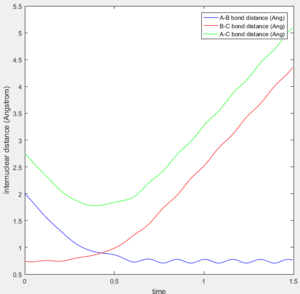
After setting up the initial conditions of rHH = 0.74 Å, rFH = 2.00 Å, pFH = -0.8 and pHH = 0.1, the trajectory obtained is reactive. The overall energy of the system is considerably reduced at these low momenta, so the reactants approach each other in a linear configuration that results in product formation. The contour plot and plot of internuclear distance vs time for this trajectory are shown below.
 |
 |
From the plot above, rFH decreases and rHH oscillates initially due to vibrations in the H2 molecule. At t=0.47, rFH=1.81 Å and the transition state structure starts to form. rHH starts to increase slowly and it increases more quickly from t=1.11 and rHH = rFH = 1.03 Å at t=1.25. At t=1.30, rFH reaches a minimum of 0.76 Å and rHH reaches a maximum of 1.29 Å. rFH increases and rHH decreases and at t=1.35, rHH = rFH = 1.06 Å. At t=1.52, rFH reaches a maximum of 1.34 Å and at t=1.57, rHH reaches a minimum in the transition state of 0.74 Å. rHH then increases almost linearly with time as a H atom originally from the H - H bond moves away from the newly-formed HF molecule, offset by the strong H - F bond stretching vibrations. At large values of t, rFH oscillates between 0.75 Å and 1.19 Å due to the H - F bond stretching vibrations. The newly-formed HF molecule is in a vibrationally excited state, as the trajectory crosses s few contours as it oscillates and rFH oscillates over a large range of values.
Reactive trajectories for the H + HF reaction
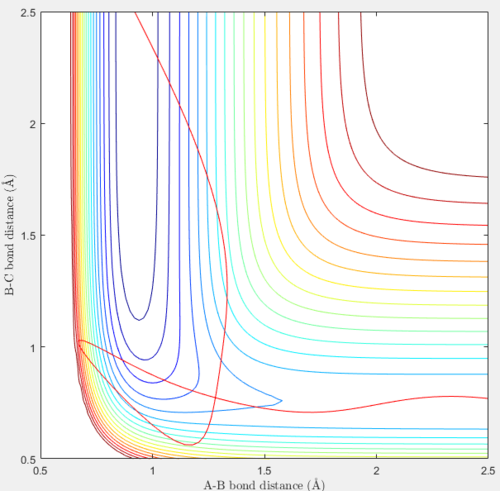
For this reaction, setting rFH = 0.92 Å, rHH = 2.5 Å, pFH = 0.1 and pHH = -10 results in a reactive trajectory.
 |
 |
In this reaction, unlike the previous reaction, both the reactants and products do not have much vibrational energy, but have more translational energy. This is shown in the smooth curves in the plots above. A high negative initial value of pHH and a much lower initial value of pFH were set. Initially, the H atom moves towards the HF molecule at a high negative velocity through a path that does not have the minimum potential energy, the H - F bond in the molecule weakens and rFH increases to a maximum of 1.33 Å at t=0.08. The H atom moves closer and collides with the HF molecule, such that the minimum value of rHH of 0.56 Å is reached very early on, at t=0.16. Kinetic energy is converted to potential energy in the HF molecule, and rFH decreases to a minimum value of 0.67 Å at t=0.21 as rHH increases to 1.01 Å. From the contour plot, this is the point on the trajectory where the system has the highest energy of ≈ -40 Kcal/mol. Potential energy is converted into kinetic energy when the trajectory moves away from this point and the kinetic energy is later converted into potential energy to overcome the activation barrier and form products. rHH decreases after reaching a maximum value of 1.03 Å at t=0.22, as a new H2 molecule is formed. At large values of t, the H2 molecule vibrates slightly, within the contour lines, and rHH averages at around 0.74 Å, the H – H bond length. The F atom has a high translational energy and moves away from the new H2 molecule at a high positive constant velocity such that rFH increases very quickly and reaches a value of 12.00 Å at t=1.50.
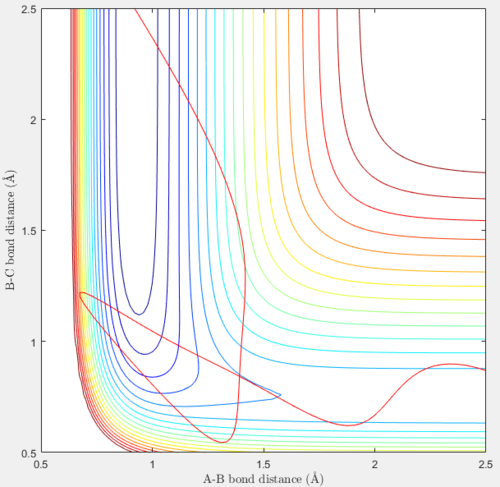
Using the same initial conditions as above but with pFH = 3.5 and pHH = -7.5 also results in a reactive trajectory, as shown by the contour plot and the internuclear distance vs time plot below. A slightly less negative, but still high, initial value of pHH and a higher initial value of pFH were set as compared to the previous reaction.
 |
 |
In this reaction, the products have more vibrational energy and slightly less translational energy than the previous reaction, while the reactants still have much more translational energy than vibrational energy. Initially, the H atom moves towards the HF molecule at a high negative velocity through a path that does not have the minimum potential energy, the H - F bond in the molecule weakens and rFH increases to a maximum of 1.42 Å at t=0.10. The H atom moves closer and collides with the HF molecule, such that the minimum value of rHH of 0.54 Å is reached very early on, at t=0.18. Kinetic energy is converted to potential energy in the HF molecule, and rFH decreases to a minimum value of 0.67 Å at t=0.25 as rHH increases to 1.22 Å. From the contour plot, this is the point on the trajectory where the system has the highest energy of ≈ -50 Kcal/mol. This energy value obtained is more negative and not as high as the value obtained for the previous reaction, as the magnitude of the internuclear momentum pHH and the relative translational energy of the H atom is lower than in the previous reaction, so the H atom moves towards the HF molecule with less kinetic energy that can be converted into potential energy. The potential energy is converted back into kinetic energy when the trajectory moves away from this point, and the kinetic energy is later converted back into potential energy to overcome the activation barrier and form products. rHH decreases as a new H2 molecule is formed. At large values of t, the H2 molecule vibrates and rHH averages at around 0.74 Å, the H – H bond length. The vibrational energy of the H2 molecule is greater than in the previous reaction, as the oscillations in the plots are stronger and the trajectory crosses a contour line at each peak, meaning that the H2 molecule is in a vibrationally excited state. The F atom has a high translational energy and moves away from the new H2 molecule at a high positive constant velocity such that rFH increases very quickly and reaches a value of 10.29 Å at t=1.50, which is still not as high as the value obtained in the previous reaction with a greater translational energy contribution.
By changing the initial H - F bond length to increase the energy of the H - F vibration, a reactive trajectory cannot be obtained without decreasing the magnitude of pHH, and this means that this reaction is driven mainly by the translational energy of the incoming H atom, much more than the vibrational energy of the HF molecule.
Differences between the F + H2 and H + HF reactions
A reactive trajectory for the F + H2 reaction usually involves a low amount of translational energy in the reactants and generates a HF molecule in a vibrationally excited state and a H atom that has little translational energy. On the other hand, a reactive trajectory for the H + HF reaction involves a high amount of translational energy in the incoming H atom and generates a H2 molecule that may or may not be vibrationally excited and a F atom that has a very high translational energy.
For the exothermic F + H2 reaction, the activation barrier is very small and the transition state is reached early on in the trajectory, so the incoming F atom only needs very little translational energy to collide and react successfully with the H2 molecule, and the main factors determining the reactivity of the trajectory are the direction and orientation of approach and the states of the reactants. As this reaction is exothermic, energy is released, mainly as vibrational energy in the new HF molecule. On the other hand, for the endothermic H + HF reaction, the energy barrier of -30.162 Kcal/mol is not small and has to be overcome for a reaction to be successful. The transition state is also reached late in the trajectory. This explains the need for the H atom to approach the HF molecule with a high translational kinetic energy in reactive trajectories.

