MRD:CP3MD mm1517
EXERCISE 1: H + H2 system
Dynamics from the transition state region
On a potential energy surface diagram, how is the transition state mathematically defined? How can the transition state be identified, and how can it be distinguished from a local minimum of the potential energy surface?
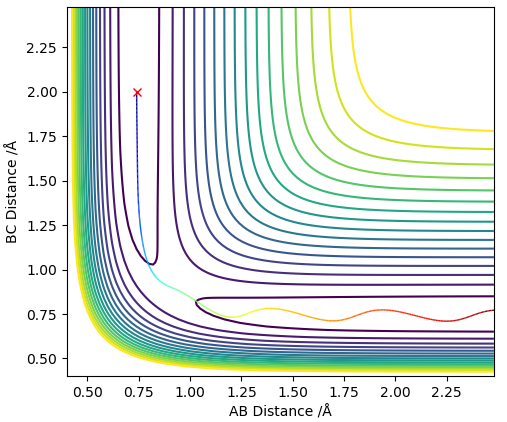
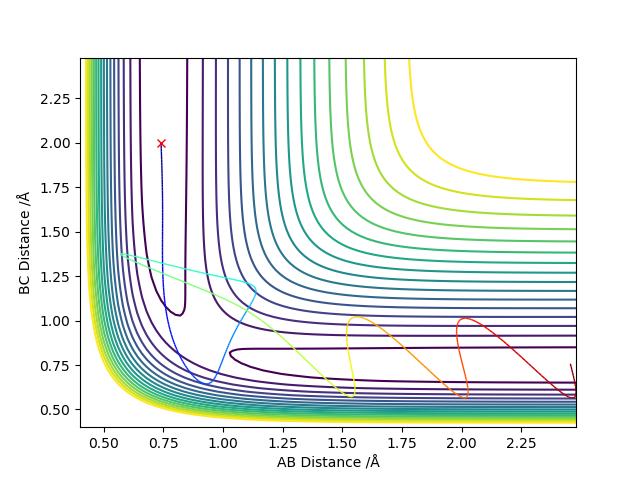
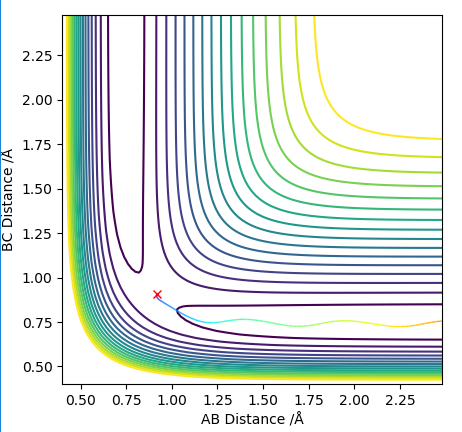
The transition state can be defined as the maximum on a minimum energy pathway. An example of a minimum energy pathway is shown on Figure 1 as a coloured wavy line, where the maximum corresponds to the transition state of this reaction between the chosen reactants and products.
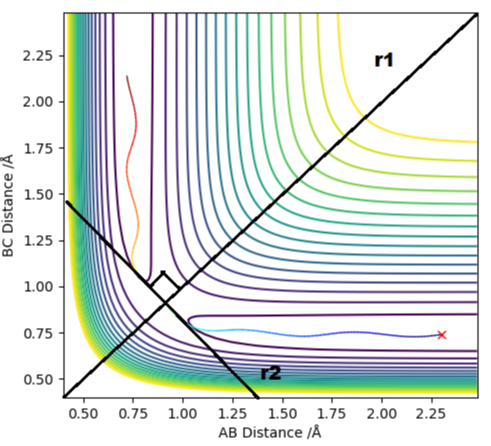
The transition state has the unique property of ∂V(ri)/∂ri=0. This point on the pathway can be labelled as a saddle point, meaning it is stable yet does not correspond to a local maxima or minima.
To conform that the chosen point is a saddle point, the second derivatives of the lines r1 and r2 must be taken, which are diagonal vectors relative to rAB and rBC and orthogonal relative to each other. Tangent to the saddle point on the minimum energy pathway is r2, whereas r1 cuts orthogonally through saddle point.
In order to identify the local maximum and minima, the second derivative must be taken.
∂2V(r1)/∂r12 > 0
∂2V(r2)/∂r22 < 0
Hence r1 is the local minima and r2 is the local maxima.
(Good definition.) Cq3417 (talk) 23:17, 29 May 2019 (BST)
Report your best estimate of the transition state position (rts) and explain your reasoning illustrating it with a “Internuclear Distances vs Time” plot for a relevant trajectory.
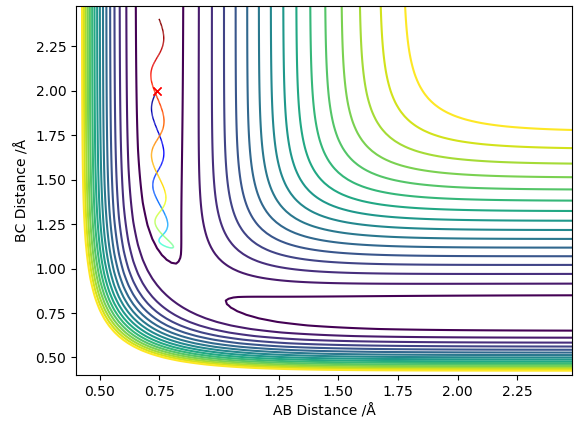
Due to the symmetrical surface of H + H2 , its transition state must have the property r1 = r2. As established in the previous question, the transition state has a gradient of zero. If they are unequal, a trajectory line is observed. Such a line results in oscillations about the saddle point, meaning it is non longer a transition state.
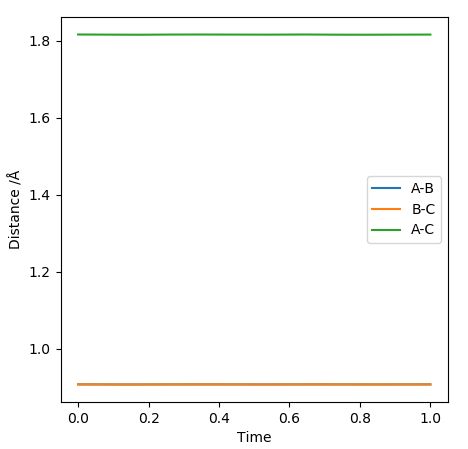
In order to find rts, various values of r1 = r2 were tested, keeping the momenta as zero. An optimum value of 0.9097 Å was found to give the plot with minimum oscillations (Figure 2).
(Good illustration.) Cq3417 (talk) 23:17, 29 May 2019 (BST)
Comment on how the MEP and the trajectory you just calculated differ.
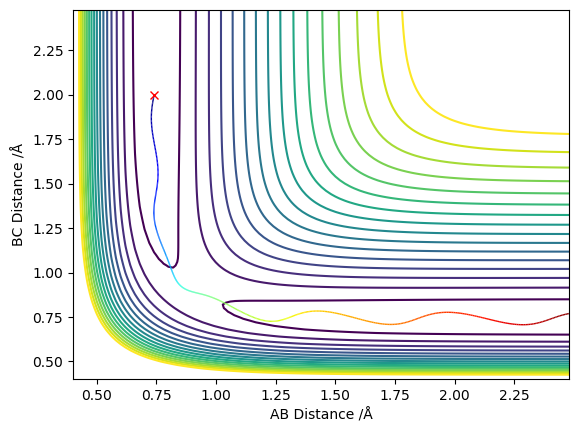
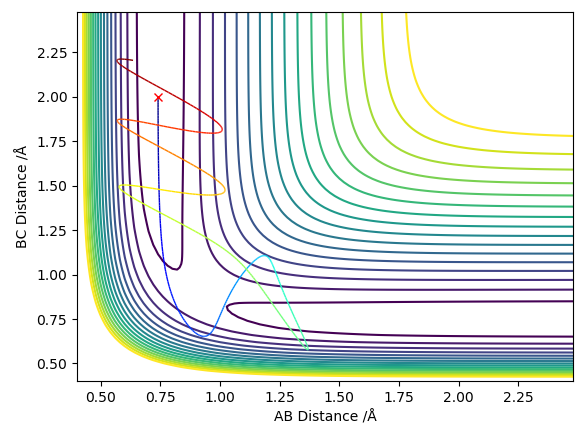
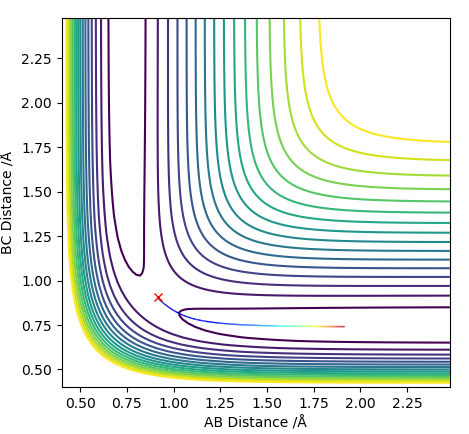
The minimum energy path (MEP) is a trajectory that corresponds to infinitely slow motion. The conditions were changed to where the system is slightly displaced from the transition state by δ. Figure's 3 and 4 below correspond to when δ=0.01;
r1 = rts+0.01, r2 = rts and p1 = p2.
As the MEP corresponds to infinitely slow motion, the plot is a straight line, therefore has no vibrations, whereas the dynamic plot is wavy. Therefore when compared to the dynamic graph, the energy path has fewer oscillations.
Reactive and unreactive trajectories
Complete the table below by adding the total energy, whether the trajectory is reactive or unreactive, and provide a plot of the trajectory and a small description for what happens along the trajectory. What can you conclude from the table?
From the table it can be concluded that higher momenta and higher energy of reactants do not always result in a successful reaction. It may cross the barrier, which is what theory predicts, yet there is the possibility of the products crossing back through the transition state and reforming the reactants.
State what are the main assumptions of Transition State Theory. Given the results you have obtained, how will Transition State Theory predictions for reaction rate values compare with experimental values?
The assumptions made in the Transition State Theory (TST) are as follows:
- Distribution of the reactants follows the Maxwell-Boltzmann distribution.
- Quasi-equilibium is established, where A + B ⇌ [AB]‡ → P. This shows that the reactants and products are not in equilibrium with each other, the reactants are in equilibrium with the transition state, and that the products cannot reversibly reform the reactants.
- Obey the Born-Oppenheimer approximation, where nuclear and electronic motions are independent of one another.
The Transition State Theory allows prediction of the rate constant, however the predicted value will deviate from the experimental value. This is because its assumptions also leads to limitations in the values it obtains.
Its assumption that once the quasi-equilibrium has been established, the products cannot reform the reactants. However, this is not the case in reality, where barrier recrossing can occur if the energy of products is high enough to break apart and re form the reactants. Therefore the predicted rate constant using TST will be higher than the experimental value.
(Any reference here?) Cq3417 (talk) 23:17, 29 May 2019 (BST)
EXERCISE 2: F - H - H system
PES inspection
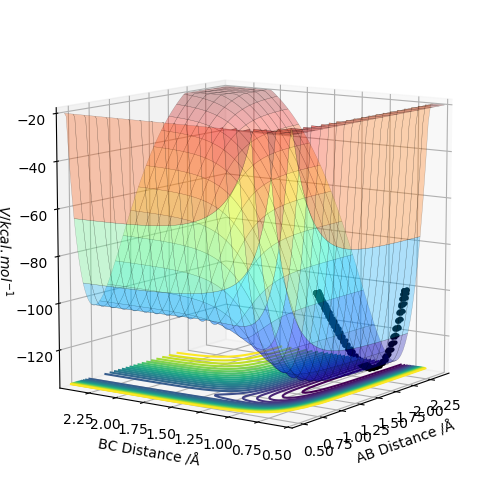
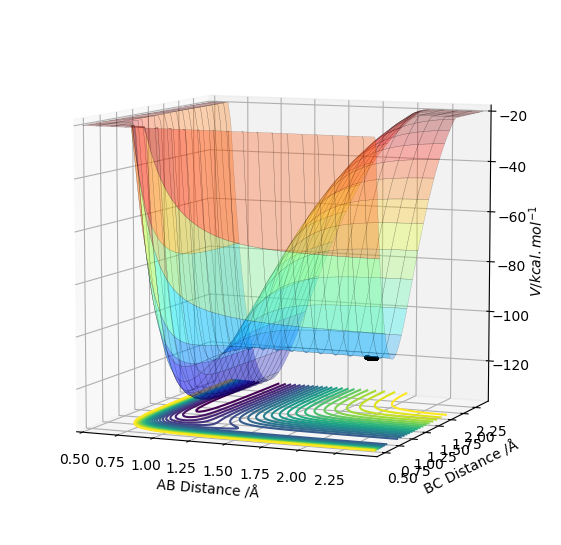
By inspecting the potential energy surfaces, classify the F + H2 and H + HF reactions according to their energetics (endothermic or exothermic). How does this relate to the bond strength of the chemical species involved?
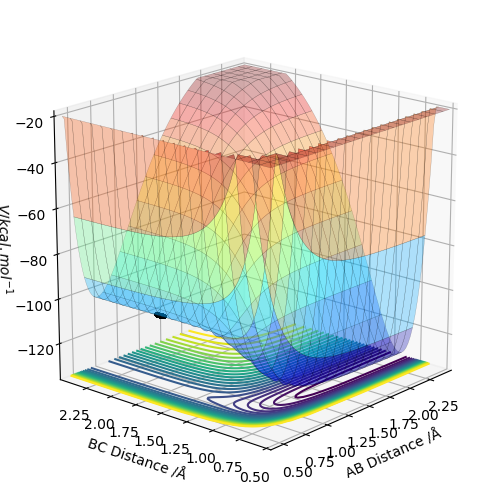
Figure 5 shows that the initial reaction, F + H2, begins at the higher end of the energy surface, thus it is exothermic. As a result, it can be deduced that the H-F bond is stronger than the H-H bond in the reactants. Comparatively to this, Figure 6's reaction, H + HF, begins at the lower end of the energy surface, so is endothermic. This correlates with theory, as due to the electronegativity of F, the covalent bond between H and F will be heavily polarised, resulting in a stronger bond.
Locate the approximate position of the transition state.
The AB distance and the momenta of both molecules were kept constant, and the BC distance was changed till the trajectory of the molecules appeared to be as motionless as possible. Thus through trial and error the transition state was found and is shown in Figure 6. Additionally, the steps were increased to 2000.
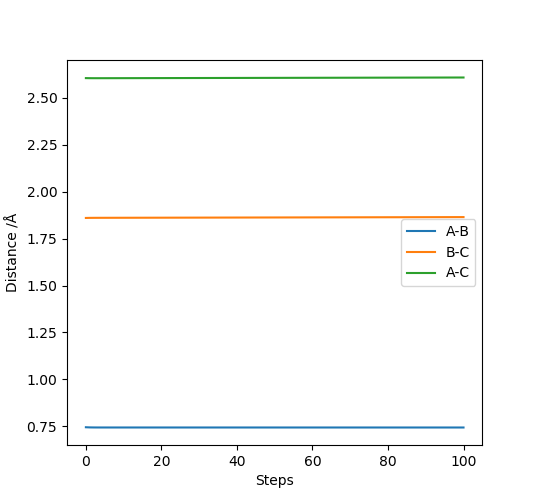
(Good, but how about the value of rHH and rHF?) Cq3417 (talk) 23:17, 29 May 2019 (BST)
Report the activation energy for both reactions.
The inter nuclear distances were displaced about the transition state by values between +0.01/-0.01, and the energy-step graphs observed to identify the activation barrier for H2 + F and HF + H.
Figure 9 HF + H reaction Ea = + 30.102 kcalmol -1
Figure 10 H2 + F reaction Ea = + 0.220 kcalmol -1
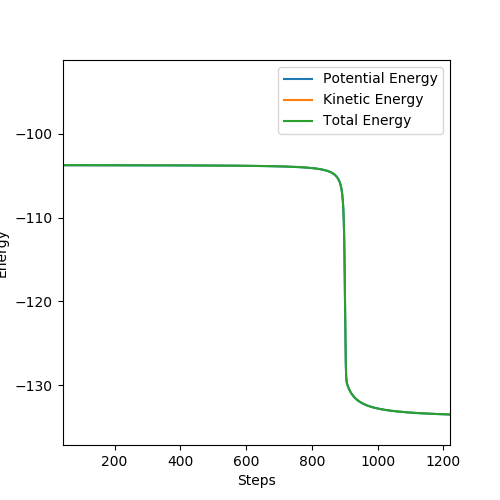
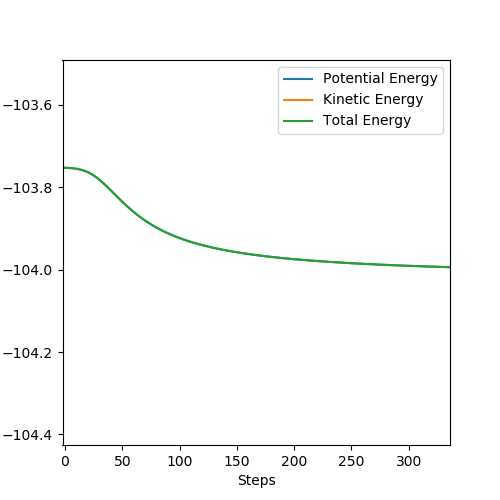
(I think you can discuss this in detail.) Cq3417 (talk) 23:17, 29 May 2019 (BST)
Reaction dynamics
In light of the fact that energy is conserved, discuss the mechanism of release of the reaction energy. Explain how this could be confirmed experimentally.
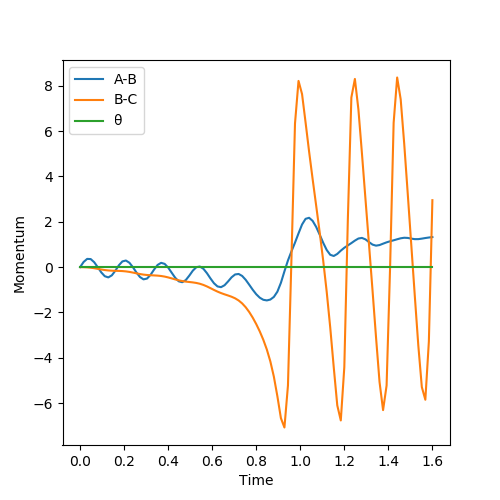
A set of initial conditions were identified that result in a reactive trajectory of H2 + F. The values chosen were rHH = 0.730 Å and rHH-F = 1.688 Å, and produced Figure 10. From this dynamic Momentum-Time graph, it can be seen that the A-B value tends to fixed value as the distance between them increases. Additionally as shown from Figure 5 we know that this reaction is exothermic, so the formation of the H-F bond releases energy. This is represented in the large increase of B-C oscillation. Due to the release in energy, we know that the chemical energy has been converted into kinetic energy, which supports the rise in temperature seen when an exothermic reaction takes place.
(I think you can increase the steps and achieve better plot.) Cq3417 (talk) 23:17, 29 May 2019 (BST)
Discuss how the distribution of energy between different modes (translation and vibration) affect the efficiency of the reaction, and how this is influenced by the position of the transition state (TS).
Polanyi's empirical rules state that vibration energy is more efficient at promoting a the activation of a late transition-state than translational energy, and vise-versa applies for an early transition state.
It was determined from Figure 5 that the reaction H2 + F is exothermic, and from Figure 6 that the reaction HF + H is endothermic.
From Hammond's Postulate, it can be concluded that the reaction H2 + F has an early TS which resembles the reactants, so is more efficiently activated using translational energy. For HF + H, the TS is late and resembles the reactants, thus is more efficiently activated by vibrational energy.
The chosen parameters were rAB = 0.74 Å and rBC = 1.81 Å, and the momenta varied.
To begin with, H2 + F was focused on. Hammond's postulate concluded that it is more efficiently activated by translational energy, so this was tested. Conditions for a greater vibrational energy were set, pAB = -3 and pBC = -0.8, in Figure 12. From this, you can observe that the reaction was unsuccessful. However when the momenta were changed so that there was higher translational energy, pAB = -0.5 and pBC = -2.5, the reaction was successful, Figure 13.
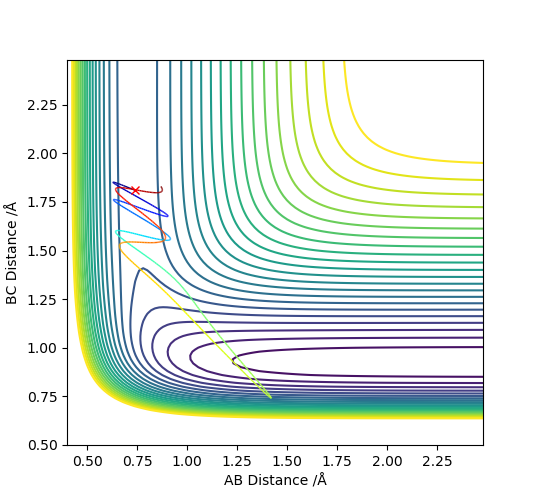
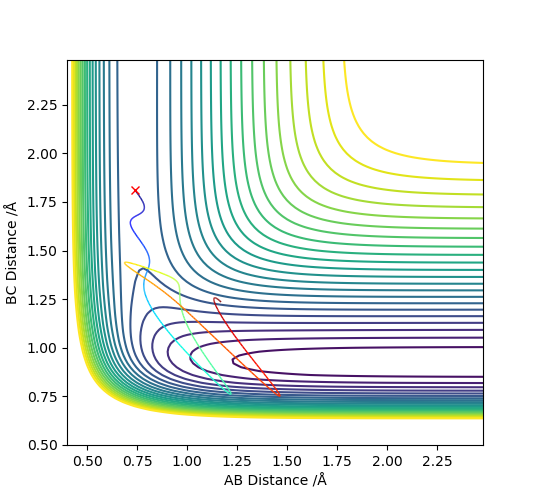
To conclude, HF + H was observed. Hammond's postulate concluded that it is more efficiently activated by vibrational energy.. Conditions for a greater translational energy were set, pAB = -0.5 and pBC = -2.5, in Figure 14. From this, you can observe that the reaction was unsuccessful. However when the momenta were changed so that there was higher vibrational energy, pAB = -2 and pBC = -1, the reaction was successful, Figure 15.
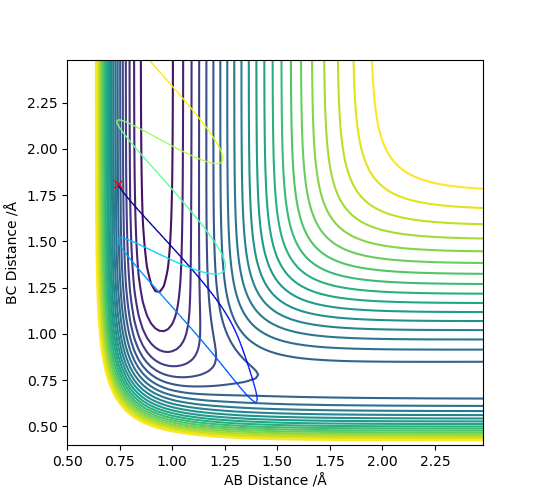
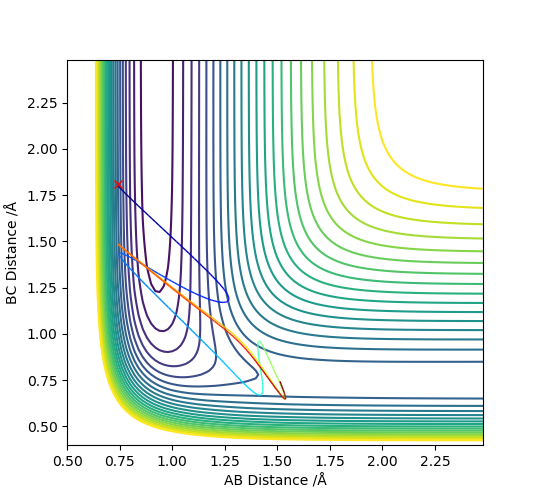
(I think you should put a reference here.) Cq3417 (talk) 23:17, 29 May 2019 (BST)
(Overall, this is a report with good illustration and can be improved by more discussion and listing reference.) Cq3417 (talk) 23:17, 29 May 2019 (BST)

