
MRD:CET161
H + H2 Analysis
Dynamics of the transition state
What value do the different components of the gradient of the potential energy surface have at a minimum and at a transition structure?
A potential energy surface is a graph that can record the process of a reaction where the potential energy is plotted as a function of the internuclear distances between the colliding atoms. The reactive trajectory of the reaction, which is the wavy line that follows the minimum along the surface of the graph can be used to predict the transition structure.

The trajectory oscillates along the minimum with a constant BC value, corresponding to the vibrating bond of the reactants. As it is at a minimum, the gradient of the potential in relation to the internuclear distance between B and C is zero: ∂V(r2)/∂r2=0.
The trajectory also oscillates along the minimum with a constant AB value, corresponding to the vibrating bond of the products. At this minimum, the gradient of the potential in relation to the internuclear distance between A and B is zero: ∂V(r1)/∂r1=0.
The transition structure is a single transient state of reaction at the saddle point on the reactive trajectory, linking the reactants and the products. The saddle transition state is the maximum on the minimum energy trajectory where the trajectory no longer oscillates, showing there are no bonds present. At this point, the gradient of the potential in relation to both AB distance and BC distance is zero: ∂V(ri)/∂ri=0.
Briefly explain how minima and transition structures can be distinguished using the curvature of the potential energy surface.
The minima can be distinguished from the transition structure which is at the saddle point between the two graphs. The minima is the lowest point along the potential energy graph. The saddle is found at the minimum point of at one orientation, and at the maximum at the orthogonal orientation. The two can be distinguished from each other by taking the second derivative of the gradient.
∆ =〖((∂2z)/∂x∂y)〗2 - ((∂2z)/(∂x2))((∂2z)/(∂y2))
At the saddle point, corresponding to the transition state, the second derivative of the potential in relation to the bond distance is negative: ∂2V(ri)/(∂ri)2<0.

Report your best estimate of the transition state position (rts) and explain your reasoning illustrating it with a “Internuclear Distances vs Time” plot for a relevant trajectory.
At the transition state the gradient of the potential energy surface is equal to zero. This means there is no kinetic so all the energy is converted into potential energy. At the transition state, the bond lengths between each of the atoms is equal, and as there are no forces acting on the atoms, the momentum for both bonds is zero.
The AB distance and the BC distance are equal, as the two terminal atoms A and C are equal distance from the center atom B. The two lines for A-B and B-C overlap completely in figure 3, and do not result in a chemical bond forming, showing that this is the lowest value the internuclear distances can reach before the bond forms. The gradients on the internuclear distance vs time plot is almost zero, indicating that the atoms do not oscillate, showing there is no kinetic energy. This distance is equal to 0.90775 Å. The AC distance also is also stationary, but between higher values, as the two terminal atoms are either side of atom B.
Further evidence that this is the internuclear distance is found by looking at the potential surface energy in figure 4. Here, the bond is stationary at the saddle of the potential energy well, present at a single form, and does not form any products.
-
 Figure 3- Internuclear distance vs time plot for 3 hydrogen atoms at the transition state.
 -
 Figure 4- Potential energy surface for 3 hydrogen atoms at the transition state.


Mep and dynamic calculation types
Comment on how the mep and the trajectory you just calculated differ
The mep, or minimum energy path is a trajectory path between reactants and products with the lowest energy. The mep and the trajectory it followed was investigated using a dynamic and minimum energy path, with the bond lengths altered so the AB distance was kept at the transition state distance (0.908 Å), and the BC distance was increased to 0.918 Å.
Using the MEP calculation, the potential energy surface plot shows atoms A and B bonding together and moving away from the transition structure, following the black line. As the number of steps on each calculation is increased, as shown by figures 5-10, the reaction extends further and further along the reaction trajectory and atoms A and B reach their equilibrium bond length, pushing atom C further away. The product bond does not oscillate, shown by the straight black line, as the MEP calculation resets the momentum of the atoms/bonds to zero after each calculation step.
-
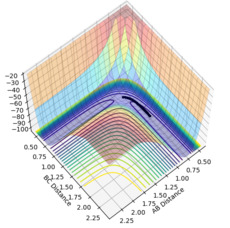 Figure 5- Mep calculation at 1000 steps
 -
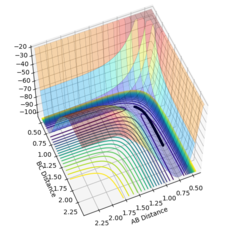 Figure 6- Mep calculation at 2500 steps
 -
 Figure 7- Mep calculation at 5000 steps
 -
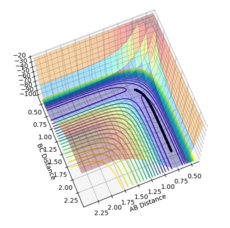 Figure 8- Mep calculation at 10000 steps
 -
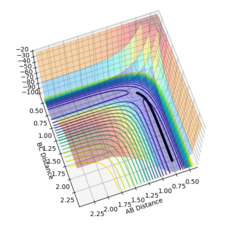 Figure 9- Mep calculation at 15000 steps
 -
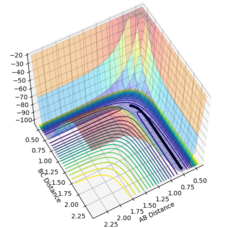 Figure 10- Mep calculation at 20000 steps


Using the dynamic calculation, the reaction also initially starts at the transition state before atoms A and B bond together and oscillate around their bond equilibrium length, and push atom C away as the reaction goes to completion. The plot on this potential energy surface, figure 11, shows the bond vibrating, shown by the oscillating trajectory caused by the inertial motion of the molecule. This is different from the MEP calculation as each iteration of the calculation uses the existing momentum calculated, and doesn't reset it to zero.
Jas213 (talk) 20:28, 28 May 2018 (BST) You have gone through the pain and effort of stating the meps for different number of steps. Now it would have been interesting if you had compared this to the number of steps needed for the dynamic trajectory.

In the mep simulation, the bond distances are initially constant, but then changes as the internuclear distance between B and C decreases as they bond together. This is shown by figure 12.The internuclear distance plateaus at 0.4 seconds, indicating that the bond has reached it equilibrium length.
For the dynamic simulation, the B-C bond distance reaches equilibrium distance of 0.7 Å after 0.4 seconds. The distance between A and C shows an exponential increase, as shown on figure 13.
-
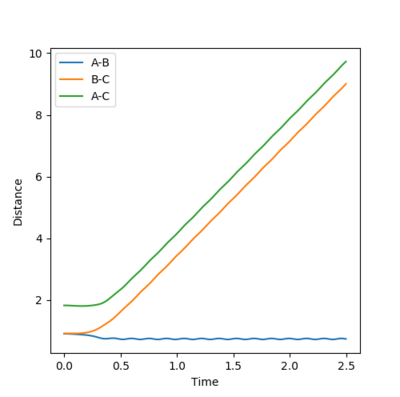 Figure 12- Internuclear distance vs time plot for mep calculation of reaction trajectory
 -
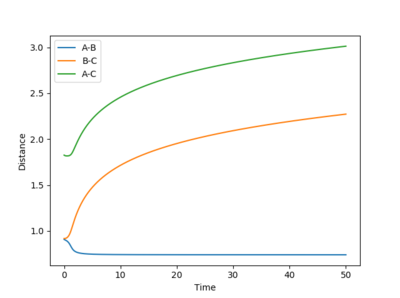 Figure 13- Internuclear distance vs time plot for dynamic calculation of reaction trajectory


Reactive and Unreactive trajectories
Complete the table by adding a column with the total energy, and another column reporting if the trajectory is reactive or unreactive. For each set of initial conditions, provide a plot of the trajectory and a small description for what happens along the trajectory.
Reactions reach completion if they have sufficient energy to overcome the activation energy and reach the energy maximum, where the transition state is found[1]. Jas213 (talk) 20:31, 28 May 2018 (BST) If reading the TS is your definition for a reactive pathway, then the penultimate trajectory should be reactive! However, you define a complete successful reaction as one that permanently forms products. It is possible to analyse if a reaction has gone to completion using a potential energy surface, as the trajectory will go from the reactant side of the minimum, through the saddle and the transition state, and into the product canal of the potential energy minimum. Varying amounts of momentum, and ergo kinetic energy will change whether a reaction goes to completion, as it will change the ease at which the reaction overcome the activation energy barrier. The effect of changing the momenta on bonds was investigated using bond lengths of r1= 0.74 Å and r2= 2.0 Å.
| Experiment | p1 | p2 | Total Energy Kcal/mol | Reactive or unreactive |
|---|---|---|---|---|
| 1 | -1.25 | -2.5 | -99.018 | Reactive |
| 2 | -1.5 | -2.0 | -100.456 | Unreactive |
| 3 | -1.5 | -2.5 | -98.956 | Reactive |
| 4 | -2.5 | -5.0 | -84.956 | Unreactive |
| 5 | -2.5 | -5.2 | -83.416 | Reactive |
-
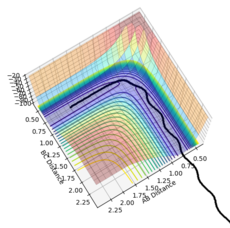 Figure 14- Experiment 1
 -
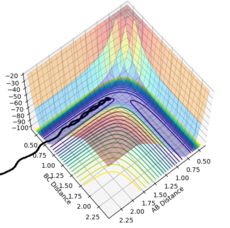 Figure 15- Experiment 2
 -
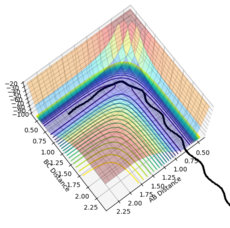 Figure 16- Experiment 3
 -
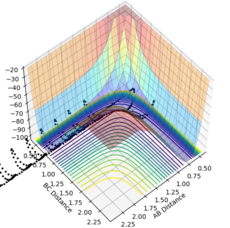 Figure 17- Experiment 4
 -
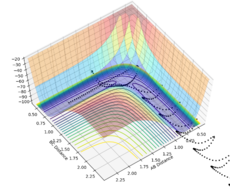 Figure 18- Experiment 5


Experiment 1: Atoms B and C are bonded together but not oscillating, and move towards atom A, which is moving towards the reactants. When they collide, A unbinds to B to enter the transition structure. Then B bonds to A to produce the products, which moves away from A. Atom A moves in one direction, and the bonded pair in another, with the two atoms oscillating.
Experiment 2: Atoms B and C are bonded together and oscillating, and move towards atom A. Atom A is moving towards the reactants. The reactants and atom C get close together, but then move apart without reacting. The reactant bond still oscillates.
Experiment 3: Atoms B and C are bonded together and oscillate slowly, moving towards atom A. Atom A moves towards the reactants. When the atoms get close, B and C uncouple, and the atoms enter the transition structure. Atoms B and A then bond together and move away from atom A, while the bond oscillates. Atom C moves away from the products in the opposite direction.
Experiment 4: Atoms B and C are bonded together and oscillate with high energy. They reach atom A and enter the transition state, but do not have enough energy to break the B-C bond and form the A-B bond. Therefore the trajectory is unreactive.
Experiment 5: Atoms B and C bonded together move towards A where they collide and enter the transition state. There is enough energy in the system to form the A-B bond, and the system falls into the product channel. The trajectory is reactive. It results in a A-B bond with high vibrational energy, shown by the oscillating line.
The main assumptions made in this experiment is that the more momentum and kinetic energy the colliding molecules have, the more easily they will react, as they will have excess energy and plenty to overcome the activation energy barrier and react into a more stable form. However, as shown by this experiment, more momentum does not always translate in a more successful reaction, as it might be in the wrong form to enable the reactants to reach the transition state and decay into products.
Transition State Theory
State what are the main assumptions of Transition State Theory. Given the results you have obtained, how will Transition State Theory predictions for reaction rate values compare with experimental values?
Transition state theory is used to calculate the rate of reactions. It is dependent on the rate of crossing an energy barrier between the reactants and the products, known as the activation energy barrier[2].
Transition state theory is based on the assumptions that:
1) the activated complex is in equilibrium with the reactants and not the products
2) the reactant nuclei behave according to classical mechanics
3) The reaction system passes through the transition state at the lowest energy point on the saddle on the potential energy surface[3]
However, these assumptions poorly reflect reality. For example, the second assumption predisposes that when atoms collide with sufficient energy they will form a transition state and should be reactive. Yet, the transition state is also capable of re-crossing the barrier and decaying back into the reactants. This means that the transition state decays back into the reactants rather than the products.
A + B ⇌ [AB]‡ → C
Transition state theory also does not account for quantum tunneling, where molecules with a small amount of energy are capable of tunneling through the activation energy barrier and transform into reactants, even though the reactants had insufficient energy to reach the transition state at the saddle point on the potential energy surface.
Because the transition state theory does not consider barrier re-crossing, or quantum tunneling, and assumes that energetic collisions will react, the rates of reaction predicted using the theory are higher than those extrapolated experimentally.
F-H-H Systems
Potential Energy Surface Inspection
Classify the F + H2 and H + HF reactions according to their energetics (endothermic or exothermic). How does this relate to the bond strength of the chemical species involved?
The reaction between F + H2 is exothermic; it releases energy. This is because the reactants are higher in energy than the products, due to the differences in bond strength and stability. The H-F bond is stronger than the H-H bond due to the electronegativity difference between F and H (Χ(F)= 3.98, Χ(H)= 2.2) so it has more ionic character. H-H bonds have small atoms so a high charge to mass ratio with a small bond length, so are weaker. This increase in stability means the formation of products from the reactants releases energy, making the reaction exothermic.
Therefore, the reverse reaction between H + HF is endothermic. This is because the stronger and more stable HF bond is broken to form the less stable H-H bond, which is higher in energy. To make the less stable bond, more energy is required which is taken from the surroundings into the system, making the reaction endothermic.
Locate the approximate position of the transition state.
Hammond's Postulate states that the structure of the transition state closely resembles the side of the reaction that it is closer in energy to. In exothermic reactions, the transition state resembles the reactants, and in endothermic reactions it resembles the products.
When analysing the F + H2 reaction, which is exothermic, the transition state will be resemble the reactants- it is an early transition state. By analysing the H-H bond distance and optimising the reaction, the position of the transition state can be found. The transition state for the exothermic reaction occurs where the H-H bond length= 0.7463 Å, and the F-H bond length= 1.810 Å. It is shown on the potential energy surface as a single point, shown on figure 19. This data is supported by the internuclear distance vs time plot, figure 20, where the gradients of the lines are stationary, showing there is no kinetic energy, and all the energy is potential, indicating that it is at an energy maximum.
The structure and position of the transition state will be the same for both reactions: [H-H-F]‡. This is because the exothermic reaction is the forward reaction of the backwards endothermic reaction, or vice versa. They both have the same transition state energy maximum, but different activation energies, as the reactants are higher in energy in the exothermic reaction than the reactants in the endothermic reaction.
-
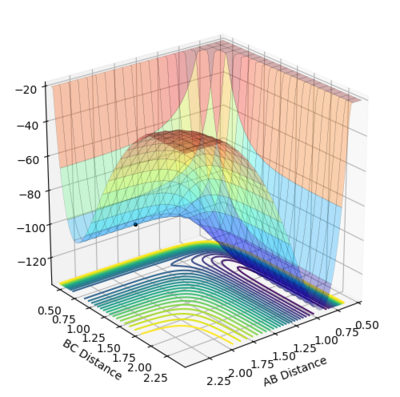 Figure 19- Potential energy surface plot of F + H2 reaction at the transition state.
 -
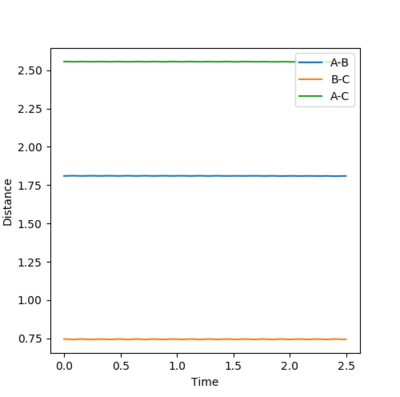 Figure 20- Internuclear distance vs time plot for F + H2 at the transition state.


Report the activation energy for both reactions.
The activation energy is the energy difference between the highest point, the energy of the transition state, recorded as -103.751 Kcal/mol, and the energy of the reactants.
The activation energy can be calculated for the exothermic by calculating the potential energy for the reactants for each reaction on a energy vs time plot, where the bond length of the H-F was lengthened to 1.820 Å to reflect a reaction occurring. For the endothermic reaction, a similar method was used, except the H-F bond length was reduced to 1.800 Å.
Activation energy= energy of transition state - energy of reactants
For F + H2: -103.75 - -103.8 = 0.05 Kcal/mol
For H + HF: -103.75 - -134 = 30.25 Kcal/mol
-
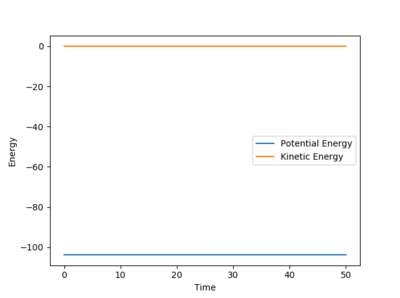 Figure 21- Energy vs time plot for exothermic reaction between F + H2.
 -
 Figure 21a- Energy vs time plot for exothermic reaction between F + H2.
 -
 Figure 22- Energy vs time plot for the endothermic reaction between HF + H.


Reaction dynamics
In light of the fact that energy is conserved, discuss the mechanism of release of the reaction energy. How could this be confirmed experimentally?
The set of parameters which cause a reaction between F + H2 were as follows:
| rF-H distance | rH-H distance | pF-H | pH-H |
|---|---|---|---|
| 2.3 | 0.85 | -7.5 | -2 |
This reaction is exothermic, so is assumed that the reaction path would release energy.
Using a graph of the internuclear momentum vs time, shown in figure 23, it is seen that the H2 molecule vibrates with a smaller oscillation than HF, apparent from the orange line corresponding to H2, where the height from the crest to the trough is much smaller than the blue line, corresponding to HF. This can also be seen on the energy vs time plot, figure 24. The oscillation of the potential energy on the graph before the maximum (which indicates the transition state) is smaller than the oscillation after the maximum. The oscillations refer to the vibrational energy of the H-H bond , and the vibrational energy of the H-F bond.
The Law of conservation of energy states that energy is never made or destroyed but converted between forms. The excess energy that is released when more stable H-F bonds are formed from H-H bonds is used to increase the kinetic energy vibrations of the bonds. The loss of potential energy is mirrored with an increase in kinetic energy, as seen on the energy vs time plot.
-
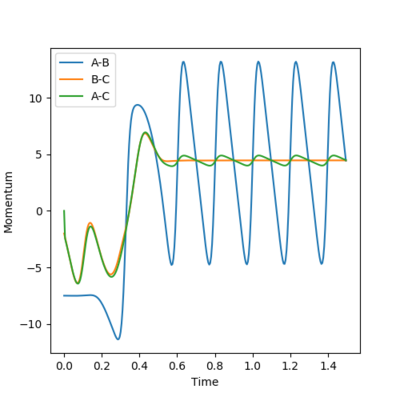 Figure 23-Internuclear momentum vs time plot of reaction between F + H2
 -
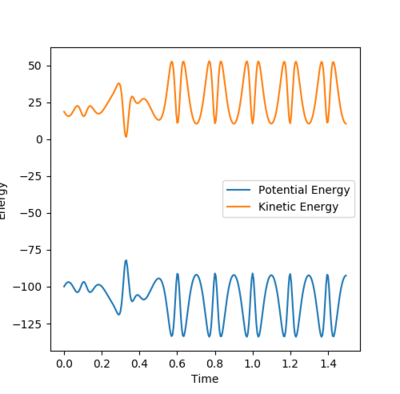 Figure 24- Energy vs time plot of reaction between F + H2


To analyse this experiment, one could use calorimetry, which measures the change in enthalpy as the reaction progesses. IR spectroscopy could also be used, as the H-H bond stretch wavenumber would be converted to the H-F bond stretch wavenumber, which would be found at at higher value, as this bond is stronger.
Polanyi's Empirical Rules
Discuss how the distribution of energy between different modes (translation and vibration) affect the efficiency of the reaction, and how this is influenced by the position of the transition state.
Polyanyi's Empirical rules are general statements regarding how different forms of energy affect the rate of reactions. Jas213 (talk) 20:40, 28 May 2018 (BST) This MRD experiment has nothing to do with reaction rates!! He postulated that vibrational energy is more efficient than translational energy in activating a late-barrier endothermic reaction. Whereas the opposite is true for an early-barrier exothermic reaction, the translational energy is more efficient in activation than vibrational energy.[4]
For reactants to react into products they must overcome an activation barrier. Kinetic energy in the form of translational and vibrational energy can be used to supply the reactants with energy to overcome the activation energy barrier. As the pH-H momentum decreases, the bond oscillation reduces. This is analogous to the vibrational energy between the H molecules. As the pF-H momentum increases, the translation of H2 to F increases.
The reaction between F + H2 is exothermic, which is an early transition state according to Hammond's postulate. Therefore, it should be more dependent on translational energy to react than vibrational energy. When the vibrational momentum pH-H is small, pH-H = 0.1, and the translational momentum is is increased between -0.5 and -0.8, the reaction becomes successful, showing a large dependence on translational energy. The excess translational energy is converted into vibrational energy; the new H-F bond oscillates at a greater frequency. The trajectory of this experiment is shown in figure 25. Conversely, when the translational energy is low, pF-H = -0.5, and the vibrational energy is large, pH-H=-3, the reaction is still unsucessful,as shown in figure 27. There has to be a much larger increase in the vibrational magnitude to create a reactive trajectory. This portrays how the exothermic system obeys Polanyi's rule, as only systems with higher translational energy than vibrational energy create successful reactions.
| Reactive trajectory | |||
|---|---|---|---|
| rF-H | rH-H | pF-H | pH-H |
| 2.3 | 0.74 | -0.8 | 0.1 |
| Unreactive trajectory | |||
|---|---|---|---|
| rF-H | rH-H | pF-H | pH-H |
| 2.3 | 0.74 | -0.5 | -3 |
-
 Figure 25- Reactive trajectory of reaction between F + H2
 -
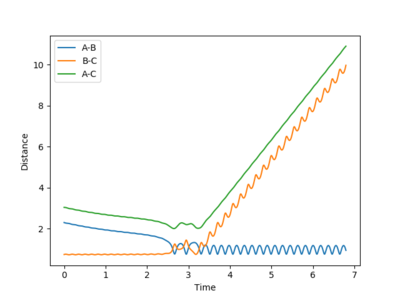 Figure 26- Internuclear distance vs time graph for reactive trajectory, showing how energy is converted into vibrational energy for the H-F bond.
 -
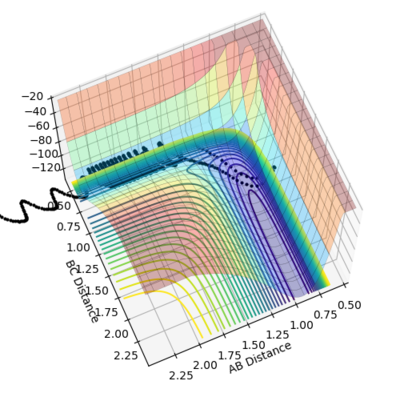 Figure 27- Unreactive trajectory of reaction between F + H2


The reaction between HF and H is endothermic, and so has a late transition state. Hence, in line with Polanyi's rule, it should be more dependent on vibrational energy than translational energy. At low pF-H vibrational momentum =0.1, the translational pH-H energy has to be many magnitudes larger to result in a successful reaction. At pH-H = -4, the reaction is still unsuccessful, as presented in figure 28. On the other hand, when the translational energy is low, pH-H=-0.3, a vibrational energy of a smaller magnitude will result in a successful reaction, pF-H=-3. This reaction is shown on a potential energy surface figure 29 This shows that the reactive trajectory is much more dependent on the vibrational energy over the translational energy and hence corresponds to Polanyi's rule.
| Unreactive trajectory | |||
|---|---|---|---|
| rF-H | rH-H | pF-H | pH-H |
| 0.74 | 2.3 | 0.1 | -4 |
| Reactive trajectory | |||
|---|---|---|---|
| rF-H | rH-H | pF-H | pH-H |
| 0.74 | 2.3 | -0.3 | -3 |
-
 Figure 28- Unreactive trajectory of reaction between HF + H
 -
 Figure 29- Reactive trajectory of reaction between HF + H


Jas213 (talk) 20:42, 28 May 2018 (BST) Good discussion of Polanyi's rules, a conclusion would have been nice.
References
- ↑ Chemical Kinetics and Dynamics (2nd Edition) J.I. Steinfield, J.S. Fransisco, W.L. Hase
- ↑ Dynamics of the Reaction of Methane with Chloride Atom on an Accurate Potential Energy Surface G. Czako, J.M. Bowman Science, 2011 Vol. 334, Issue 6054
- ↑ Molecular Reaction Dynamics R.D. Levine Cambridge University Press
- ↑ Theoretical Study of the Validity of the Polanyi Rules for the Late-Barrier Cl + CHD3 Reaction Z. Zhang, Y. Zhou, D.H. Zhang Journal of Physical Chemistry 2012 Vol. 3, Issue 23