MRD:Bl1718
Exercise 1: H-H-H system
Dynamics from the transition state region
On a potential energy surface diagram, how is the transition state mathematically defined? How can the transition state be identified, and how can it be distinguished from a local minimum of the potential energy surface?
δV(ri)/δri=0
Transition state is defined as the derivative of potential energy at a local maximum. To distinguish from a local minimum, you can look at the second derivative of the point, if it is smaller than zero it is a maximum.
Be careful, the transition state is defined by the partial derivatives with respect to the reaction co ordinate and orthoganol to this. Rs6817 (talk) 14:04, 4 June 2020 (BST)
Trajectories from r1 = r2: locating the transition state
Report your best estimate of the transition state position (rts) and explain your reasoning illustrating it with a “Internuclear Distances vs Time” plot for a relevant trajectory
The best estimate of the transition state position is 90.82 pm.
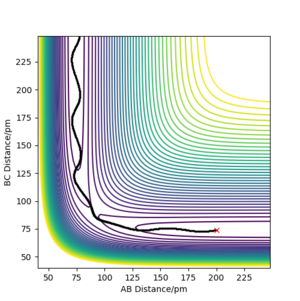
As H + H2 surface is symmetric, the transition state must have r1 = r2 which means rAB = rBC. At transition state, the potential energy reaches its maximum while kinetic energy equals to zero. The transition state distance is found by minimizing the force between atoms,as shown in Figure 1.
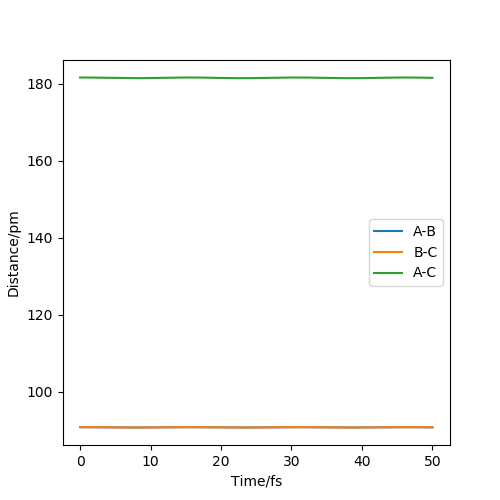
The ' Internuclear Distance vs Time' plot (Figure 2) at 90.82 pm shows a straight line suggesting there is no vibration between atoms.The internuclear distance is constant in time because there is no force at transition state.The kinetic energy is close to zero at this point.

Good reference to the figures and correct answer. Rs6817 (talk) 14:07, 4 June 2020 (BST)
Trajectories from r1 = rts+δ, r2 = rts
Comment on how the mep and the trajectory you just calculated differ
The graphs of mep are smooth line while all graph of trajectory occur as oscillation. This is because dynamic calculation taken atomic mass and phase conditions into account, the energy is converting between kinetic energy and potential energy. Therefore, the inertial motion causes in oscillation on the graph. As for mep, no potential energy is encountered so it shows a smooth trajectory.It is also aware that the r1 of mep stops at 194 and r1 of dynamic goes to infinity.


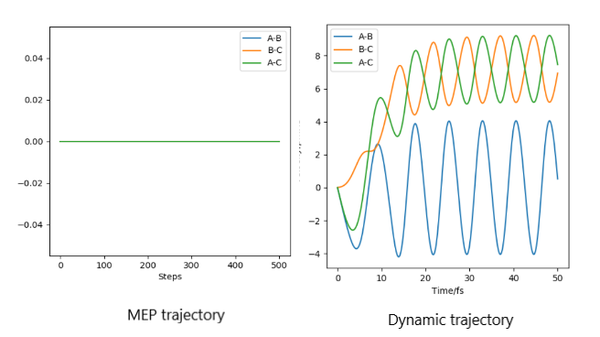

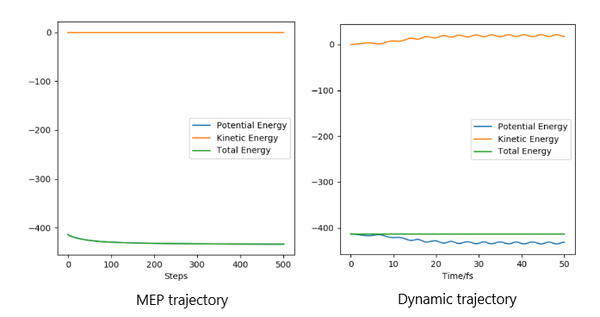
By switching the values of r1 and r2, the shape of the trajectory does not change. This shows that the trajectory is the same for both side of transition state.(Figure 10)
There is a lot of information here and your point is therefore hard to understand. Make sure to refer to each figure if you intend to use it to support your discussion. At the moment I cna only see refernece to figures 3 , 4 and 10. Rs6817 (talk) 14:09, 4 June 2020 (BST)
Reactive and unreactive trajectories
Complete the table above by adding the total energy, whether the trajectory is reactive or unreactive, and provide a plot of the trajectory and a small description for what happens along the trajectory. What can you conclude from the table?
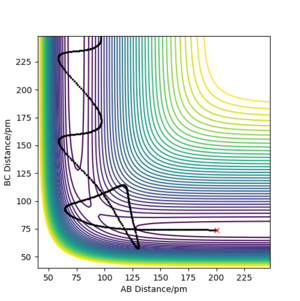
In conclusion, the reactivity of a reaction is not related to its kinetic energy. Although some systems have enough energy to cross the activation barrier. The reactants can be reformed by recrossing the barrier.
You need to be careful with your comments here. The trajectories account for one combination of the atoms with a given set of momenta, at a given starting PES position. You indicate that some product had formed in the penultimate reaction. This is not the case, the reaction is actually unreactive in total (the product is not formed). The reaction is related to kinetic energy. Rs6817 (talk) 15:22, 4 June 2020 (BST)
Transition State Theory
Given the results you have obtained, how will Transition State Theory predictions for reaction rate values compare with experimental values?
First, the idea of barrier recrossing breaks the assumption of Transition State Theory (TST). TST predictions calculate the rate without counting the recrossing product ,which will overestimate the reaction rate. Second, energy is considered classic in TST while are quantized in molecular level. This will lead to the overestimate calculation in partition functions and activation energy of the system, which will affect the value of reaction rates.[1]
- ↑ Chapter 10.3,J. I. Steinfeld, J. S. Francisco, W. L. Hase Chemical Kinetic and Dynamics 2nd ed., Prentice-Hall, 1998.
Exercise 2: F-H-H system
PES inspection
By inspecting the potential energy surfaces, classify the F + H2 and H + HF reactions according to their energetics (endothermic or exothermic). How does this relate to the bond strength of the chemical species involved?
F + H2 reaction is exothermic and H + HF reaction is endothermic. By look at the surface plot of two reactions, the reaction occur with an increase in BC distance and a decrease in AB distance. For F + H2 reaction, the energy curve starts at a higher value and ends in a lower value, suggesting the reaction is exothermic. For H + HF reaction, the curve starts at a lower value and ends in a high value, suggesting it is endothermic.
In the reaction, if the total energy of bond breaking is higher than the total energy of bond forming, the reaction is exothermic. This suggests that the bond strength of H-H bond in H2 is higher than the H-F bond.
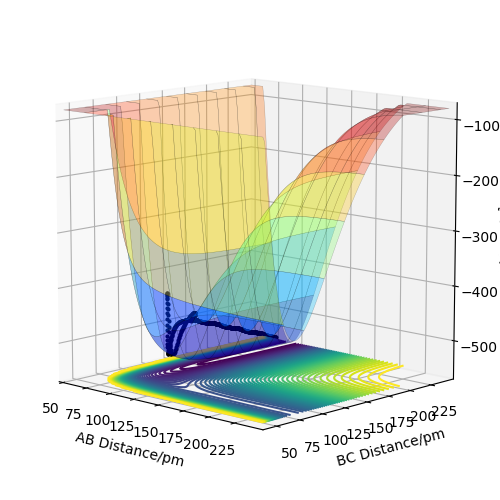

Good classification Rs6817 (talk) 15:26, 4 June 2020 (BST)
Locate the approximate position of the transition state
For F + H2 reaction, the approximate position of the transition state is where rAB = 181.10 pm and rBC = 74.49 pm. For H + HF reaction, the approximate position of the transition state is where rAB = 74.49 pm and rBC = 181.10 pm. In both situations, rAB = r2 and rBC = r1. This is determined by finding the distance when force equals or closes to zero. As F is a bigger atom, the distance between F and H are expected to be bigger.
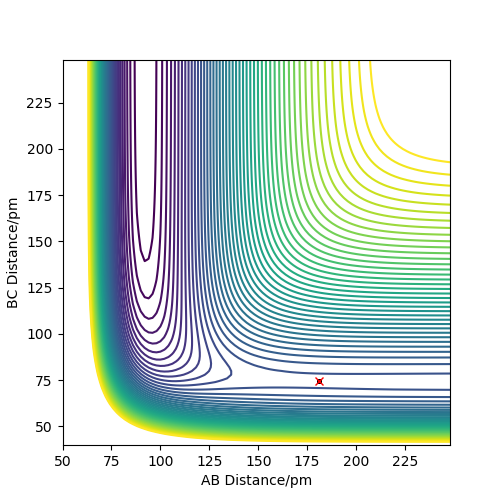
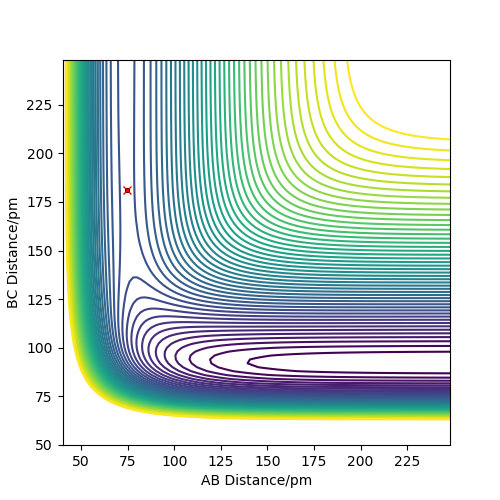
Good, well described. Please refer to the relevant figures in your text. Rs6817 (talk) 15:29, 4 June 2020 (BST)
Report the activation energy for both reactions
The activation energy is the energy at saddle point - energy of reactants.The energy of reactants is determined as the minimum energy by changing r1 while keeping r2 large. For F + H2 reaction, the energy at transition state is -433.981 kJmol-1, the energy of reactants is -435.100 kJmol-1.Thus, the activation energy is 1.12 kJmol-1 for F + H2 reaction. For H + HF reaction, the energy at transition state is -433.981 kJmol-1 and the energy of reactants is -560.600 kJmol-1.Thus, the activation energy for H + HF reaction is 126.6 kJmol-1.

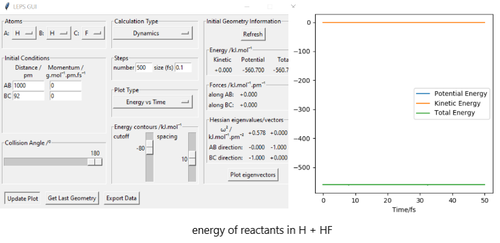
Good but you need to make it clear how your values relate to your figures here. Rs6817 (talk) 16:00, 4 June 2020 (BST)
Reaction dynamics
In light of the fact that energy is conserved, discuss the mechanism of release of the reaction energy. Explain how this could be confirmed experimentally
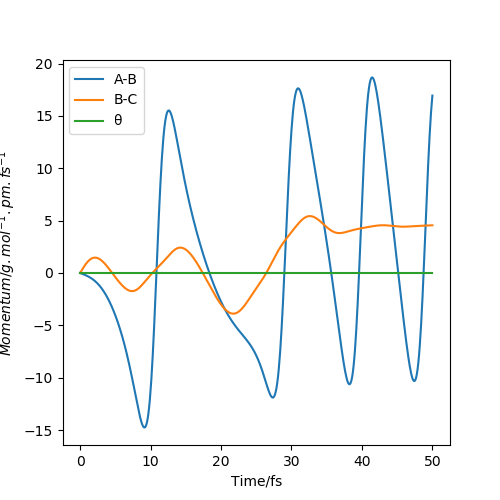
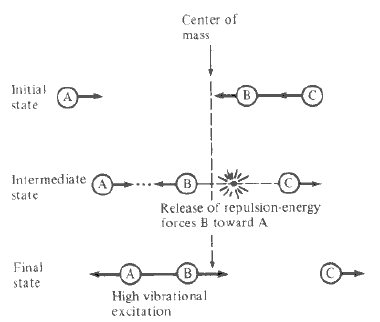
The condition of reaction trajectory is set as the same rHH as its saddle point but a smaller rFH, both momenta are set at zero (i.e. zero initial kinetic energy). From the Animation, the H2 molecule approaches F atom as it vibrates. At a point, the closer H atom is attracted by F and the formed HF molecule starts to vibrate. The rest H atom gains kinetic energy and repulse from the HF molecule. Since the initial kinetic energy in the system is zero, the Animation shows that some vibrational energy is transferred into kinetic energy. This is also shown in Momenta vs Time plot (Figure 17). The increase in amplitude suggests that a gain in kinetic energy. According to the reference, the reaction is occurred on a highly repulsive surface. When the bimolecule approaches F, the repulsion between Hs causes the closer H atom to recoil, pushing the H atom to F and AB vibration is produced.A schematic representation is also shown in the reference. (Figure 18) [1]
- ↑ Chapter 12.3,K. J. Laidler Chemical Kinetics 3rd ed., Harper-Collins, 1987.
As the reaction is exothermic, the release of energy can be measured by a thermometer. However, it may be hard to measure as the reaction is carried out in gas phase. A more accurate way is to use a bomb calorimetry. The reaction takes place in a sealed container in water. Heat from reaction in the sealed metal container flow to the water. The temperature difference of water can be measured and the heat flow can be determined.
How does this relate to the energy release? More detail on how to conduct bomb calorimetry would be useful. Rs6817 (talk) 16:11, 4 June 2020 (BST)
Discuss how the distribution of energy between different modes (translation and vibration) affect the efficiency of the reaction, and how this is influenced by the position of the transition state
Observation of changing initial conditions in F + H2 reaction
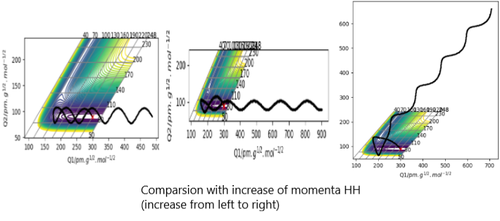
rFH is set at 181.10 pm and rHH is set at 74.49 pm, so the initial potential energy is the same as its transition state.By increasing the momenta, the kinetic energy of biomolecule increases.From the Contour plots, some curves show the presence of barrier recrossing. This suggests that in translation mode, most released energy is gone to vibration energy causing the increase possibility of barrier recrossing. Whereas in vibration mode, most released energy is gone to translation energy, so the repulsed H atom has more kinetic energy. The distribution of energy in two difference modes affect the efficiency of reaction. Vibration mode is more efficient than translation mode. The position of transition state in F + H2 reaction suggests its surface being a Type-I barrier.


Observation of changing initial conditions in H + HF reaction
rFH is set at 92 pm and rHH is set at 220 pm.With an increase in pHH, the trajectory curve to the product region. This shows with enough translation energy, the reaction can occur. In this system, vibration mode is also more efficient than translation mode. As a reverse of the previous reaction, it is considered to have a late-barrier surface.[1]
- ↑ Chapter 12.3,K. J. Laidler Chemical Kinetics 3rd ed., Harper-Collins, 1987.
I tihnk you needed to make Polanyis rules a bit clearer here. Whilst you are correct r.e. the contribution of different types of energy these required further explaantion within the F-H-H system. Rs6817 (talk) 16:15, 4 June 2020 (BST)


