MRD:BaiqiuTang
Physical lab term3: Molecular reaction dynamics
H-H-H system
Defining the transition state
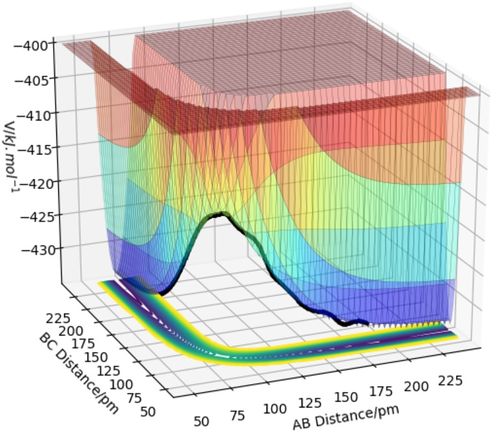
The transition state is the structure of the reactant(s) with the highest energy in the reaction process. As shown in Figure1, the transition state is the global maximum point on the reaction pathway.
In the experiment, it is critical to identify the transition state from the potential energy surface to analyse the progress of the reaction based on the transition state theory. At the transition state, any changes in r1 or r2 will destroy the vulnerable structure and resulting in a decrease in the total potential of the system in either direction of product or reactants. The transition state itself is the saddle point of the curve and is the global maxima on one dimension and the global minima in the other. As a result, the transition state is reached only when the first derivatives of the potential on both dimensions equal to zero, giving: ∂V(r1)/∂r1 = ∂V(r2)/∂r2 = 0. [1]
However, there also exist local maximum and minimum points on the potential energy surface, which fulfil the first derivative condition perfectly. The second derivative is used to examine the actual property of the critical points from mathematics, a maximum, minimum or saddle point. The product of the second derivatives will be negative for the transition state since it is a combination of one maximum and one minimum, giving ∂2V(r1)/∂r12 × ∂V2(r2)/∂r22 < 0. As for local maximum and minimum, these second derivatives will both share the same sign, being positive and negative at the same time and give a product which is always positive. [1]
So, the transition state of the H-H-H system can be defined as ∂V(r1)/∂r1 = ∂V(r2)/∂r2 = 0 and ∂2V(r1)/∂r12 × ∂V2(r2)/∂r22 < 0.
Very good. However, your description on how to distinguish between the local minima and maxima could but put as simply as sign of the second partial derivative. Sf3014 (talk) 14:55, 25 May 2020 (BST)
I've noticed that your references are not linked properly, information on how to do this is on your lab script Sf3014 (talk) 15:12, 25 May 2020 (BST)
Approximation of transition state position (rts)
The transition state position (rts)is found approximately at 90.8 pm. Since the system consists of three identical H atoms, there should be no difference in the transition state of Ha-Hb reacting with Hc or Ha reacting with Hb-Hc. From the symmetry of two reacting possibilities, r1 must be equal to r2 at the transition state, giving: r1 = r2, so r1 and r2 are changed simutaneously. The initial momentum of the hydrogen atoms are set to zero, indicating no initial speed and thus the three atoms can only oscillate due to their internuclear attraction and repulsion. As r1 and r2 setting apporach the rts, the oscillation amplitude will decrease and the distance between the atoms will tend to be less changing. When r1 = r2 = rts under the conditiion of p1 = p2 = 0, it can be observed that all three atoms are fixed and no oscillatin property is existed. Figure3 shows the changing of internuclear distance with time under the condition of momentum set to zero and innitial intermolecular distance set to 70, 80 and 90.8 pm respectively. [2]
Very good but what is the accuracy of your results? If you round up your distances from a value that obtained the graph with fixed atoms, you must also state its accuracy. Sf3014 (talk) 15:02, 25 May 2020 (BST)
Difference between MEP and Dynamics reaction trajectories
Both simulations are conducted under the same condition of the positions r1 = 91.8 pm (rts + 1), r2 = 90.8 pm (rts) and the momenta p1 = p2 = 0 g.mol-1.pm.fs-1. As is shown in Figure4, these two trajectories share many similarities and can give the same potential energy range of the reaction. However, a few differences can still be distinguished. The most obvious difference is the fluctuation trend in the two plottings, the Dynamics plotting shows more fluctuating property than the MEP plotting. This is due to that the MEP algorithm ignores many factors, for example, the atomic mass, atomic inertia, atomic momenta, which can lead to the incorrect simulation of the motion of the atoms and resulting in a more idealistic reaction trajectory which lacks the participation of oscillation. As shown in Figure5, the momentum of the system was fixed at zero when the MEP algorithm applied, while the momentum appears normal when the Dynamics algorithm is applied, which clearly shows the limitation and inaccuracy of the MEP algorithm.[2]
Good but you need to be clearer when referring to your plots, you stated the wrong figure number and didn't refer to your momenta graph when stating that the momenta is zero for mep calculation. Sf3014 (talk) 15:10, 25 May 2020 (BST)
The effect of switching the testing values for r1 and r2
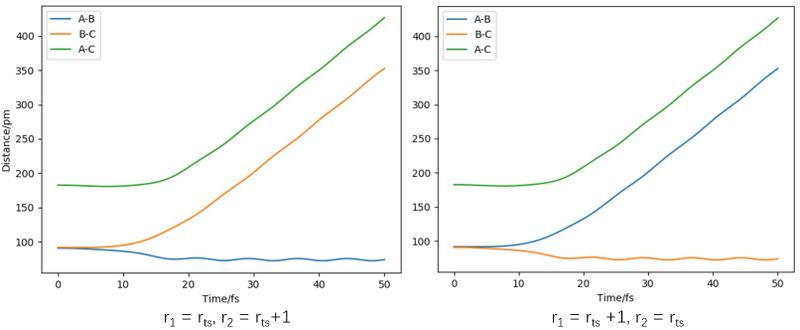
The values for r1 and r2 are switched in this step, giving r1 = rts and r2 = rts + 1. The comparision between the internuclear distances are compared in Figure6. The pathways are generally the same with the plottings of A-B and B-C atoms reversed, which means that the reverse of r1 and r2 will only affect the appearance of the data but share the same result of the reaction.
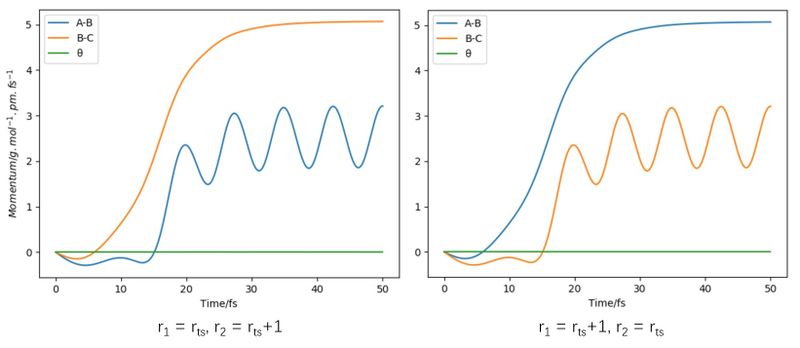
The comparison between the momentum is compared in Figure7 and the pathways are generally the same as the plottings of A-B and B-C atoms reversed. These two results both indicate that the reaction will repeat itself in the identical trajectory, will give the same product and movement of the molecules from the microscopic angle and is the same repetition of itself from the macroscopic angle.
Reactive and unreactive trajectories
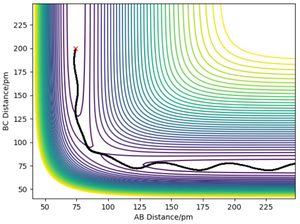
In this section of the experiment, r1 and r2 values are fixed at 74 and 200 pm respectively and the momentum of the reactants varied. The experimental conditin and result are shown in the table below:
Good table layout but description is confusing in the sense that the reactive trajectories were described to have no collision. This is not true because a collision is needed for a reaction to take place Sf3014 (talk) 15:21, 25 May 2020 (BST)
It can be concluded that, firstly, reactants with a lower momentum can decrease the possibility of collisions in the reaction process, form the transition state much easier and avoid the reverse reaction. If there is no collision in the reaction process, the reaction trajectory will pass the saddle point of the momentum surface and take that as the transition state. If one or multiple collisions take place in the reaction, it is not likely that the reaction trajectory will pass the saddle point and the transition state under that reaction circumstance will be shifted to somewhere else. Secondly, the rate of the reaction is connected to the momentum in an inverse proportion relationship, the lower the momentum, the higher the reaction rate. [2] Also, from the result that the reaction can take place under the condition of -3.1 < p1 < -1.6 g.mol-1.pm.fs-1 and p2 = -5.1 g.mol-1.pm.fs-1, a hypothesis can be established that if p1 / p2 falls in the region of [0.314, 0.608] without any collision of the reaction, the reaction will be reactive. The p1 / p2 values are calculated in the table and the first three sets which do not experience collision all fall in the region and underpin the hypothesis.
Your conclusion is very confusing, atoms must interact for a reaction to take place a collision is a must for the reaction to take place. Do you mean that the momenta is related to the energy of the reaction? That statement is true Sf3014 (talk) 15:34, 25 May 2020 (BST)
Reaction rate comparision
The prediction of the reaction rate from the transition state theory will overestimate the reaction rate.
The diagonal of the contour plot of the potential energy graph is called the barrier of the reaction. Based on the hypothesis of transition state theory, if the reaction is reactive then the reaction trajectory should cross the reaction only once. However, recrossing is likely to take place in this reaction to cross the barrier again and take the product in its unstable status back to the reactants state, which indicates the limitation of the transition state theory. In the real circumstances, not all of the reactants at their transition state will enter the product valley. The proportion of the reactants that are able to enter the product valley can be quantified by applying the transmission coefficient. Systems with higher energy at the transition state will be likely to have a smaller transmission coefficient, indicating fewer molecules are likely to give the product compared to the systems with fewer energies and a greater portion of the reactants will experience the recrossing effect at higher possibilities. As for the tunnelling effect, the mass of the H-H-H system is too large to adapt the theory and thus the tunnelling effect can be neglected. [2][3]
Good. More description on how the H-H-H system is too large for quantum tunneling, would be good. Mention the quantum scale and the scale of the H-H-H system and back up your information using references Sf3014 (talk) 15:42, 25 May 2020 (BST)
F-H-H system
Thermodynamic discussion of the reactions
F + H2 reaction
The reaction is exothermic. Figure9 shows a possible reaction trajectory which identified a decrease in the reaction potential energy. From the angle of bond energies, giving the H-H and H-F bond energies at 436 and 568 kJ.mol-1 respectively, the reaction of one mole of the reactants will form one mole of the product, during which one mole of H-H bond will break and one mole of H-F bond will be formed, and releasing 132 kJ of heat as the change of enthalpy of the reaction. The F + H2 reaction is an early transition state reaction with a relatively low activation energy.
H + HF reaction
The reaction is endothermic and should identify an increase in the potential energy of the reaction. From the angle of bond energies, the reaction of one mole of the reactants will form one mole of the product and consume 132 kJ of heat during the process. The F + H2 reaction is an late transition state reaction with a relatively high activation energy.
Very good, but refer to your plot to aim your discussion. Also where did you get those bond energies? Reference, please. Sf3014 (talk) 15:45, 25 May 2020 (BST)
Transition state identification
F + H2 reaction
In this reaction r1 and r2 no longer share the same value and must be adjusted one by one. The value for r2 was set to 74 pm, which is equal to the bond length of H-H bond, while the value for r1 at the transition state still need to be found out in the experiment. The momentum of the system was set to zero to avoid any initial kinetic interference. The transition state is found at approximately r1 = 182 pm and r2 = 74 pm.
Very good. Why did you chose a r2 value equal to the H-H bond distance? And how do you know the H-H bond distance? Sf3014 (talk) 15:48, 25 May 2020 (BST)
H + HF reaction
Activation energies identification
F + H2 reaction
The activation energy of the reaction can be calculated from the difference between the transition state and the reactant state. The reactant state can be approximated by eliminating the interaction between the fluorine atom and the hydrogen molecule by expanding their distance greatly. The relationship between the distance of the fluorine atom and hydrogen molecule (r1) and the energy of the state is shown in the table below:
| F-H distance (r1) pm | H-H distance (r2) pm | Energytot kJ.mol-1 |
|---|---|---|
| 182 (transition state) | 74 | -433.945 |
| 200 | 74 | -434.141 |
| 400 | 74 | -435.087 |
| 600 | 74 | -435.100 |
| 800 | 74 | -435.100 |
| 1000 | 74 | -435.100 |
At the transition state, r1 = 182 pm and r2 = 74 pm,the total energy of the system is found to be -433.945 kJ.mol-1. When the distance between fluorine atom and the hydrogen molecule is increased, the interaction between is greatly decreased and a plateau of the total energy is found at -435.100 kJ.mol-1, which will be taken as the state energy of the reactants. The activation energy can be found as the difference of the state energies to be 1.155 kJ.mol-1.
Very good descriptions on finding the activation energies for both reaction directions Sf3014 (talk) 15:55, 25 May 2020 (BST)
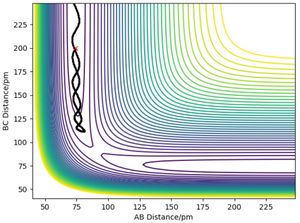
The release of the energy of this reaction will tend to end in the form of vibration. as shown in Figure10, the bond length of the product will periodically oscillate and the momentum of the product will also change periodically within a certain range.
Very good but your discussion on the conservation of energy needs more detail. How can you measure this experimentally? Sf3014 (talk) 15:55, 25 May 2020 (BST)
H + HF reaction
The same method applied, the F-H bondlength was fixed at 92 pm and used the same transition state of the F-H-H system. The relationship between the distance of the hydrogen atom and HF molecule (r2) and the energy of the state is shown in the table below:
| F-H distance (r1) pm | H-H distance (r2) pm | Energytot kJ.mol-1 |
|---|---|---|
| 182 (Transition state) | 74 | -433.945 |
| 92 | 50 | -112.980 |
| 92 | 74 | -424.096 |
| 92 | 100 | -517.680 |
| 92 | 200 | -559.348 |
| 92 | 500 | -560.698 |
| 92 | 1000 | -560.700 |
| 92 | 2000 | -560.700 |
At the transition state, r1 = 182 pm and r2 = 74 pm,the total energy of the system is found to be -433.945 kJ.mol-1. The state energy of the reactants is taken as -560.700 kJ.mol-1. The activation energy can be found as the difference of the state energies to be 126.755 kJ.mol-1.
Discussion of energy distribution between translational and vibrational modes
The trajectories of the reactions with early transition state are mainly controlled by translational energies. In contrast, the trajectories of the reactions with late transition state are mainly controlled by vibrational energies. The enthalpic properties of the reaction, exothermic or endothermic, are not as critical as the position of the transition state, early or late, on the impact of the reaction trajectories.[2][4]
Yes but this is not a discussion. Your statement needs to be backed up with evidence and observations (e.g. example trajectory plots that vary the momenta that contributes to the vibrational and translational energies) which needs to be concluded and linked to known behaviours, ie Polanyi's rules. Sf3014 (talk) 16:01, 25 May 2020 (BST)
Reference list
1.Bostock, L.; Chandler, S.; Rourke, R. (1985) Further pure mathematics. Oxford: Oxford University Press.
2.Laidler, K. (1987) Chemical kinetics. New York: Harper & Row.
3. Atkins, P., Keeler, J. and Paula, J. (2018) Atkins' Physical Chemistry. Oxford: Oxford University Press.
4.Steinfeld, J., Francisco, J. and Hase, W. (1999) Chemical Kinetics And Dynamics. Upper Saddle River, N.J.: Prentice-Hall.


