
MRD:BS3314
Molecular Reaction Dynamics lab report
How transition states can be distinguished on potential energy surface
Best estimate of transition state position
r(ts)=r1=r2=0.908Å
![]()
Difference between reation path and dynamic trajectory of H+H-H system

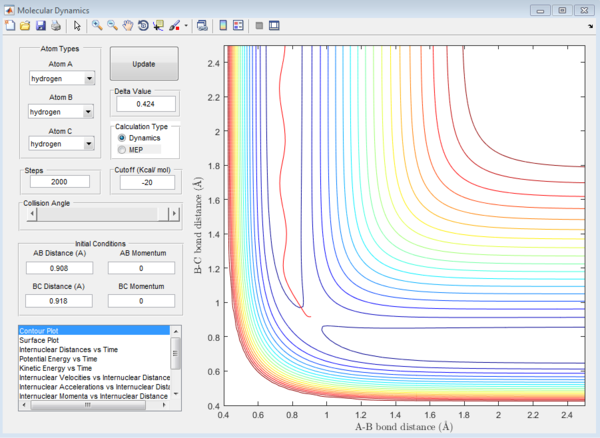

For the above two graphs, the left one is a screen shot of the mep calculaitons of H+H2 system when r1=0.908Å+0.01Å and r2=0.908Å. The right one is the dynamic calculation of H+H2 system at the same initial conditions as those in the left graphs.I can be seen clearly that in the left plot, the reaction path follows the trend of the product trajectory but has a much smoother and straighter line. While in in the right plot, the trajectory has a more waved line. These differences between mep and dynamic plots give proofs to the fact that dynamic calculation is a better resemblance of the real motion of the molecules during reactions. By analysing the 'internuclear distance Vs Time' and 'internuclear momenta Vs Time' plots the final positions of the molecules were found to be: r1=36.915Å, r2=0.734Å and the corresponding momenta are: p1=2.481, p2=1.547
By submitting the final conditions above into the dynamic calculation with only the momenta values negative, a similar contour plot is produced. However, both the 'internuclear distances Vs time' plot and the 'internuclear momenta Vs time' plot are reversed compared to the plots above. This is because the initial conditions of this calculation are the final conditions of the above calculation, meaning that the reactants of this calculation are the products of the last calculation.Thus the reactant trajectory of this reaction is the reverse of the product trajectory of the last calculation.

reactive and unreactive trajectory
| p1 | p2 | p3 | |
|---|---|---|---|
| -1.25 | -2.5 | reactive(plot1) | The trajectory starts from the reactant part and passes the transition state continuing to form the product trajectory |
| -1.5 | -2.0 | unreactive(plot2) | The trajectory can not pass the energy barrier at the transition state and so it reverses back along the reactant path |
| -1.5 | -2.5 | reactive(plot3) | Similar to plot 1, the trajectory passes the transition state easily |
| -2.5 | -5.0 | unreactive(plot4) | The trajectory passes the transition state but reverses back again. The energy barrier is crossed but no products are formed |
| -2.5 | -5.2 | reactive(plot5) | The trajectory passes the transition state before it reverses back a bit and then carries on to form the product trajectory |
plot 1 .PNG) plot 2
plot 2 .PNG)
plot 3 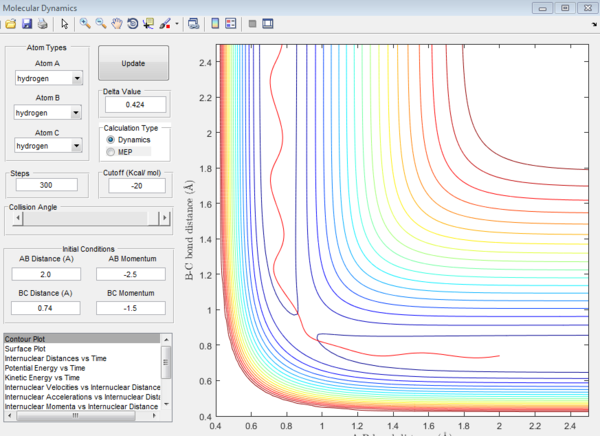
.PNG)
plot 4 .PNG)
plot 5 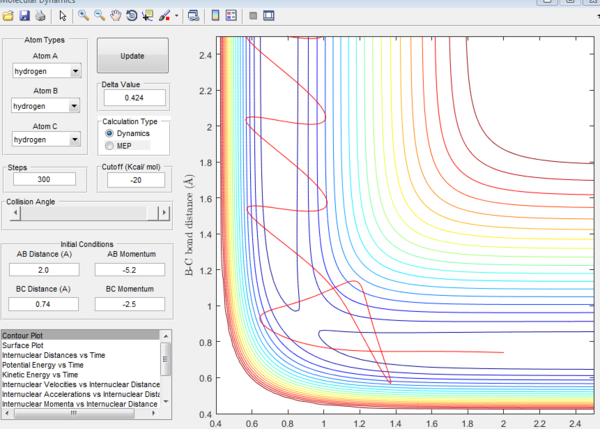
.PNG)
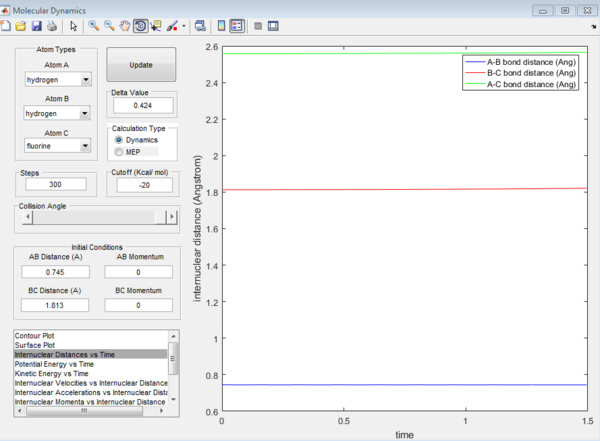
F-H-H System
F+ H-H reaction is exothermic while F-H+H reaction is endothermic. This is because the F-H bond is much stronger than the H-H bond so it requires more energy to break the H-F bond during the reactions. For the F+ H-H system, the transition state position is r1=0.744, r2=1.812

For the H+ H-F system, the transition state position is r1=1.813, r2=0.745
For the F= H-H system, the activation energy is -103.3 kcal/mol For the H+ H-F system, the activation energy is -103.3 kcal/mol
reactive trajectory for F+ H-h


How efficiency of reaction can be affected
The F+ H-H system has an attractive potential energy surface, while the H+ H-F system has a repulsive potential energy surface. An attractive energy surface has an early transition state and the repulsive surface has a late transition state. Therefore the attractive surface requires high translational kenetic energy to pass the transition state position, while the repulsive surface requires the reactant to have high vibrational energy.(1)
<ref name="Atkins and de Paula: Physical Chemistry, 7th Edition">