MRD:BMFG1417
Part 1: H2 + H
Question 1: On a potential energy surface diagram, how is the transition state mathematically defined? How can the transition state be identified, and how can it be distinguished from a local minimum of the potential energy surface?
A transition state sits on a saddle in the potential energy surface diagram. On a PES, we need to consider two variables f(x,y), in this case lengths r1 and r2, which are orthogonal axis. A saddle is a kind of stationary point where one variable is at a minimum and the other is at a maximum. So, if both partial first derivatives are at zero. this tells us we have a stationary point, which can be a saddle, a maxima or a minima. A saddle will increase in some directions and decrease in the other axial direction:
/ = fx = 0 and / = fy = 0 tells us it is a stationary point
Then from a two dimensial Taylor expansion: fxxfyy - fxy2 < 0 tells us that we have a saddle point, and moving in one direction isa positive change, and in the other direction it is a negative change.
can these directions be chosen arbitrarily? Fdp18 (talk) 11:10, 27 May 2019 (BST)
Question 2: Estimate TS distances
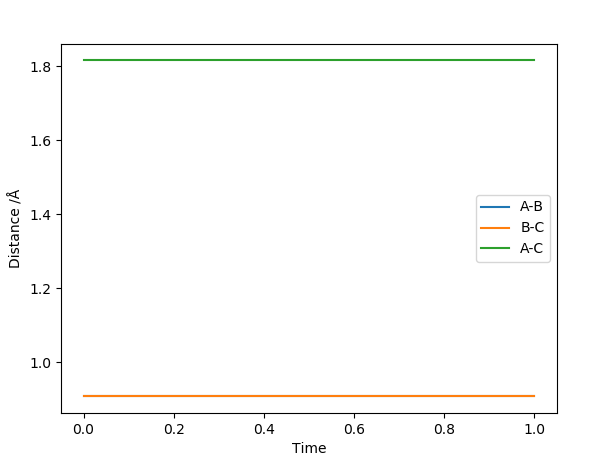
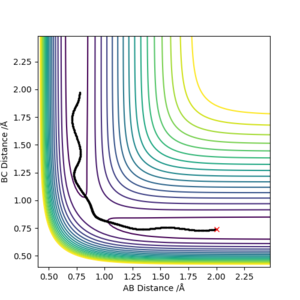
The estimated distance for the transition state is 0.907742 Å. An initial estimate was made by looking at the position of the ridge position in the potential energy surface plot (around 0.9) and, considering that we have a homonuclear system, the bond lengths r1 and r2 had to be similar. With these two constraints, you could then look at the force values from the programme, and move gradually closer to a value of 0.000 by shifting between negative and positive values. At energy 0, the molecule is sitting on a maxima and doesn't have enough energy to move in either direction.
Question 3: MEP VS dynamics Calculation
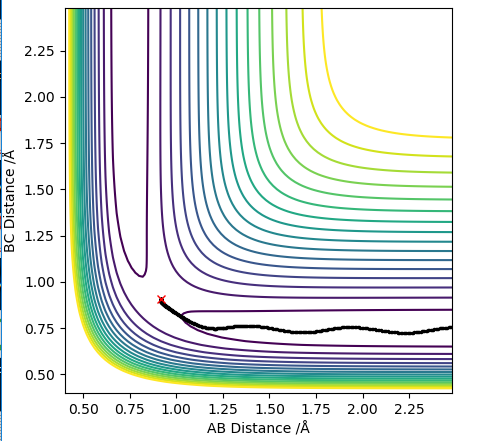
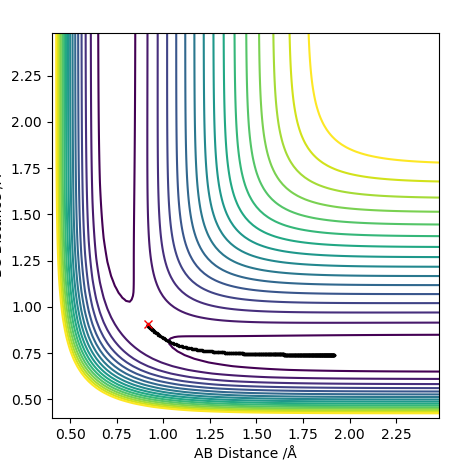
A MEP calculation provides the shortest trajectory (a "path of least resistance"), where the molecule has no momentum therefore no vibrational energy. On the other hand, the dynamics calculations look at the trajectory of inertial motion (the trajectory under no external forces) therefore at a non-zero momentum. Comparing the trajectories it is clear that the dynamics calculations also considers vibrational stretches of the diatomic, which result in this oscillation in the potential energy from compression and elongation of the bond.
| Dynamics Trajectory | MEP trajectory |
|---|---|
 |
|
Question 4: What can you conclude from the table below?
ADD OVERALL ON THE SIGNIFICANCE
is that a marker for something missing? Fdp18 (talk) 11:13, 27 May 2019 (BST)
Question 5: State what are the main assumptions of Transition State Theory. Given the results you have obtained, how will Transition State Theory predictions for reaction rate values compare with experimental values?
Assumptions in the Transition State Theory [1]:
1) Once past the TS, the molecular system cannot reform the reactant.
2) The transition state is in equilibrium with the reactant.
3) The transition state motions can be treated classically.
That might sound trivial, but it's good that you reference the theories you use. Fdp18 (talk) 11:14, 27 May 2019 (BST)
At the saddle point (which lies lower than the fully dissociated H+H+H system or of the fully associated H-H-H), there is a concentration of the transition state (or activated complex) that is in equilibrium with reactant. Because it is found at a higher point relative to the energy axis, the population distribution is governed by the Boltzmann and depends on delta E.
So the transition state theory separates into reactants, products and the region in between, d, the transition state.
How does this compare to reality: The first assumption is clearly a strong deviation from reality if we look at systems like those modelled in example 4 and 5 from the table above as well as any reversible reaction. Because it doesn't consider that the product can go back into the reactant, the theoretical rate for the transition state theory will be higher that the one observed. Secondly, it does not allow for phenomena such as tunneling: in these cases the transition from reactant to product does not involve climbing up an activational barrier but rather "tunnel" through it. This is an effect of quantum theory. It also ignores the quantisation of energy levels by treating the TS classically, though this is minor.
Part 2: F-H-H
PES inspection
- By inspecting the potential energy surfaces, classify the F + H2 and H + HF reactions according to their energetics (endothermic or exothermic). How does this relate to the bond strength of the chemical species involved?
- Locate the approximate position of the transition state.
- Report the activation energy for both reactions.
By looking at the potential energy surface, the reactants axis is elevated from the product axis. This means a negative delta E between reactant and product, which means that the reaction is exothermic. This is confirmed by the bond energies: FH = 565 kJ/mol and HH = 432 kJ/mol --> HF is a stronger bond so the formation of FH minus the breakage of HH releases 133 kJ/mol.
You don't state here which reaction of the two you are looking at - so 'reactants' and 'products' is not defined. Fdp18 (talk) 11:18, 27 May 2019 (BST)
Where do you have the bond energies from? Is there a reference? Fdp18 (talk) 11:19, 27 May 2019 (BST)
To locate the TS distances, we need to use Hammond's postulate and the fact that in an exothermic reaction there is an early TS. closer to the reactant, therefore resembles the reactants.
Distances are:
F-H = 1.8115 Armstrong and H-H = 0.7448 Armstrong This combination gives the location of the ridge, where a molecule with 0 momentum would be stable.
Ångström. Armstrong is someone else. Fdp18 (talk) 11:21, 27 May 2019 (BST)
Activation energy:
Ea backward = product - TS = 133.788 - 103.226 = 30.562 kcal/mol
Ea forward = reactant - TS = 104.006 - 103.226 = 0.780 kcal/mol
Therefore delta Enthalpy between product and reactant = 30.562 - 0.780 = 29.782 kcal/mol
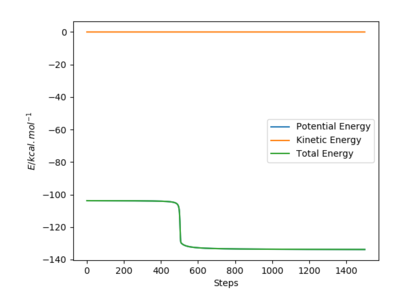
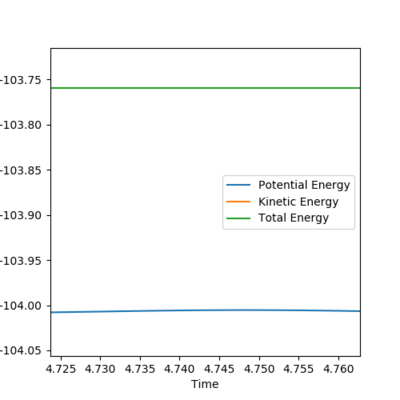
Reaction Dynamics
- In light of the fact that energy is conserved, discuss the mechanism of release of the reaction energy. Explain how this could be confirmed experimentally.
An initial set of conditions that makes the forward reaction proceed requires giving some momentum to the atoms. For example, an F-H momentum of -1, F-H bond distance = 1.8 A and H-H = 0.74 Armstrong.
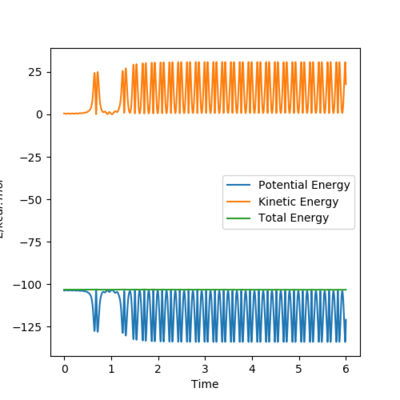

The figures above show the energy released via bond formation is conserved and converted into vibrational energy of the resulting HF molecule. The graph of internuclear distances vs time shows the HF molecule (in blue) oscillating between the vibrational states. The HH molecule dissociates and the H atom translates (green line).
The crossover of the lines between 0.6 and 1.2 s shows that initially the reaction bounces back into the reactants area because it has too much vibrational energy, to then bounce back again into the product.
Experimentally this could be shown with a calorimetry experiment: the energy released from the bond formation is converted into vibrational energy. The vibrational energy would be dissipated to the water and an increase in temperature would be observed.
That is a valid approach. On a side note, there is also a really fancy 'application': The hydrogen fluoride laser!Fdp18 (talk) 11:28, 27 May 2019 (BST)
- Discuss how the distribution of energy between different modes (translation and vibration) affect the efficiency of the reaction, and how this is influenced by the position of the transition state.
Polanyi's Empirical Rules [2] state that: for an endothermic reaction, where the transition state saddle is found closer to the product (therefore a 'late-barrier'), vibrational energy is more efficient than translational energy in promoting the forward reaction.
As addressed earlier, the forward reaction for F + H2 is exothermic, therefore the forward reaction would be favoured by translational energy. In order to achieve this, we would require the momentum of the starting material to be low, such that H2 has a low vibrational energy and makes the trajectory reactive. good report, hardly anything to complain about. good job. Fdp18 (talk) 11:29, 27 May 2019 (BST)

