MRD:BD98
Molecular Reaction Dynamics Lab Bence Dallos
EXERCISE 1: H + H2 system
Explanation of a Transition State
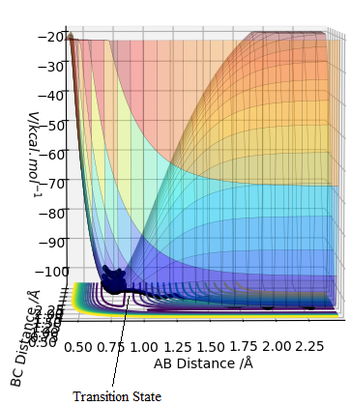
The transition state is defined as the maximum of the minimum energy path way between the reactants and products. The transition state mathematically is a saddle point ("pringle" analogy) defined as a point at which the function of the potential energy surface of variables RAB and RBC have neither a minimum or maximum value. The potential energy at this point is equal to 0, hence the equation ∂V(ri)/∂(ri)=0 applies here as well. This saddle point can be both a minimum or a maximum depending on which position on the point we are observing from. In a way this point can be interpreted as a "hybrid" between max and min points, not a local minimum that is always a minimum from every point.
Perhaps a slight change in wording eg, TS is a maximum on the LOWEST energy path linking products and reactants. Sure, what about details on the derivative (gradient) of a maximum/minimum, would these be equal to 0, > 0 or < 0? Mys18 (talk) 17:53, 17 May 2019 (BST)
The best estimate of the transition state position (rts)
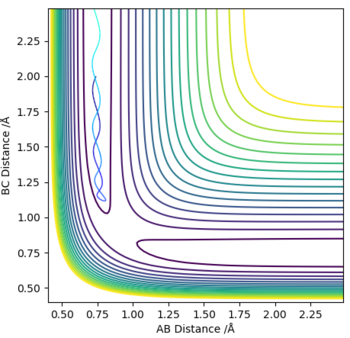
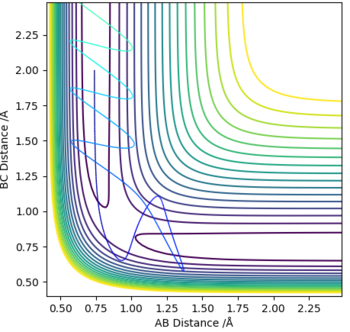
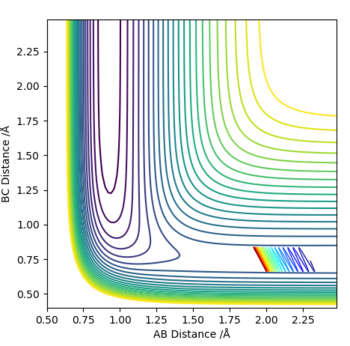
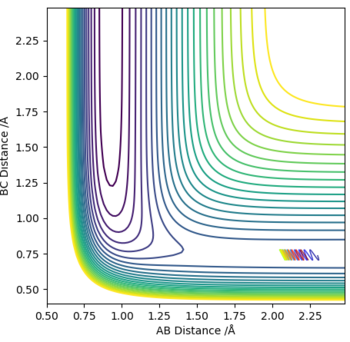
The optimum value for the transition state for the transition state position (rts) is 0.9081 Å. This is the position where no oscillation of the minimum energy path occurs and hence where the transition state position is found. As comparison an Internuclear Distance vs Time graph can also be seen where oscillations occur more frequently.
No Oscillations: 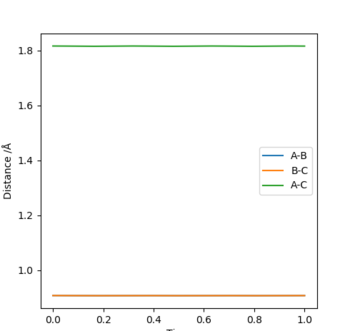

Good and nicely remembered units! It would have been nice to see mentioning of what your set parameters for r1 r2, p1, p2 values were. What do you know about the gradient at the TS/saddle point? Tip: Label your figures so you can link them to your explanation + It is easier for someone to follow your work if everything is labelled. Mys18 (talk) 18:03, 17 May 2019 (BST)
Comparing results to MEP calculation
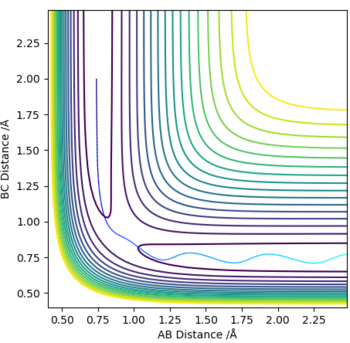
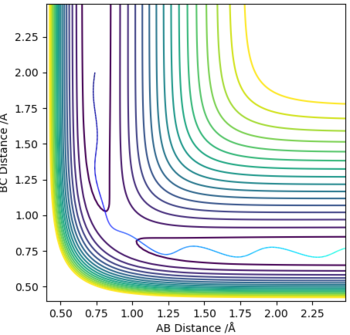
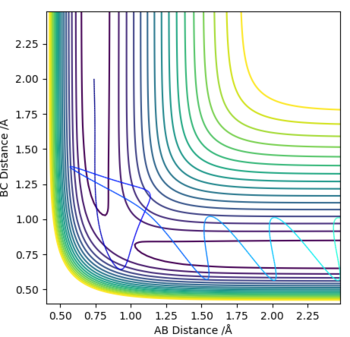
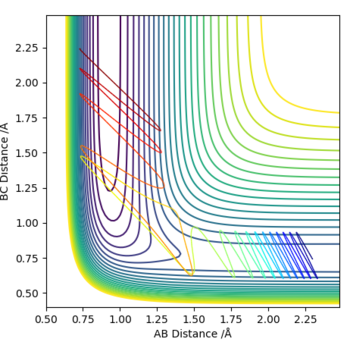
The MEP depicts the infinitely slow motion of an atom where the trajectory is calculated by reseting the momenta at each step of the atom takes,resulting in a straight line graph seen on the right. This method of interpreting the reaction trajectory is less useful and less accurate. A more precise representation of the reaction trajectory can be seen with the Dynamics graph which considers the momenta and the accurate mass of the atoms involved in the reaction.
Dynamics Trajectory: 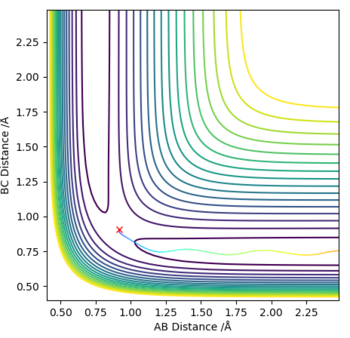
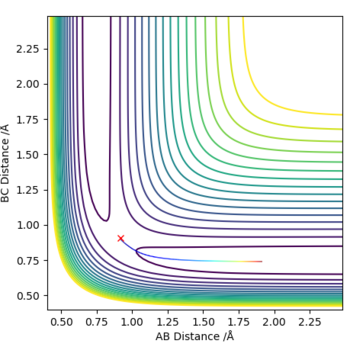
Great, you're right there is a resultant straight line for MEP, but perhaps give more details on this; if the momenta is reset, what is not considered, velocity, ....... and ........ Yes the Dynamic method does consider momenta and so in this case what is conserved? (The ......... motion), and so you do not see that straight line. Mys18 (talk) 18:08, 17 May 2019 (BST)
Reversing initial and final positions
The BC distance is seen to be 8.5 and the AC distance 8, these are the two atoms that's internuclear separation changes in the reaction. The AB distance stays approximately 0.5, constant as these two atoms do not move in the reaction. Momenta is seen to increase as the reaction proceeds as the atoms move and change positions. The average momenta of AB is 1.5, whereas that of BC is 2.5, that of AC is shown to be constant.
Internuclear Distance vs Time: 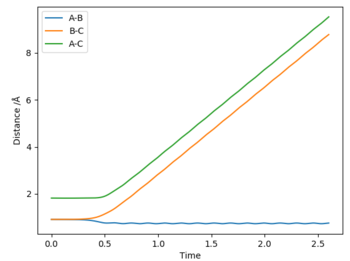

Reactive and unreactive trajectories
| p1 | p2 | Etot | Reactive? | Description of the dynamics |
|---|---|---|---|---|
| -1.25 | -2.5 | -99.119 | Yes | Atoms spend relatively little time spent in Transition State,due to small momentum and energy of atoms.Slight vibration of resultant (BC) molecule is observed. |
| -1.5 | -2.0 | -100.456 | No | No reaction. Atom A does not have enough momentum for reaction to fully occur. In addition, too little energy to overcome transition state. |
| -1.5 | -2.5 | -98.956 | Yes | The atom A approaches molecule at a more even speed than in previous reactions. Slightly longer time spent in TS than for first reaction(Graph 1). |
| -2.5 | -5.0 | -84.956 | No | No reaction occurs. Atom A has the highest energy out of all reactions. All three atoms spend the longest time in the TS, indicating a reaction with a higher energy TS, bigger barrier to overcome. |
| -2.5 | -5.2 | -83.416 | Yes | Similar situation occurs, as observed in previous reaction,except for the fact that atoms now have enough momenta and energy to overcome TS, which appears lower in energy. "Cleaner reaction" is observed. |
Nicely laid out table, correct with the reactivities. Good mentioning of the TS and whether the atom/molecules can sufficiently overcome the barrier. However with ROW 4 (reactivity no), might be worth mentioning reactants are reproduced despite reaching the TS. Aswell as this, is there a similar argument for ROW 5 when the reaction is successful? Regarding your conclusions they seem to be missing in the midst of the table, not to worry, now that you have completed the lab what do you think you would conclude when regarding momenta and reactivity? Mys18 (talk) 18:22, 17 May 2019 (BST)
The Transition State Theory and its main assumptions
The Transition State Theory considers reactions by observing the continuous changes that occur in the potential energies and reaction coordinates of the atoms and molecules involved in the reaction. The transition state of a reaction is usually referred to as the part of the reaction with maximum potential energy. This point represents the minimum energy (activation energy) that a reaction requires to lead to a complete rearrangement of atoms to take place and hence the reaction to go to completion. An example of this is for example reaction 5, where atoms have enough energy to overcome the TS and to lead the reaction to completion.
There are three assumptions made in this theory that are also its limitations: The first is that the Transition State Theory assumes that each intermediate has a lifetime long enough for its energies to be distributed according to Boltzmann's Distribution before the reaction can continue and go to the energy level of the products. Secondly, atoms are considered classically:if an atom doesn't have enough energy to react, it won't (reaction 4). However in the quantum consideration of the reaction, if particles have a certain amount of energy, quantum tunnelling is possible through the barrier. Lastly, the theory doesn't take into account that not all reactions pass through the "saddle point". This might not be true for reactions that occur at higher temperatures, as atoms at these temperatures will populate higher energy vibrational levels, resulting in saddle points a lot higher in energy that the reaction has to progress through. [1]
True, but is reaction 5 solely producing products? perhaps take another look at your graphs for this. The following important assumption not stated may help you consider your answers for the previous questions: 'A molecular system that has crossed the transition state in the direction of a product cannot turn around and reform reactants'. Good, motion of atoms along the TS is treated classically, but what exactly does classically mean? Also, maybe take a look at what famous Born Oppenheimer has to say. Mys18 (talk) 18:31, 17 May 2019 (BST)
EXERCISE 2: F - H - H system
Classification of classify the F + H2 and H + HF reactions according to their energetics (endothermic or exothermic)
Exothermic reaction F + H2 -> HF + H : 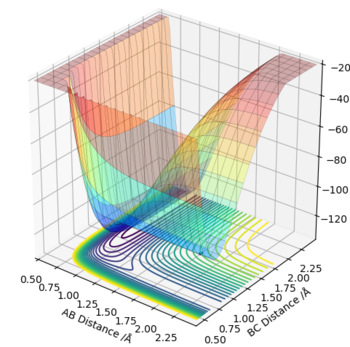
The reactants can be seen at a higher energy on the surface plot than the products. This results in a ΔE=-ve ,indicating an exothermic reaction. Hence in this reaction F + H2 -> HF + H, the H2 bond is a weaker, higher energy bond than the H-F bond that is formed. Energy is released upon forming, the more favourable, lower energy H-F bond which is stronger, hence explaining the exothermic nature of the bond formed.
Endothermic reaction H + HF -> H2 + F : 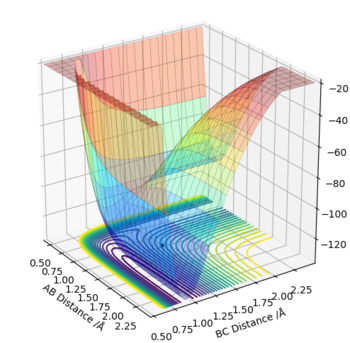
In this case the reactants can be seen at a higher energy on the surface plot than the products. This results in a ΔE=+ve ,indicating an endothermic reaction. In this reaction H + HF -> H2 + F , the opposite to the previous observation is true. The stronger H-F, lower energy bond is broken, requiring the input of energy to form the less favourable, higher energy, weaker H-H bond.
Nice! In terms of bonding, why is the bond in HF strong? Good, the degree of energy for bonds forming/broken resultantly gives you your dE is negative or positive - again, it would have been nice to see energy values for formation of HF,HH and breaking of HH,HF. What would the units for E be in this case? Mys18 (talk) 18:42, 17 May 2019 (BST)
Locating the approximate position of the transition state
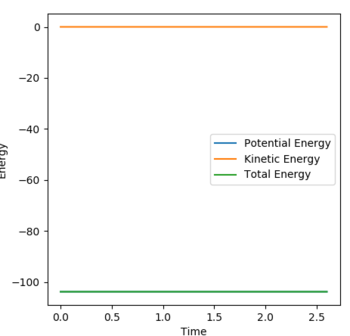
The transition state is found in this reaction by adjusting the H-H and H-F bond lengths to obtain a stationary reaction trajectory, which lies on the position of the Transition State. This is the point during the reaction where the energies of the system are constant as seen below in the energy vs time plot. The optimum A-B bond length is measured to be 1.81 Å and the BC is 0.745 Å. The transition state for both reactions is the same ,as essentially the reactions are the reverse of each other.
Good, perhaps give the bond length values to the same decimal place... Mys18 (talk) 18:54, 17 May 2019 (BST)
The activation energy of the reaction
The activation energy of the reaction can be found by adjusting the bond length of AB slightly (from 1.8 Å to 1.9 Å in this case) to give a slightly differing value to that of the transition state. The difference between the total and potential energy of the reaction can hence be found by considering the values towards the end of the graph. Hence for the reaction F + H2 -> HF + H is ΔEact=-0.151 kcal/mol. The investigated region is shown on the Energy vs Time graph below.
Activation energy graph energy vs time: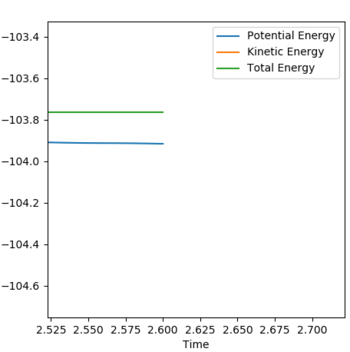
For the reaction H + HF -> H2 + F a different energy is found to be greater than for the previous one due to the reactant and TS being further in energy. The total energy of the reaction (-103.75 kcal/mol) seen on the Energy vs Time plot is equal to the Transition State energy of the reaction. By considering the energy of HF (-131.18 kcal/mol) from the surface plot in the reverse case and taking the difference the activation energy of this reaction is calculated to be +27.43 kcal/mol.
Good explanation as to how you arrived at these values! Mys18 (talk) 18:54, 17 May 2019 (BST)
Reaction dynamics
Discussion of reaction energies and experimental techniques
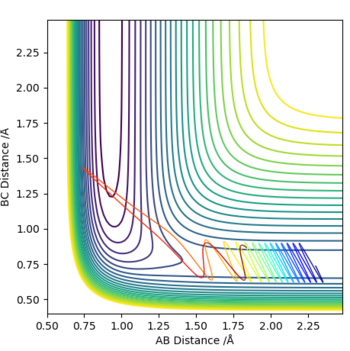
A reactive trajectory is find by setting momenta to 0 and the AB distance to 1.4 Å and the BC to 0.745 Å. The Momenta vs Time and Energy vs Time graphs can be seen below. Initially potential energy is being converted to kinetic (or vibrational) back and forth as the Hydrogen molecule approaches Flourine. Potential energy from the bond is also converted to translational energy as the H2 molecule approaches Fluorine. In addition, potential energy from the H-F bond is converted to translational energy as the H atom leaves the newly formed H-F molecule. Therefore as can be seen from the Energy vs Time graph the total kinetic energy increases, as the form of energy the atoms and molecules in this reaction spend the least amount of time the the "potential energy" state and most in either the kinetic or translational energies. This can be conformed by monitoring the Temperature of the reaction over time to observe an increase of the average kinetic energy(ie. Temperature) of the reaction. [2]
Energy vs Time graph for trajectory: 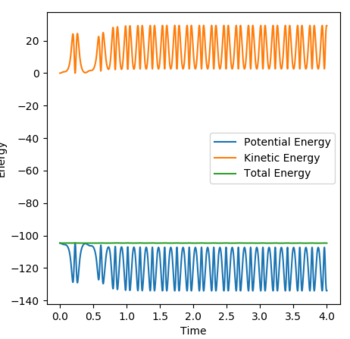
Momenta vs Time graph for trajectory: 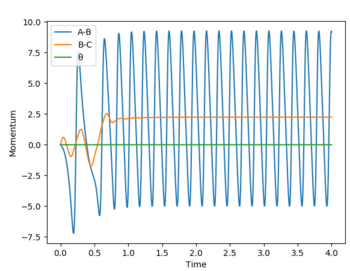
Excellent! How exactly would one measure the temperature using a robust setup? Mys18 (talk) 18:59, 17 May 2019 (BST)
Distribution of energy between modes and how this affects reaction efficiency
The momentum of AB refers to the initial translational energy of the reaction as H approaches F. This energy is converted into vibrational energy,as the H-F bond forms. The momentum BC however is referring to the vibrational energy of the H2 which is converted into translational energy, as the molecule approaches the Fluorine atom.
The two main types of energy that effect the rate of reactions are vibrational and translational energy. Polanyi's empirical rules states that vibrational energy is more efficient in promoting late transition states, whereas translational energy is better at promoting reactions with an early transition state. This can be directly related to to endo (late TS) and exothermic (early TS) reactions. [3]
This reaction is an unreactive one. The H2 molecule doesn't have enough translational energy for it to collide with the Fluorine and react. This is confirmed by the contour plot which shows an exothermic reaction, hence indicating a dominance of vibrational energy over translational.
Violent vibration of the H2 can be seen, however the reaction doesn't occur once again.
Vibration of H2 is seen to be less, this reaction doesn't go to completion either.
This reaction is seen to go to completion after going through several modes of vibration. Since it is exothermic,the transition is early, translation energy promotes the completion of the reaction.
The reduction of energy results in a situation similar to that in Expt 1, where the contour plot of the two reactions are similar with the exception that Expt 1 seems to be a reaction with slightly increased bond vibration.In this case there is not enough vibrational energy to be converted to translational and for the reaction to occur.
Great interpretation of Polanyi's rules. Overall, this is a good report and all questions have been clearly answered. There is definite evidence that you have understood the lab and completed it to a high standard, although it could be improved with inclusion of more finer details for a few of your answers which have been specifically addressed in the report. It was reassuring to see you included the correct units for all the numbers you gave! In terms of formatting and structuring your report, job well done, remember to keep things clear so produce a simple table if possible, or break up a paragraph of text in the form of a list, don't be shy in creating more subheadings. Good work :) Mys18 (talk) 19:07, 17 May 2019 (BST)
Bibliography
- ↑ Laidler, K., & King, M. (1983). Development of transition-state theory. The Journal Of Physical Chemistry, 87(15), 2657-2664.
- ↑ Atkins, P., De Paula, J., & Smith, D. Elements of physical chemistry.
- ↑ Zhang, Z., Zhou, Y., Zhang, D., Czakó, G., & Bowman, J. (2012). Theoretical Study of the Validity of the Polanyi Rules for the Late-Barrier Cl + CHD3 Reaction. The Journal Of Physical Chemistry Letters, 3(23), 3416-3419

