MRD:BC physlab
Molecular Reaction Dynamics Lab
Excercise 1
1) What value does the total gradient of the potential energy surface have at a minimum and at a transition structure? Briefly explain how minima and transition structures can be distinguished using the curvature of the potential energy surface.
In both the minima and the transition state the gradient of the potential energy surface is zero. For the minima, the second derivative is positive in all directions whereas for the transition state the second derivative is negative in the direction from the reactants to the products (as it is a maximum in the minimum energy path) and positive in all other directions.
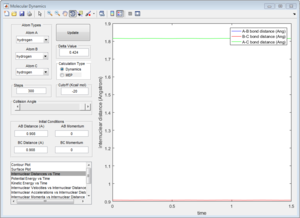
2)Report your best estimate of the transition state position (rts) and explain your reasoning illustrating it with a “Internuclear Distances vs Time” screenshot for a relevant trajectory.
The H + H2 surface is symmetric, so the length of r1 and r2 should be the same at the transition state. This distance was found to be 0.908 A, and it can be observed in the Intermolecular Distances vs Time plot that the A-B bond distance is not observed since it is just below the B-C bond distance since they are the same length. This is further confirmed by looking at the surface point. A single point is observed, confirming that the transition state has been found.

3a)Comment on how the mep and the trajectory you just calculated differ.
At every step of the minimum energy path the velocity is always set to zero and hence the kinetic energy-the molecule doesn't vibrate and hence this is why in the surface plot of an MEP no oscillations are observed whereas in one of Dynamics we do. All the energy at every point is solely potential energy. The computer is constantly looking for the minimum value of the potential energy. The steps in a minimum energy path calculation are proportional to the potential energy gradient - this is why the conditions have to be set different to the transition state because close to the transition state the potential energy changes would be so small that many steps would be required to carry out the calculation. On the other hand, a trajectory calculation shows a physical representation of what is happening. A derivative of the voltage is used to calculate the force, and using F=ma one can calculate the acceleration and hence the velocity and use it to estimate the position of the atom after a certain period of time. In this case the steps correspond to the time periods.

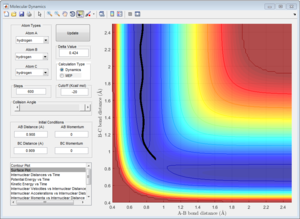


3b) Look at the “Internuclear Distances vs Time” and “Internuclear Momenta vs Time”. Take note of the final values of the positions r1(t) r2(t) and the average momenta p1(t) p2(t) at large t. What would change if we used the initial conditions r1 = rts and r2 = rts+0.01 instead?
The following plots were obtained when the conditions where changed. The main difference is that the lines corresponding to A-B and B-C changed, whereas the one corresponding to A-C always remains constant.


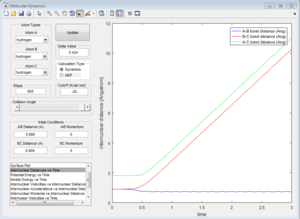

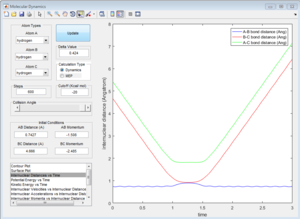
3c) Setup a calculation where the initial positions correspond to the final positions of the trajectory you calculated above, the same final momenta values but with their signs reversed.What do you observe?
Due to conversation of energy, one would expect that if we changed the initial conditions to the final conditions, the graph should return to the transition state. As it can be observed from the graph below, the graph goes very close but not exactly through the transition state, as in the transition state the A-B and B-C distances are the same so they should overlap. We don't observe this because in our initial conditions we displaced slightly from the transition state.
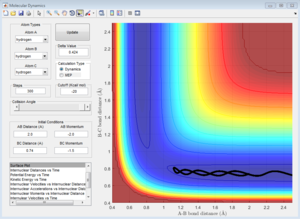
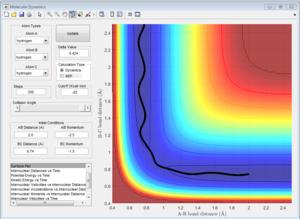
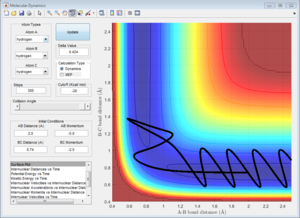
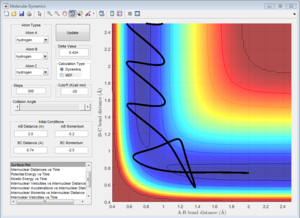
4a) Complete the table by adding a column reporting if the trajectory is reactive or unreactive. For each set of initial conditions, provide a screenshot of the trajectory and a small description for what happens along the trajectory.
4b) State what are the main assumptions of Transition State Theory. Given the results you have obtained, how will Transition State Theory predictions for reaction rate values compare with experimental values?
Transition State Theory Assumptions:[1]
- quasi-equilibrium between reactants and activated transition state complexes
- collision between molecules completely elastic
- intermediates have sufficiently long lifetimes so that they reach a Boltzmann distribution of energies before continuing to the next step
- motion of atoms obeys classical mechanics
- if atoms don't collide with sufficient energy to form the transition state the reaction doesn't occur - effect negligible for reactions with large activation energies but significant when low since tunneling can take place
- the reaction system will pass over the maximum of the minimum energy path - assumption fails at higher temperatures since higher vibrational energy levels are populated, resulting in a more complex motion and hence transition states which may be far away from the lowest energy saddle point
Transition State Theory disregards any other pathway that is not included in classical mechanics, such as tunneling. This means that the rates of reaction calculated experimentally will be much larger than those predicted by Transition State Theory.
Excercise 2
1a) Classify the F + H2 and H + HF reactions according to their energetics (endothermic or exothermic). How does this relate to the bond strength of the chemical species involved?
As it can be observed below, the F + H2 is exothermic whereas the H + HF is endothermic. This makes sense since the bond energy of the H-H bond is 432 kJ/mol[2] whereas the bond energy of the H-F bond is 565 kJ/mol[2] . As one would expect, the HF + H reaction doesn't take place, since the bond energy of the H-H bond is lower than that of the H-F bond, hence why it is endothermic. The reverse argument can be used to explain the first reaction. This is confirmed both in the surface plots and the animation.

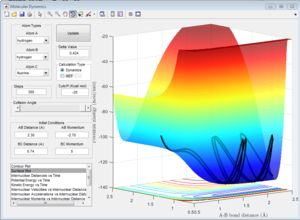
1b) Locate the approximate position of the transition state. Because the activation energy for one of the reactions is so small, it is not easy to locate the transition state immediately. Use the Hammond postulate to guide your search.
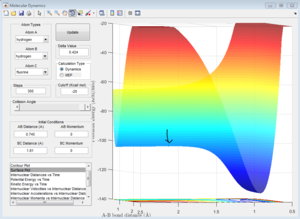
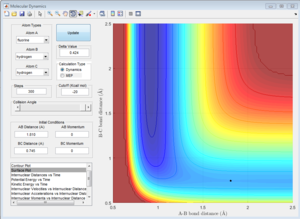
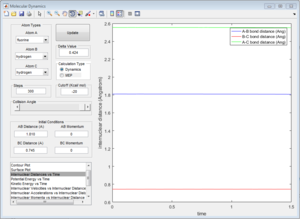
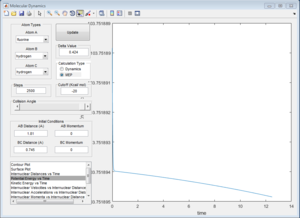
The Hammond Postulate states that the transition state will resemble the structure to which it is closer in energy, that is the products in an endothermic process (H + HF reaction) and the reactants in an exothermic one (F + H2). Since H-F is not a symmetric molecule one wouldn't expect the length of r1 and r2 to be the same at the transition state, compared to before. The transition state was more easily obtained from the H + HF reaction since the activation energy was greater. For both reactions, the bond lengths at the transition state were calculated to be H-H: 0.745 A, and H-F: 1.81 A. This makes sense since in both cases one would expect the transition state to resemble the H2 molecule, which is the product of the H + HF reaction and the reactant of the H2 + F reaction. The bond length of H-H is known to be: 74 pm (0.74 A)[2], which is close to the value calculated. This is confirmed by looking at the Intermolecular Distance vs Time plots, as using the given values the graph is a straight line as one would expect from a saddle point since the derivative is zero. The energy of the transition state was determined to be 103.75 kcal/mol.

1c) Report the activation energy for both reactions.
Many steps were required to carry out both MEP calculations to be able to observe the full curve. The activation energy obtained for the HF + H was approximately 0.2 kcal/mol whereas the one for H2 + F was 30.15 kcal/mol, which confirms the assignments of the exothermic and endothermic reaction.
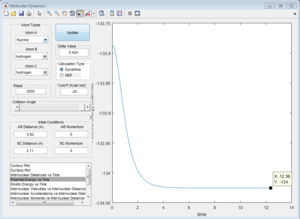

2a) Identify a set of initial conditions that results in a reactive trajectory for the F + H2, and look at the “Animation” and “Internuclear Momenta vs Time”. In light of the fact that energy is conserved, discuss the mechanism of release of the reaction energy. How could this be confirmed experimentally?
A set of conditions that results in a reactive trajectory are H-F distance: 2.30 A and momentum -6, H-H distance: 0.74 A and no momentum. The reaction was unsuccessful at both higher (ex -7) or lower (ex -5) momenta, proving the point that was discussed earlier that greater momentum doesn't necessarily mean a reactive trajectory. Due to the conservation of energy the sum of the kinetic and potential energy must be the same before and after the reaction, and similarly the total momentum of the reaction should be conserved. If the masses of the atoms are known, one can determine the speed and the momentum of the species using Time of flight measurements.[3] The momentum should be the same before and after the reaction.
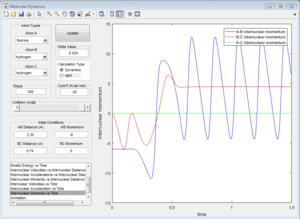
The amplitude of the oscillation of the initial H-H bond is smaller than that of the H-F bond, inferring that the kinetic energy from the F atom has been transferred to potential and vibrational energy of the H-F bond.
2b) Setup a calculation starting on the side of the reactants of F + H2, at the bottom of the well rHH = 0.74, with a momentum pFH = -0.5, and explore several values of pHH in the range -3 to 3 (explore values also close to these limits). What do you observe? Note that we are putting a significant amount of energy (much more than the activation energy) into the system on the H - H vibration. Discuss how the distribution of energy between different modes (translation and vibration) affect the efficiency of the reaction, and how this is influenced by the position of the transition state.
The Polanyi rules[4] state that vibrational energy is more efficient in promoting a late transition state (in endothermic reactions) than translational energy, and the opposite is true for early transition states ( in exothermic reactions).
2c) For the same initial position, increase slightly the momentum pFH = -0.8, and considerably reduce the overall energy of the system by reducing the momentum pHH = 0.1. What do you observe now?
This further confirms Polanyi's rules - as soon as you increase the translational energy in the reaction the trajectory becomes reactive, even though in this case the vibrational energy is very low.

3) Let us now focus on the reverse reaction, H + HF. Setup initial conditions starting at the bottom of the entry channel, with very low vibrational motion on on the H - F bond, and an arbitrarily high value of pHH above the activation energy (an H atom colliding with a high kinetic energy).Try to obtain a reactive trajectory by decreasing the momentum of the incoming H atom and increasing the energy of the H - F vibration.
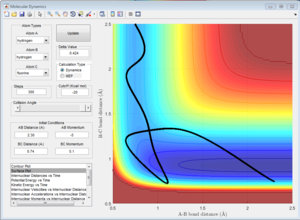
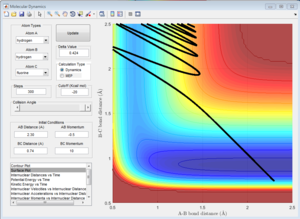
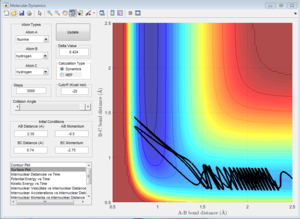
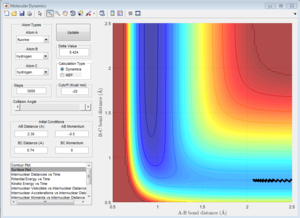
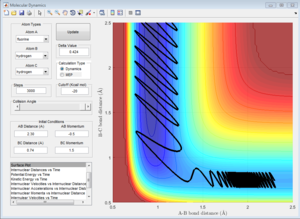
Now we have the opposite case: H + HF is an endothermic reaction therefore one would expect the vibrational energy to be more efficient in promoting the late transition state. In the surface plot to the left, the opposite effect is seen, since the translational energy of H is so high that it is this what drives the reaction. However, the Polanyi's rules are demonstrated by the plot on the right since the translational energy of the incoming H atom is negligible but the vibrational energy of the H-F bond is so big that it drives the reaction and a reactive trajectory is observed.
References
- ↑ IUPAC, Compendium of Chemical Terminology, 2nd ed. (the "Gold Book") (1997). Online corrected version: (2006–) "transition state theory".
- ↑ 2.0 2.1 2.2 http://www.wiredchemist.com/chemistry/data/bond_energies_lengths.html accessed on 25th of May 2017.
- ↑ Time-of-flight techniques for the investigation of kinetic energy distributions of ions and neutrals desorbed by core excitations; Pages 124-129; R. Weimar, R. Romberg, S.P. Frigo, B. Kassühlke, P. Feulner
- ↑ Theoretical Study of the Validity of the Polanyi Rules for the Late-Barrier Cl + CHD3 Reaction Zhaojun Zhang, Yong Zhou, Dong H. Zhang, Gábor Czakó, and Joel M. Bowman The Journal of Physical Chemistry Letters 2012 3 (23), 3416-3419 DOI: 10.1021/jz301649w


