MRD:BB916Phys01
BB916 Physical Computational Labs 08/05/18-11/05/18
Excercise 1: H-H2 system
Initial Constraints, Visualising a Trajectory
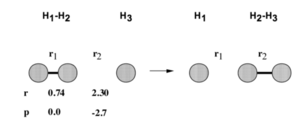
Jas213 (talk) 23:39, 13 May 2018 (BST) Very good that you are displaying your initial conditions.
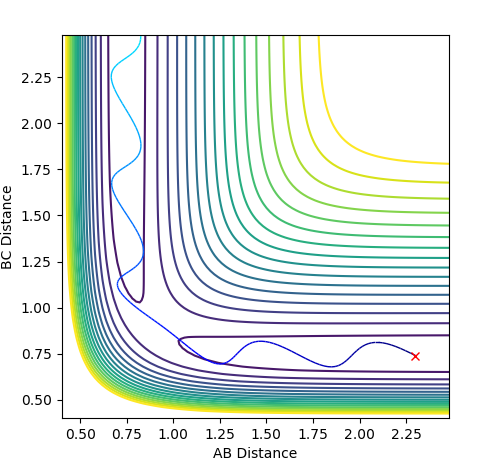
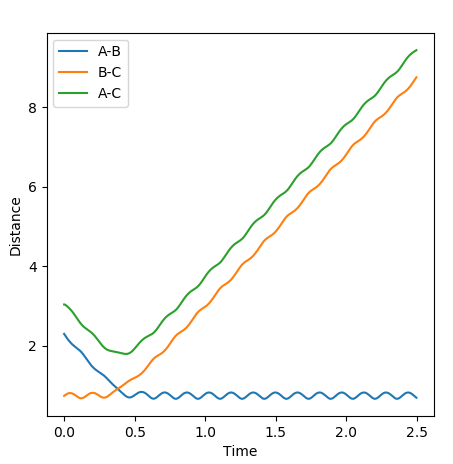
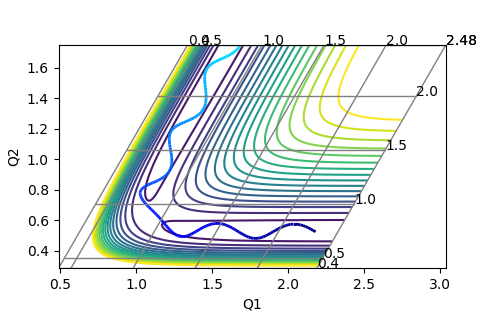
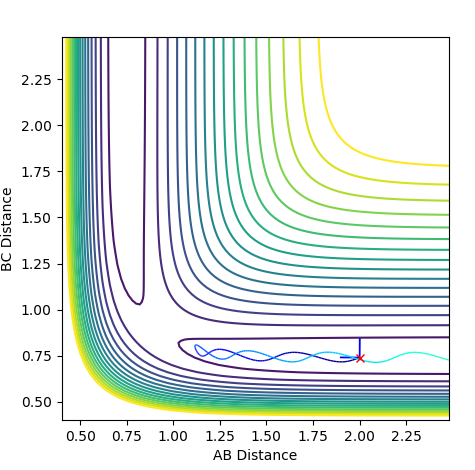
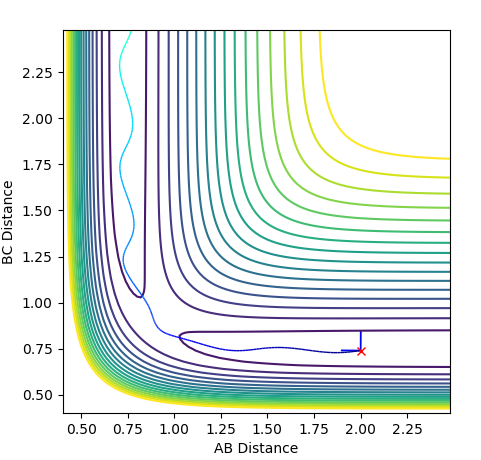
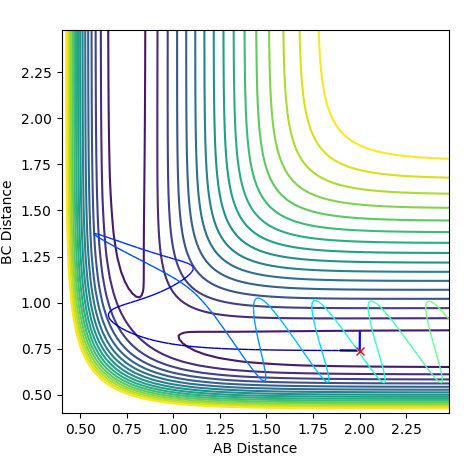
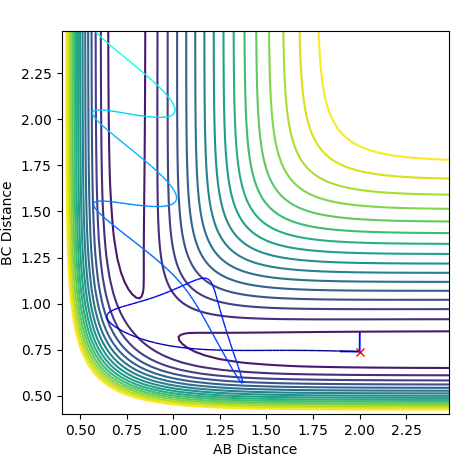
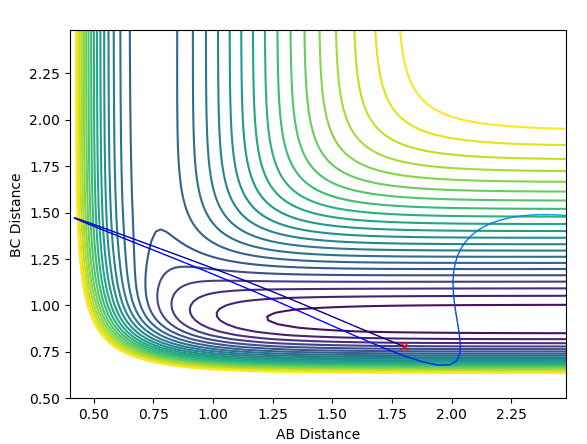
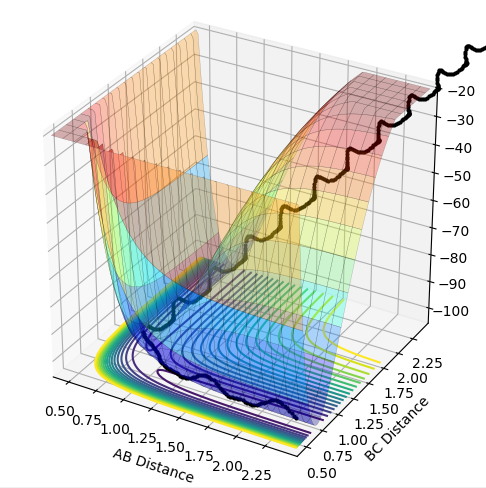
These are the various plots generated using the initial constraints. In each case molecule H1-H2 is represented by BC and so the third atom, H3, is represented by A.
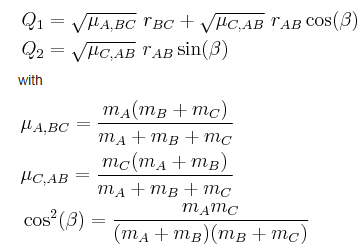
The skew plot produces a potential energy plot with coordinates Q1 and Q2. These new coordinates are defined using:
Jas213 (talk) 23:39, 13 May 2018 (BST) Next time, annotate every plot. Good presentation of your working.
Locating the Transition State
Jas213 (talk) 23:41, 13 May 2018 (BST) Jas213 (talk) 23:41, 13 May 2018 (BST) Units of angstroms would make it even better.
Calculating the Reaction Path
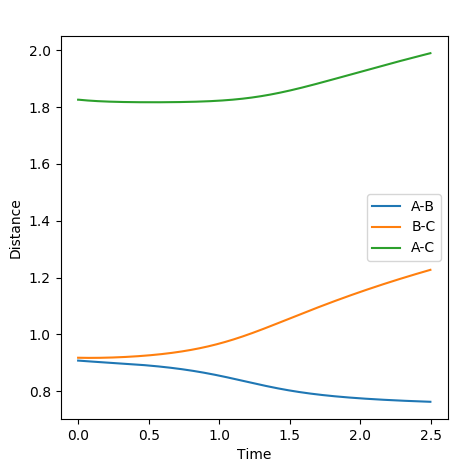
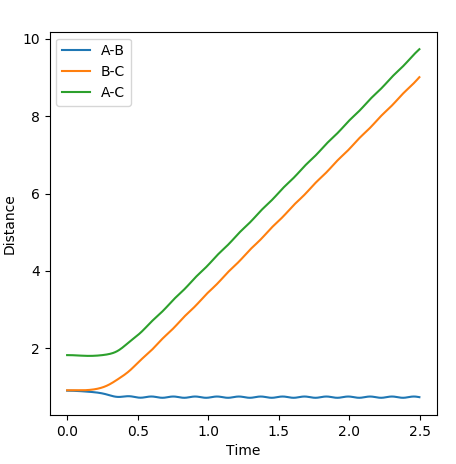
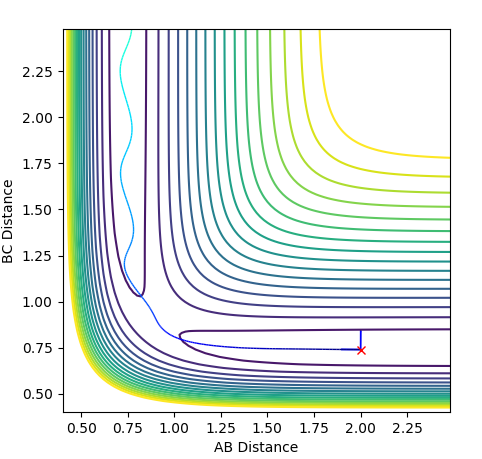
The first plot represents the MEP (minimum energy path) whilst the second plot represents a trajectory calculated using the Dynamics type. For both plots the initial conditions have both momentums set to 0 and the position of r1=rts+0.01 and r2=rts.
In comparison between the two calculations, it can be seen that the MEP plot follows the valley floor. From the plot we can infere that the atoms A-B slowly join together and bond whilst C remains almost stationary with B moving away from it, hence why the two part of the graph have roughly the same gradient.
In the Dynamics trajectory the distance increases dramatically for B-C whilst the distance for A-B oscillates slightly. This occurs from the point where the distances are the same. With this in mind, what happens is that the atoms all start equidistance apart and then atoms A-B join together to form the molecule which has some vibrational energy (hence oscillation)whilst atom C is repelled away (hence dramatic increase in distance).
So the two plots differ in the sense that the MEP plot is trying to minimise energy so only one atom (B) moves. Where as in the Dynamics plot, this isnt the minimum energy pathway, so the gradients are much steeper as energy is no longer a constraint.
Jas213 (talk) 23:44, 13 May 2018 (BST) Good explanation.
Reactive and Unreactive Trajectories
Jas213 (talk) 23:48, 13 May 2018 (BST) Very detailed descriptions of the pathways. How do the different outcomes relate back to the momenta imposed? It would have been good to see not just the total energy, but the distribution of kinetic and potential energy. The last two cases are described correctly, and are so-called examples of recrossing. An overall comment on what you learned from this table would have been expected.
Transition State Theory and Assumptions
The Transition State Theory relies on a few key assumptions: that Transition states are distributed based on the Maxwell-Boltzmann distribution, that Classical mechanics is applied and that systems which overcome the transition state cannot reform the reactants. When comparing these assumptions to the experimental values we saw above we see that the third assumption is not always the case, as shown by trajectories 4 and 5. In each of these cases the reactants overcame the transition state barrier and formed products yet went back on themselves. According to transition state theory, this shouldn't occur. Also, the second assumption isn't always the case as it is possible for electrons to cross barriers via electron tunneling.
Excercise 2: F H H system
Classification of Reactions
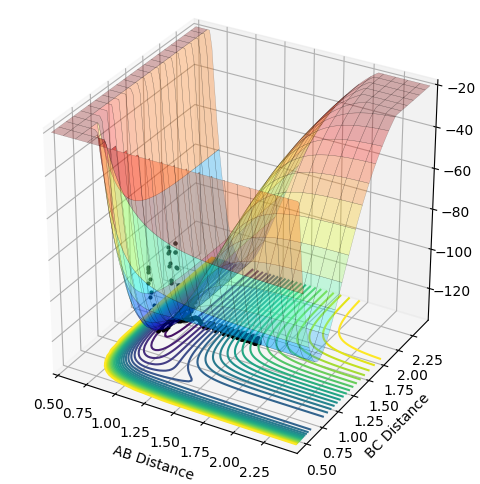
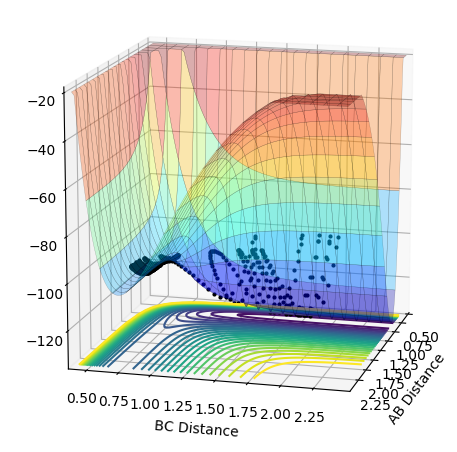
The surface plot function can be used to uncover whether a reaction is endothermic or exothermic based on where the energy levels of the reactants and products are in reference to one another. For the reaction of H2 with F it can be seen that the products are lower in energy than the reactants, giving the reaction the exothermic classification. For the reaction of H with HF it can be seen that the reactants are lower in energy than the products, giving the reaction the endothermic classification. Based on these results, it can be said that the F-H bond is stronger than the H-H bond, due to the large electronegativity difference between H and F, giving the bond more ionic character.
Locating the position of the Transition State
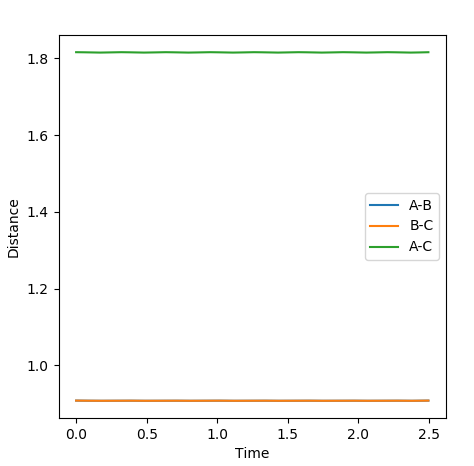
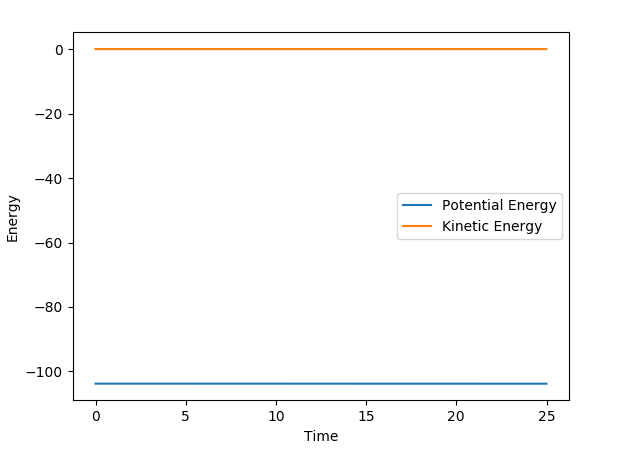
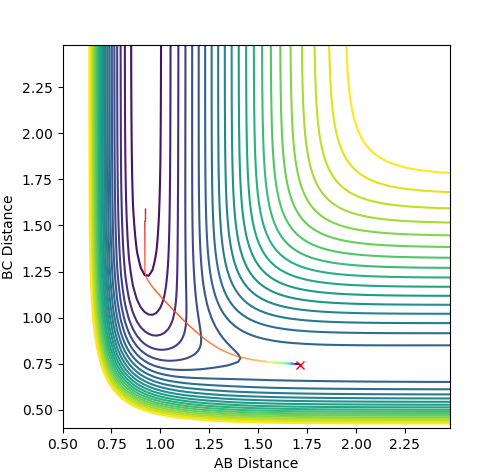
The location of the transition state can be found by finding the location of the saddle point (maximum of the MEP). At this point the first derivative is 0. Finding the location of this point can be achieved by gradually altering the values of r(H-H) and r(H-F) until, through trial and error, you reach a point where the point does not move when there is zero momentum acting upon it. The H-H distance was found to be 0.745 a.u and the H-F distance was found to be 1.812 a.u.
Locating the Activation Energies
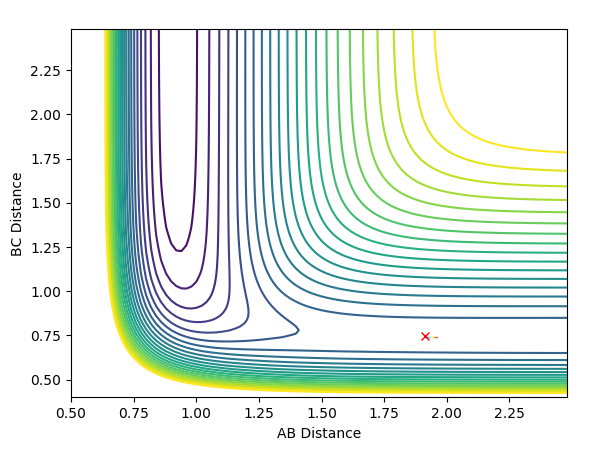
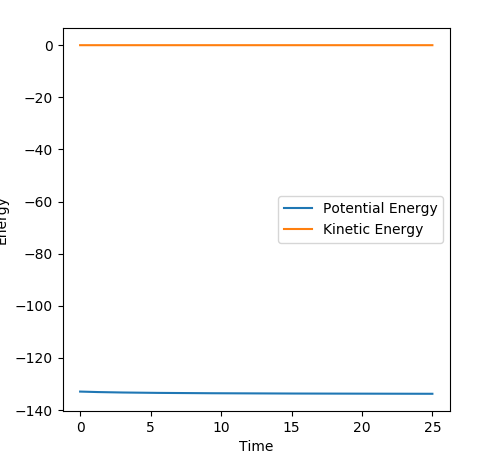
Finding the activation energies of the reactions can be achieved by slightly altering the parameter from those used to find the transition state. This slight alteration causes means the reaction is no longer balanced at the transition state and so falls off in either the direction of the reactants or the products.By changing the r(F-H) value to 1.912 a.u the systems falls into the F + H2 region. By changing the r(F-H) value to 1.712 a.u the system falls into the H + HF region. Using the MEP calculations and not the Dynamics, the activation energy can be shown using an Energy vs Time plot and calculating the difference between the potential energy of the reactants and the transition state. For H2 + F -> H + HF the activation energy was found to be 0.028 kcal/mol (0.117 kJ/mol). For HF + H -> H2 + F the activation energy was found to be 29.157 kcal/mol(121.993 kJ/mol).
Jas213 (talk) 23:55, 13 May 2018 (BST) r is a distance, hence you want Angstroms. Atomic units (a. u.) describe energy.
Reaction Dynamics
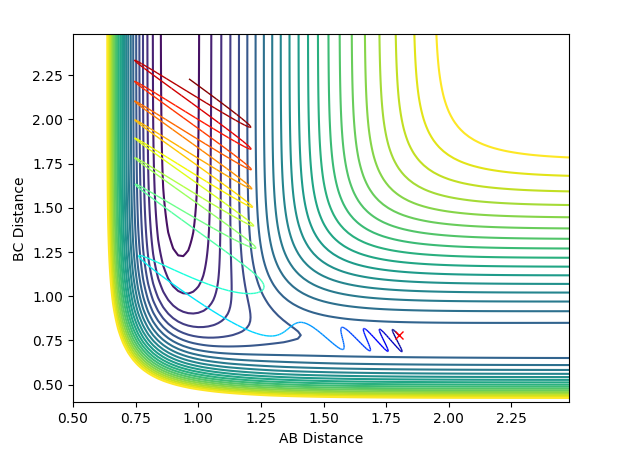
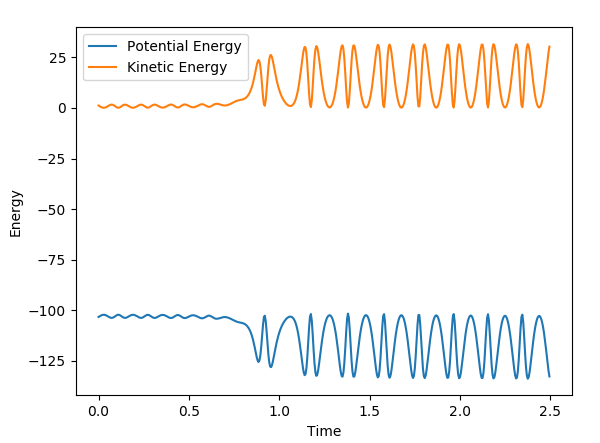
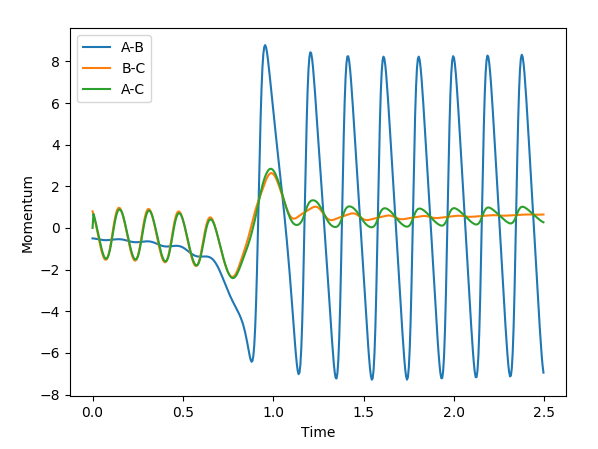
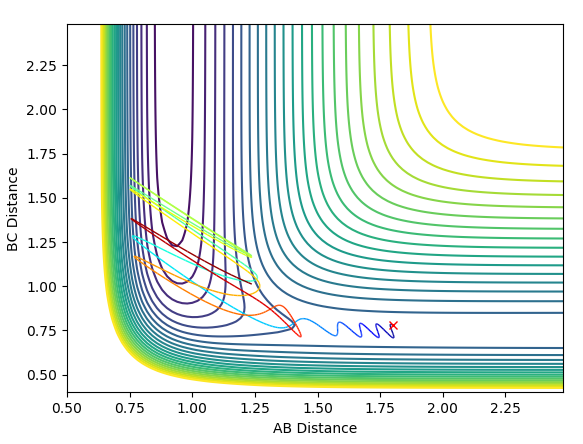
The initial conditions used were r(F-H) = 1.8, r(H-H) = 0.78, F-H Momentum = -0.5 and H-H Momentum = 0.8. From the animation and contour plot generated it can be seen that the H2 molecule and F atom react to produce a high energy H-F molecule and a H atom. The H-F molecule has high energy in terms of its vibrational energy (as seen in the contour and momenta vs time plots). We can see that energy is conserved throughout the reaction using the plot of energy vs time. This plot shows how when the kinetic energy increases, the potential energy decreases (and vice versa) demonstrating the conservation of energy. As this reaction is exothermic (proven earlier), the change in temperature can be measured using a calorimeter and the mechanism of release of the reaction energy can be hence shown to be due to temperature increases through gain in kinetic energy.
Polanyi's Empirical Rules
Whether a transition state is early or late is dependant on where the transition state is in comparison to the reactants and products. If the transition state is more similar in energy to the reactants then it is an early transition state. If the transition state is more similar in energy to the products then it is a late transition state. For an early transition state high vibrational energy in the products is favoured, where as in a late transition state high vibrational energy in the products is disfavoured. As we know that energy is conserved, it can be assumed that for exothermic reaction with an early transition state, vibrational energy increases from reactants to products (ending in high vibrational energy products), meanwhile the translational energy decreases proportionally from reactants to products in order to conserve energy. For an endothermic reaction with a late transition state, the translational energy increases from reactants to products whilst the vibrational energy falls proportionally in order to conserve energy. From this it can be said that translational energy in the reactants affects the efficiency of reactions with an early transition state and that vibrational energy in the reactants affects the efficiency of reactions with a late transition state. [1] This supports Polanyi's Empirical Rules which states that vibrational energy is more efficient at driving a reaction with a late transition state than translational energy. [2]
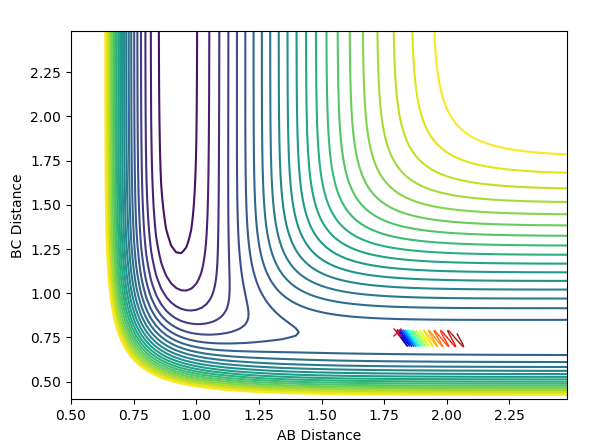
To visualise Polanyi's rule for an exothermic reaction, two initial condition reactions were set up. In both cases r(H-H) = 0.78 and r(F-H) = 1.8, however the momentums were altered. In the first case the momentum of F-H = -0.6 and the momentum of H-H = 0.1. In the second case the momentum of F-H = 0.1 and the momentum of H-H = -0.6. The first trajectory shows a product being produced, whilst the second does not. This reaction has an early transition state and the results show higher efficiency for translation energy transfer for driving the reaction.
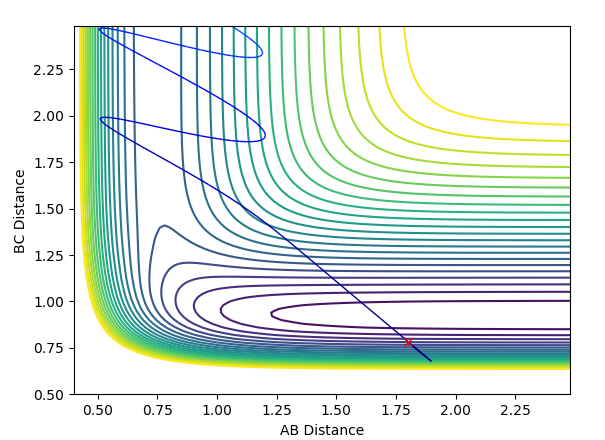
To visualise Polanyi's rule for an endothermic reaction, two initial condition reactions were set up. In both cases r(H-H) = 1.8 and r(F-H) = 0.78, however the momentums were altered. In the first case the momentum of F-H = -10 and the momentum of H-H = 0.1. In the second case the momentum of F-H = 0.1 and the momentum of H-H = -10. The first trajectory shows a product being produced, whilst the second does not. This reaction has a late transition state and the results show higher efficiency for vibrational energy transfer for driving the reaction.
Jas213 (talk) 23:59, 13 May 2018 (BST) Very good that you explained Polanyi's rules and discussed them in your trajectories. Overall very nice report.
References
Template loop detected: Template:Reflist

