MRD:ATSWL4015
Exericse 1: H + H2 System
Triatomic Systems
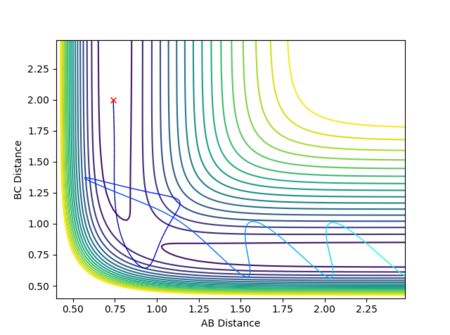
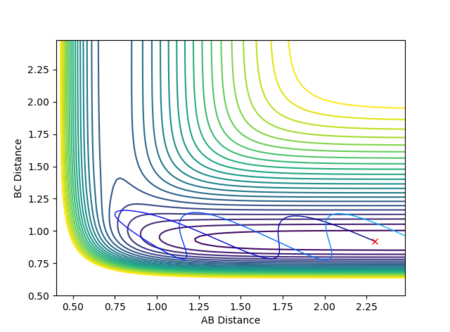
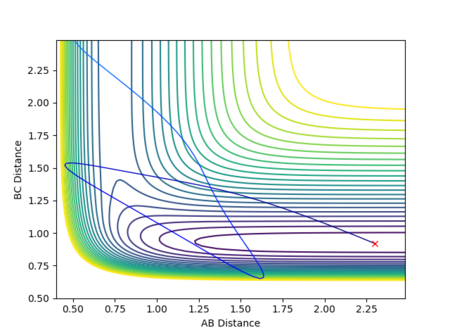
In a triatomic system where an atom, A, reacts with a diatomic molecule, BC, the distance between the atoms A and B, r1, decreases as A approaches BC, with the internuclear distance between B and C, r2, remaining effectively constant, barring vibrational oscillations.[1] Upon a successful collision, r1 will be constant due to bond A-B being formed, and r2 will increase as bond B-C is broken and C moves away, as shown in Figure 1.[1] The system is collinear, with the bond angle between the two bonds A-B and B-C being fixed at 180°.[2] The reactant and product molecules are at potential energy minima, with potential energy therefore being dependent on the interatomic distances between A and B, and, B and C.

Potential Energy Surfaces
A potential energy surface is a visual representation of the relationship between the relative positions of the reactants and products and the potential energy of the system.[1] The reaction path, or trajectory, represents the potential energy and internuclear distances as a function of the reaction coordinate and so depicts the changes in these quantities as the reaction proceeds.
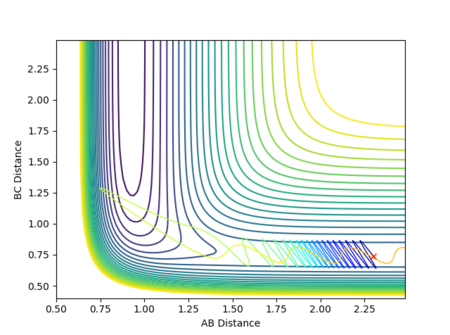
The potential energy surface in Figure 1 was calculated for the reaction system H + H2 using the following parameters:
| Calculation Type | Steps | r1 / Å | r2 / Å | p1 | p2 |
|---|---|---|---|---|---|
| Dynamics | 500 | 2.30 | 0.74 | -2.7 | 0.0 |
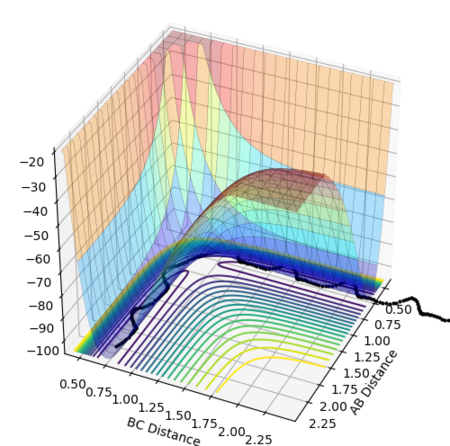
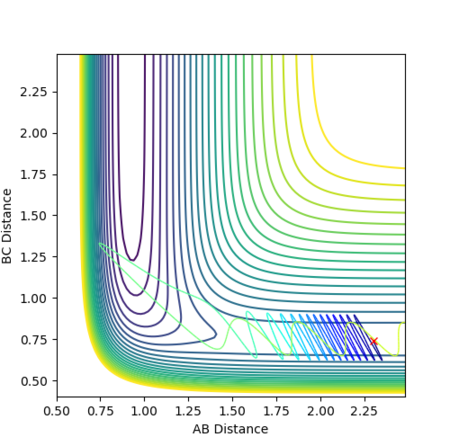
The reaction path passes through each potential energy minimum, including the transition state, the saddle point at which the potential energy is at its maximum (i.e. the highest energy minimum), as shown in Figure 2, and contains components of both internuclear distances.[1][2]
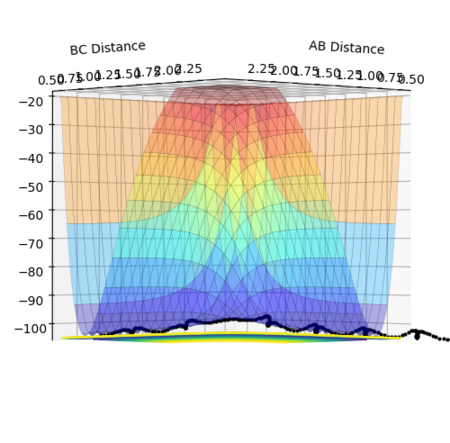
At each local minimum for the reactant or product, the first derivative with respect to the appropriate axis, ∂V(r1)/∂r1, for the products or ∂V(r2)/∂r2, for the reactants will equal 0 and its second derivative ∂V2(r1)/∂2r1 or ∂V2(r2)/∂2r2 will be negative.[1] However, at the saddle point representing the transition state, there is a maximum point along the direction of the reaction path (at a 45° angle to the axes), but a minimum point in the orthogonal axis, hence the second derivative for the maximum will be negative.[1]
Ng611 (talk) 15:23, 1 June 2018 (BST) Excellent definition of a TS. A diagram would make this definition even clearer!
It should also be noted that the reaction pathway is straightest in the region centered around the transition state as this is the point at which bonds are in the process of being broken and formed, hence a lesser degree of association and therefore minimal vibrational oscillations.
Ng611 (talk) 15:23, 1 June 2018 (BST) Interesting observation, as this is a key assumption of TS theory (that motion within the TS can be treated as purely translational).
Locating the Transition State
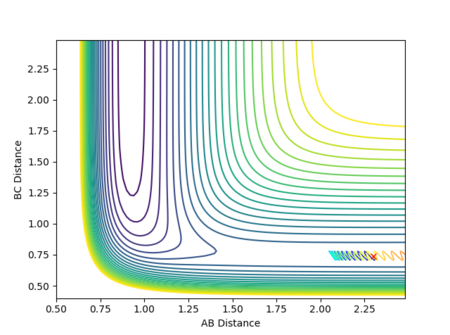
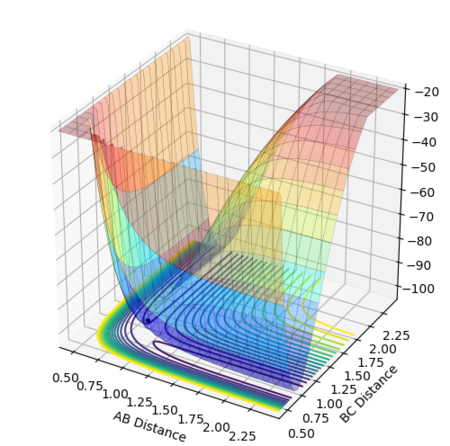
The best estimate for of the transition state position is rts = 0.9077 Å. The transition state is symmetric, reflecting the symmetrical potential energy surface, and so the two internuclear distances, r1 and r2, must be equal to achieve the transitions state.[1] When each species is given a momentum of 0, the potential energy and the internuclear distances are all fixed, as indicated by straight horizontal lines across time in Figure 3, with no vibrational oscillations and fluctuations in potential energy observed.

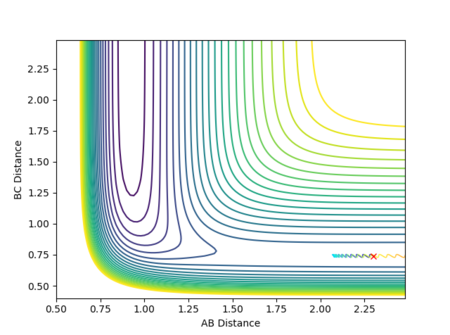
The reaction path is therefore a single point on the potential energy surface which sits on the saddle point at the transition state, with no movement towards reactants or products shown in Figure 4.
Calculating the Reaction Path
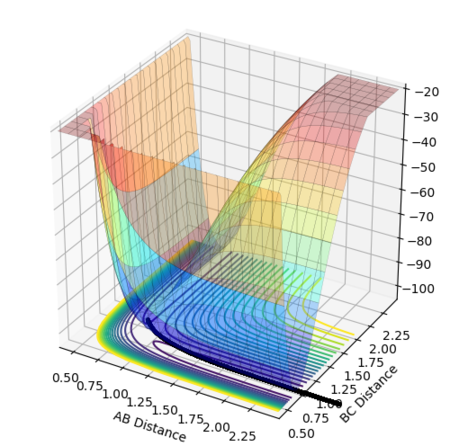
Determination of the transition state allows the minimum energy path, or MEP, to be determined.[1]
The reaction path starting from a slight displacement from the transition state (r1 = rts + 0.01 and r2 = rts) was calculated using the following parameters:
| Calculation Type | Steps | r1 / Å | r2 / Å | p1 | p2 |
|---|---|---|---|---|---|
| MEP | 50 000 | 0.9087 | 0.9077 | 0 | 0 |
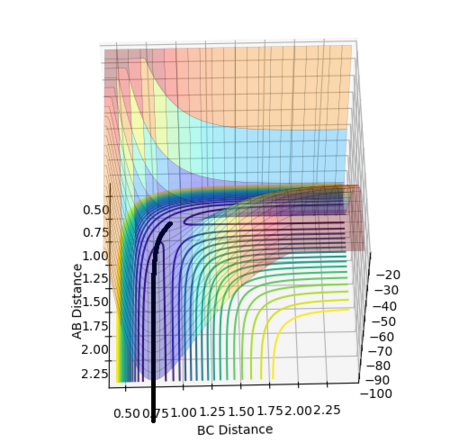
The potential surface plot, with the MEP, is shown in Figures 6 and 7:
The calculation type was changed to dynamics and the same initial conditions applied to include changes in momentum and fluctuations in energy and obtain a more realistic model of the behaviour of the species during the reaction.[1]
| Calculation Type | Steps | r1 / Å | r2 / Å | p1 | p2 |
|---|---|---|---|---|---|
| Dynamics | 500 | 0.9087 | 0.9077 | 0 | 0 |
The resultant potential surface plot is shown in Figures 8 and 9:

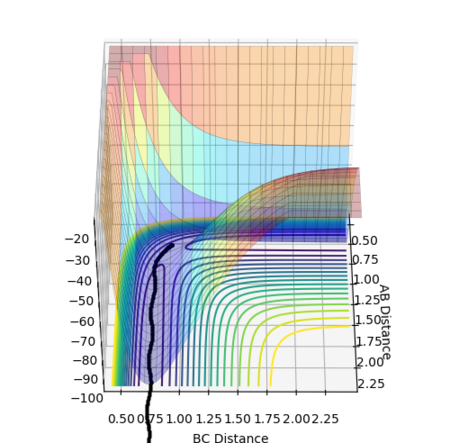
The MEP does not show vibrational oscillations, simply following the bottom of the channel and passing straight through each potential energy minimum with no consideration of how the momentum (namely the velocity) of the species changes during the course of the reaction. The calculated trajectory, however, does take into account momentum changes and oscillates about the minima. Moreover, many more steps (a factor of roughly 100 times more) are required in the MEP calculation for the reaction to go to completion and produce stable products than in the dynamics calculation.
The final values of the positions, r1(t) and r1(t), and the mean momenta after a longer period of time, t, p1(t) and p1(t) are listed below:
| r1(2.46412) / Å | r2(2.46412) / Å | p1(2.46412) | p2(2.46412) |
|---|---|---|---|
| 7.65947 | 0.75424 | 2.48490 | 1.25338 |
The internuclear distances vs time and internuclear momentum vs time graphs from which the positions and momenta were obtained respectively are given in Figure 10 and 11:


These plots also help to describe the reaction, with distance r1 (and A-C) seen to increase as A moves away from BC, after a period of time at which the positions are effectively constant, and B-C decreasing slightly before plateauing, with the presence of oscillations signalling that the bond B-C has formed and vibrations can now occur.
The internuclear distances vs time and internuclear momentum vs time graphs corresponding to the MEP calculation are shown in Figures 12 and 13.
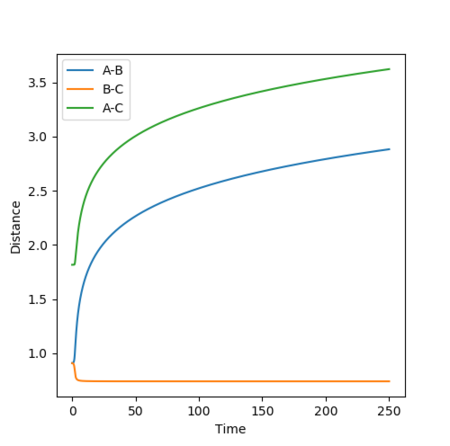
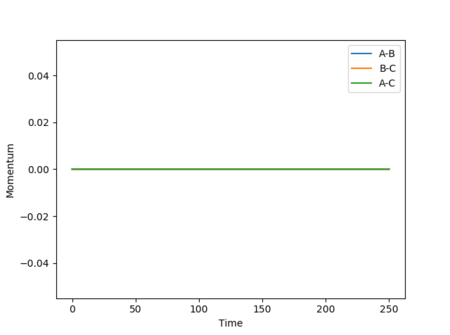
As the MEP moves towards the structure of the reactants, the internuclear distance r1 increases rapidly and r2 decreases rapidly before tending towards a limit and plateauing, while the system also has 0 momentum at all times adue to the velocity being reset to 0 at each step.[1]
If the initial conditions were r1 = rts and r2 = rts + 0.01 instead, the reaction path would move in the opposite direction, exiting via the other channel formed by the potential energy minima where distance AB is constant and distance BC increases, as shown in Figure 14. In other words, while in the first case the transition state moves towards the reactants A + BC, the opposite would be true if the displacement was instead such that A started off closer to B than C was to B, favouring the formation of products AB + C. (Note that in this section, the terms 'reactants' and 'products' have been used with respect to the forward reaction as described by Figure 1.)

As the involved atoms are identical, in the case of the inversely distorted transition state, r1 = rts and r2 = rts + 0.01, r1(t) would take the exact value of r2(t) in the previous calculation and vice versa, with the graph for A-B appearing as the original B-C and B-C appearing as A-B. The same effect would also be observed in the momenta plots, as shown in Figures 15 and 16:

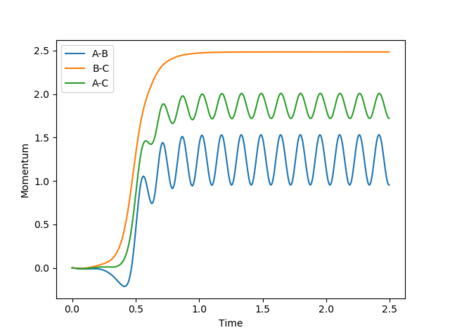
A calculation was carried out where the initial positions were set to the final positions determined above and the same final momenta with reversed signs were given to the species as follows:
| Calculation Type | Steps | r1 / Å | r2 / Å | p1 | p2 |
|---|---|---|---|---|---|
| Dynamics | 500 | 7.65947 | 0.75424 | -2.48490 | -1.25338 |
The potential energy surface, internuclear distances vs time and internuclear momentum vs time plots produced are shown in Figures 17-19.

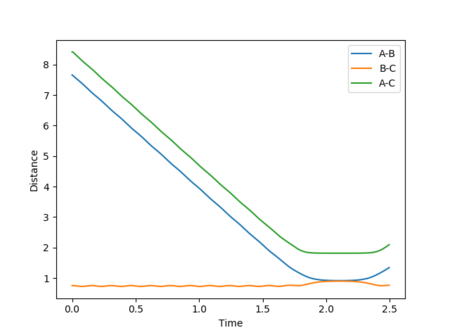
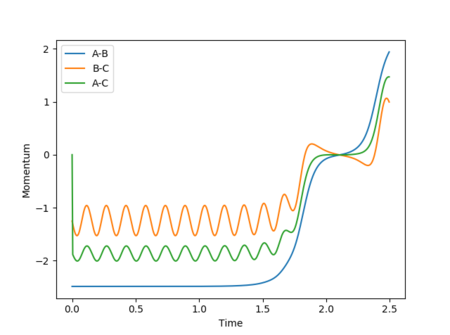
In this scenario, the species start off as reactants and have just the right starting positions and momenta to reach the slightly displaced transition state. This process is the reverse of the original situation in which the slightly displaced transition state formed the reactants. However, a perfect symmetrical relationship between the cases is not actually observed, with the reaction path reaching the transition states but still having enough energy for further interactions to occur, resulting in a slight turn back towards the reactants. This can be attributed to errors in determining the final positions and mean momenta from the internuclear distances vs time and internuclear momenta vs time graphs repectively, as well as rounding.
Reactive and Unreactive Trajectories
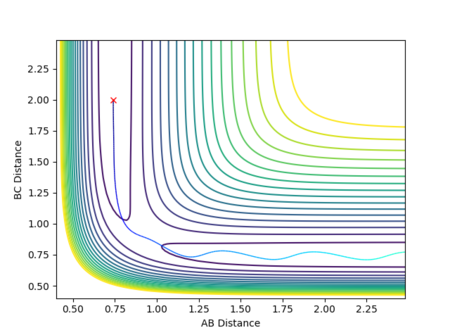
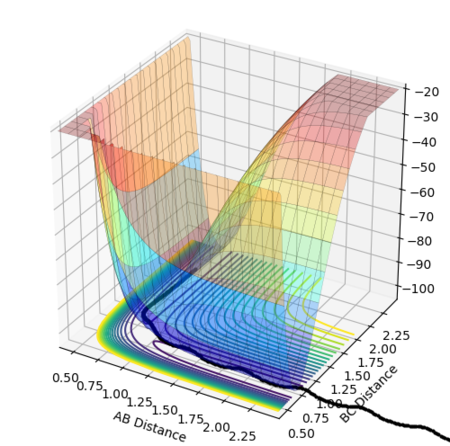
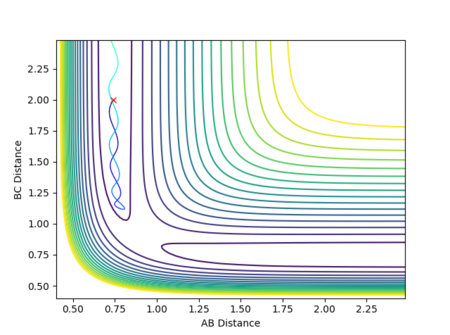
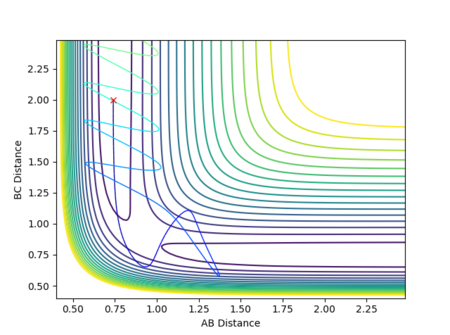
Calculations where r1 = 0.74 and r2 = 2.0 with various combination of momenta as shown below were run to determine the conditions, namely range of momenta, required for a successful reactive trajectory.
Transition State Theory
Transition state theory assumes that only the reactants, states of the system on one side of the activation barrier, are kept at equilibrium with the configuration at the transition state.[3] Once the transition state is attained, the reaction path will proceed to form stable products irreversibly and with certainty, with only a single crossing of the activation energy barrier in the forward direction possible.[3] The rate of the reaction, or the rate constant, is therefore directly proportional to the rate at which colliding molecules reach and pass through the transition state.[3] As shown above, this is only an approximation since the barrier can be recrossed if the particles have sufficiently large momenta and thus kinetic energy and only when the reaction path is well past the transition state and the product species are well separated from each other can the reaction be deemed to have been successful.[3]
Transition state theory is also does not take into account observed quantum effects such as tunneling through the activation energy barrier, which avoids having to travel through the saddle point.[4]
Exercise 2: F-H-H System
PES Inspection
The energetics of the reactions F + H2 and the reverse H + HF were investigated, with the following properties observed:
| Reaction | Transition State Energy / kcal mol-1 | Reactants Energy / kcal mol-1 | Activation Energy / kcal mol-1 | Classification |
|---|---|---|---|---|
| F + H2 | - 103.753 | - 133.945 | + 30.192 | Exothermic |
| H + HF | - 103.744 | - 103.987 | + 0.243 | Endothermic |
F + H2 is exothermic as the H-F bond is stronger than the H-H bond by virtue of the higher electronegativity of fluorine relative to hydrogen (Pauling Electronegativities of: F = 3.98 and H = 2.20).[5] The fluorine atom in H-F pulls electrons closer to itself, leading to a highly polarised H-F bond and a strong ionic contribution to the bonding strength as well as increased orbital overlap. The H-F bond is therefore stronger than the purely covalent H-H bond, (bond dissociation energies of: H-F = + 567 kJ mol1 and H-H = + 436 kJ mol1.[6] The formation of the H-F bond in the forward reaction F + H2 is therefore energetically favourable and overcompensates for the loss of the H-H bond, with an exothermic release of energy.[5] The reverse reaction, H + HF, is endothermic and so requires the input of energy as the energy released by the formation of the H-H bond does not outweigh the energy used to break the H-F bond.[5]
According to Hammond's postulate, the transition state between two interconverting structures will most closely resemble the structure it is closer in energy to.[7] For an exothermic reaction, the transition state would be early and closely resemble the reactants, therefore having only a marginally higher energy than the reactants, i.e. a small activation energy.[7]
| Calculation Type | Steps | rH-F / Å | rH-H / Å | pHF | pHH |
|---|---|---|---|---|---|
| Dynamics | 500 | 1.811 | 0.745 | 0 | 0 |
The approximate position of the transition state for both F + H2 and H + HF, was found to be rH-F = 1.811 Å and rH-H = 0.745 Å.
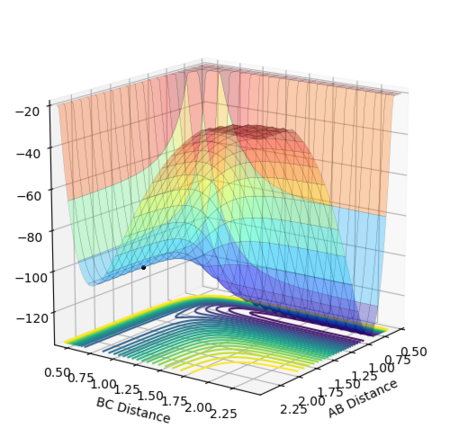
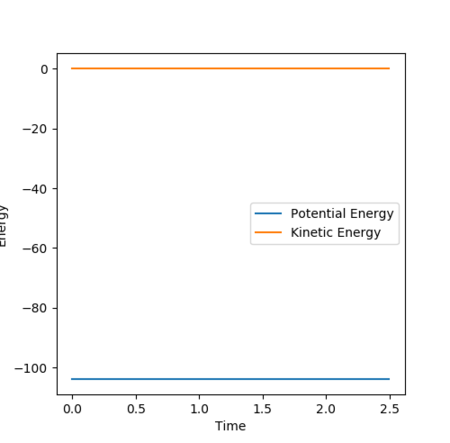
The potential surface plot in Figure 20 and energy vs time plot in Figure 21 shows that the transition state has been attained, with no change in potential energy as expected at the saddle point and no movement towards either products or reactants. The potential surface plot also shows the minima in the reactants channel to be higher in energy than the products channel, indicating an exothermic reaction in the event of a reactive trajectory.
The position of the transition state approaching from the reverse reaction H + HF is shown in Figure 22. The relative distances between the atoms at the transition state are the same, but in this direction, the transition state closely resembles the products, which are now higher in energy than the reactants, hence an endothermic reaction.

The following MEP calculations were set up and run from a structure neighbouring the transition state to determine the activation energy of both reactions:
| Calculation Type | Steps | rH-F / Å | rH-H / Å | pHF | pHH |
|---|---|---|---|---|---|
| MEP | 200 000 | 1.801 | 0.745 | 0 | 0 |
| Calculation Type | Steps | rH-F / Å | rH-H / Å | pHF | pHH |
|---|---|---|---|---|---|
| MEP | 200 000 | 1.821 | 0.745 | 0 | 0 |
Figure 23 shows the MEP from the distorted transition state favouring the products, while Figure 24 shows the change in potential energy against time from near the transition state to the products.

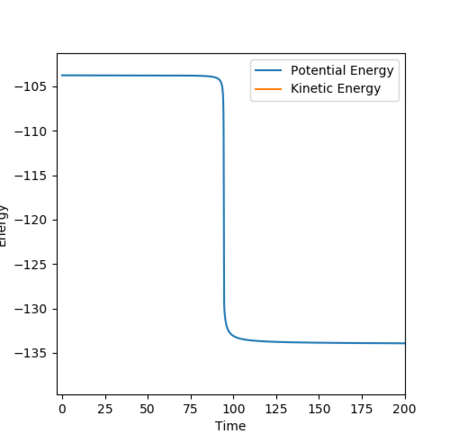
As the transition state is much closer to the reactants, the decrease in energy is very large and occurs very quickly.
Figures 25 and 26 show the MEP from the transition state favouring the reactants and the change in potential energy against time from the transition state to the reactants.
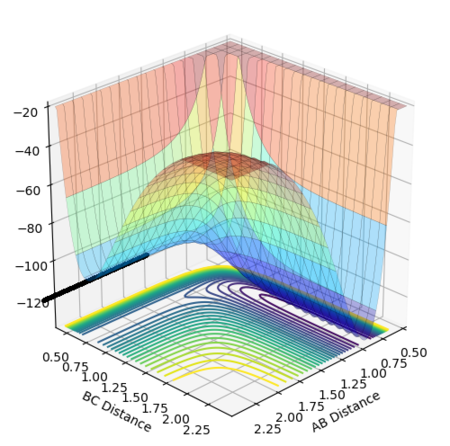
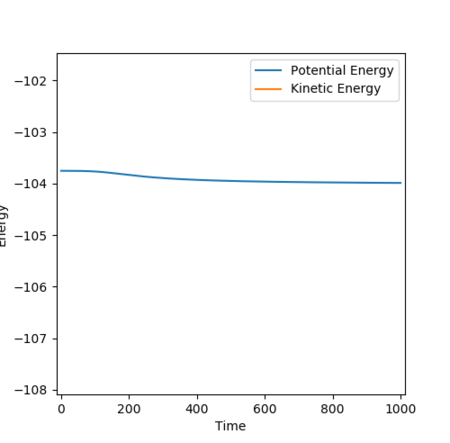
There is much less of a potential energy gradient to a stable configuration this time, hence a smaller decrease in energy over a longer period of time.
Reaction Dynamics
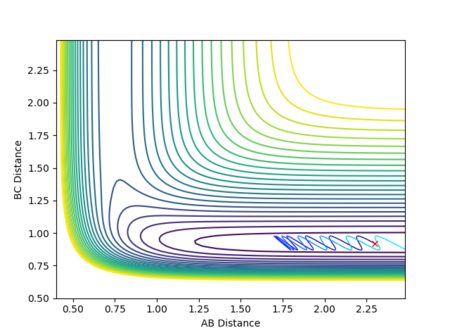
A calculation with the following conditions resulted in a reactive trajectory for the F + H2 reaction, as shown by Figure 27:
| Calculation Type | Steps | rH-F / Å | rH-H / Å | pHF | pHH |
|---|---|---|---|---|---|
| Dynamics | 1400 | 2.39 | 0.74 | -1 | -0.1 |
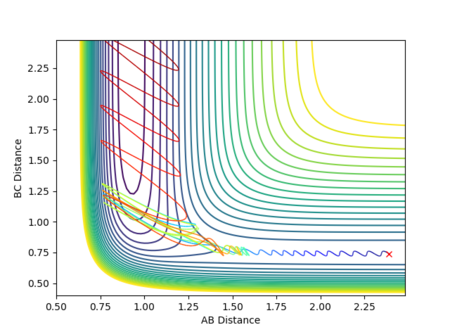
The plot of internuclear momentum vs time in Figure 28 reveals that the H-H bond vibrates until the fluorine atom collides with and transfers its momentum to the H2 molecule. Once past the transition state and stable products are formed, it is the H-F bond that vibrates, but with a larger amplitude of oscillation than H-H. The gradient in internuclear distance against time also increases, hence increased velocity and translational energy. These observations indicate an increase in kinetic energy of the system which, in accordance with the law of conservation energy, must have been converted from potential energy. This is demonstrated by Figure 29, which shows a decrease in potential energy but a gain in kinetic energy of the system from the products to the reactants at the transition state.
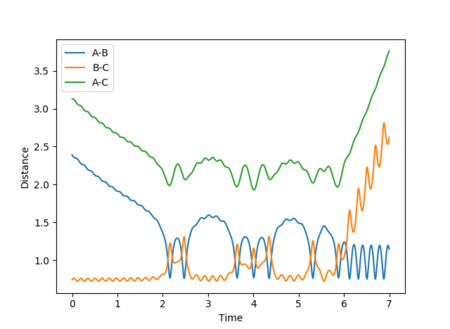
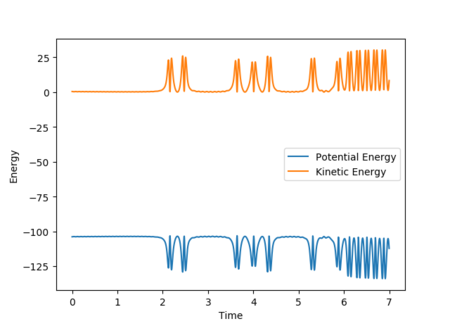
Such energy changes can be observed and quantified by calorimetry as increased average motion of particles equates to an increase in temperature, with the loss of potential energy corresponding to enthalpy loss of the system as expected for an exothermic reaction.[5]
Ng611 (talk) 15:25, 1 June 2018 (BST) True, but would calorimetry distinguish between vibrational KE and translational KE?
The Polanyi Rules
The Polanyi rules state for reactants given momentum along the direction of the reaction path, translational energy, as opposed to vibrational energy, is preferred to overcome the early transition state in an exothemic reaction.[8] The opposite is true for endothermic reaction with late transition states, with sufficient vibrational energy over translational energy resulting in the successful formation of stable products.[8]
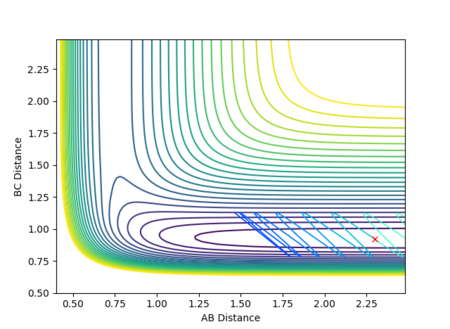
Trajectories were calculated for the exothermic reaction F + H2 using 1000 steps and different values of momentum for HH, with all other conditions fixed such that only the vibrational energy of the H2 molecule was varied.
With the same initial position maintained, the momentum pFH was increased to -0.8 and the momentum pHH reduced to 0.1. The resulting contour plot and reaction path calculated using 2000 steps is shown in Figure 28.
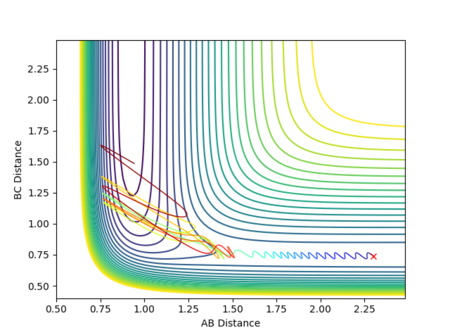
The increased translational energy of the system (and reduced vibrational energy) allows the transition state to be overcome and forms stable products, hence a successful collision and a reactive trajectory.
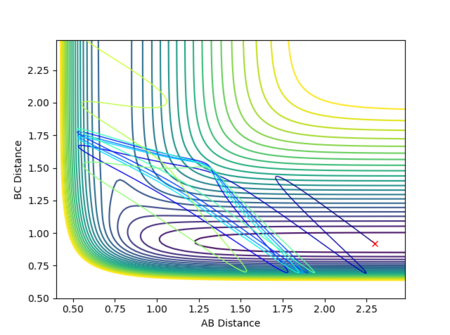
The endothermic reverse reaction H + HF was investigated by running trajectories firstly pHF increased and pHH fixed, and then the other way around. 1000 steps were used for each calculation where possible.
Since the increasing the vibration energy of the H-F bond for this endothermic reaction while keeping the translation energy fixed at a low value tends to result in the formation of stable products, the Polanyi rule has been demonstrated to hold true in this reverse case as well as for the forward exothermic reaction, F+ H2. It should be noted that the Polanyi rule is a guide and may not necessarily apply to all reactions, possibly due to the redistribution of kinetic energy between translational and vibrational forms by molecules. However, the most probable cause for the anomalous trend observed for H + HF is approximations made for simplification in the program used for trajectory calculations.
Ng611 (talk) 15:27, 1 June 2018 (BST) A good overall explanation of Polanyi's rules and good examples given. Well done!
Ng611 (talk) 15:27, 1 June 2018 (BST) Overall a very thorough and well thought out report. Very well done!
References
- ↑ 1.00 1.01 1.02 1.03 1.04 1.05 1.06 1.07 1.08 1.09 1.10 Imperial College London, https://wiki.ch.ic.ac.uk/wiki/index.php?title=CP3MD, (accessed May 2018).
- ↑ 2.0 2.1 J. I. Steinfeld, J. S. Francisco and W. L. Hase, Chemical Kinetics and Dynamics, Prentice Hall, Englewood Cliffs, 1989, pp. 220-221.
- ↑ 3.0 3.1 3.2 3.3 R. D. Levine, Molecular Reaction Dynamics, Cambridge University Press, Cambridge, 2005, pp. 202-203.
- ↑ G. D. Billing and K. V. Mikkelsen, Introduction to Molecular Dynamics and Chemical Kinetics, John Wiley & Sons, New York, 1996, p. 31.
- ↑ 5.0 5.1 5.2 5.3 P. Atkins and J. de Paula, Atkins' Physical Chemistry, Oxford University Press, Oxford, 10th edn., 2014, pp. 65, 71 and 986.
- ↑ D. Shriver et al., Inorganic Chemistry, W. H. Freeman and Company, New York, 6th edn., 2014, pp. 59 and 458.
- ↑ 7.0 7.1 J. Clayden, N. Greeves and S. Warren, Organic Chemistry, Oxford University Press, Oxford, 2nd edn., 2012, pp. 989.
- ↑ 8.0 8.1 C. Daniel et al., J. Phys. Chem., 1993, 97, 12485-12490.

