MRD:APP5718
H+H2 system
The analysis of this reaction will be done using the Born-Oppenheimer approximation and treating the system as classical to be able to approximate trajectories. The system consists of an H2 molecule reacting with a Hydrogen atom to form a new bond. All three Hydrogen atoms will be distinguished by the letters A, B, and C corresponding to H(A)+H(B)-H(C), this is just to distinguish the atoms, the letters have no physical meaning associated. Moreover, R1 will be the distance between atoms B and C and R2 is the distance between A and B. Potential surfaces of this reaction and the Transition states will be studied using transition state theory
It's good that you clearly defined what your abbreviations are here. Fdp18 (talk) 09:20, 24 May 2020 (BST)
The mathematical definition of the transition state corresponds to the point in the potential surface where the partial derivatives of the energy with respect to bond distance R1 and R2 are both equal to zero since it is a maximum point in the surface graph. However, the second-order partial derivatives also need to be calculated to distinguish between minima and maxima. The transition state (TS) is a saddle point so the second-order partial derivatives will each have opposite signs. Defining it through mathematical equations:
The transition state is not a maximum in this case, neither is it a minimum. I recommend you look up what a "stationary point" is, what types of such points exist, and how they can be distinguished. Think back to curve sketching - hint: a "stationary point" is just a "local extremum". Fdp18 (talk) 09:23, 24 May 2020 (BST)
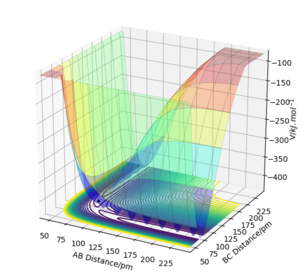
Why is this figure here? Please get in the habit of always referring to all Figures, equations, Tables, etc. in the text. Fdp18 (talk) 09:24, 24 May 2020 (BST)
Locating the position of the Transition state (rts)
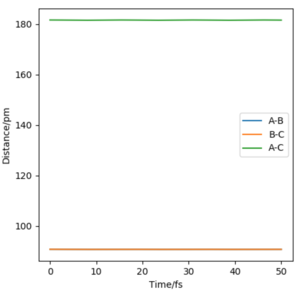
Given that all three atoms are the same, the TS will be located at a point where the distances between the atoms is the same. Therefore, to find rts, the momentum of all particles is set to zero and the values R1 and R2 are changed ( with the condition that R1 = R2) until a plot of Internuclear Distances vs. Time (Fig. 2) shows two horizontal lines indicating that the state is in equilibrium and all three atoms remain in the same position. This value is found to be rts = 90.8 pm
correct + concise. Fdp18 (talk) 09:23, 24 May 2020 (BST)
Calculating the reaction path
The reaction path corresponds to a minimum energy path from reactants to products. The way of determining it closest to reality consists of using the dynamic calculation type, which allows for vibrations to happen in molecules as a result of their momentum, and as a result reaction paths aren't straight lines but actually "wiggle" due to the vibrations which raise its potential energy. However, the minimum energy path (mep) completely removes all vibrations from the reaction by determining the lowest energy path after resetting all the atom's momentum to zero after each step. Therefore, no vibration arises with the mep calculation, which is completely unrealistic in relation to a real-life gaseous reaction. It is still very valuable and interesting to compare both possibilities to get a deeper understanding of the overall reaction by looking at graphs of mep vs dynamic calculations in the case where r1 = rts + 1pm and r2 = r2 and, reversibly, r2= rts+1pm and r1=r1. All calculations were done with a number of steps = 500 and a size (fs) = 0.1
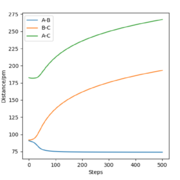
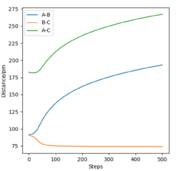
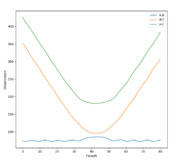
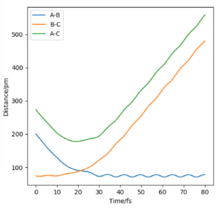
All the relevant graphs with their descriptions are plotted in this section. By comparing Fig. 4 and Fig. 3, by altering R2 and leaving R1 unchanged, the A-B and B-C curves interchange "places" on the graph which indicates the fact that the bond would be forming between hydrogens B and C while breaking the bond A and B which is the opposite of our initial system.
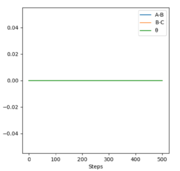
The final values of the positions R1(t) and R2(t) are equal to 193 pm and 74 pm, as extracted from Fig. 3. This is consistent with the physical intuition of the reaction since the bond between Hydrogens B and C, corresponding to the length R1 is broken and increases while the distance between A and B decreases as hydrogen A approaches hydrogen B to form the bond. The momenta, shown in Fig. 5, remains constant and equal to 0 g.pm/mol.fs, also in complete agreement with mep theory which resets the momentum value to zero after each step to avoid the vibration of the molecule.
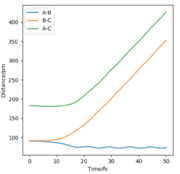
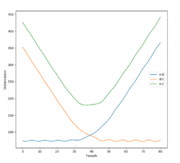
The final values of positions for the dynamics calculation (see. Fig. 6) are R1(t) = 352.6 pm and R2(t) = 73.7 pm. Comparing Fig. 3 and Fig. 6, the differences introduced by allowing vibrations are visible, the increase of BC distance is much steeper and the final distance R1 is larger in dynamics than mep calculation. Moreover, the distance curves in Fig. 3 are smooth while they adopt a more sinusoidal shape in Fig. 6, the result of the vibrations.
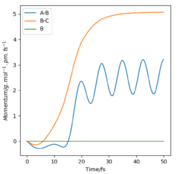
The momenta graph is completely different (Fig. 7) as the momentum associated with A-B oscillates after 20 fs around a value of 2.5 g.pm/mol.fs (final value p2(t)=3.2 g.pm/mol.fs) while BC stabilises at p1(t) = 5 g.pm/mol.fs. The vibration has been "transmitted" from the molecule formed by hydrogens B and C to the new formed molecule with atoms A and B whose momentum oscillates.
If a calculation is set up where the initial positions correspond to the final positions found above, as well as the final momenta but with the signs reversed, a very interesting graph of internuclear distances vs. time in the dynamic calculation is plotted (see Fig. 8). The idea of inversing final and initial positions as well as reversing momenta has the objective to study the reversibility of the system, how would it evolve if you gave the final products the momentum "back" to form the products again. After approximately 45 fs, the BC and AB positions get closer to the TS position of rts = 90.8 pm but never reach it and go back to the same positions the products had. This means the formation of the reactants by reverse reaction did not happen, as the momentum is not enough to go over the TS. If the reverse reaction were to be successful, a graph with the same shape as Fig. 9 would be observed.
This section was well written and understandable and Figures are referenced in the text.Fdp18 (talk) 09:34, 24 May 2020 (BST)
Reactive and Unreactive trajectories
Here are a few reaction examples with different momenta and with the same initial positions: R1 = 74 pm / R2 = 200 pm. The dynamics calculation type is employed with a numbe of steps equal to 800 and size (fs) = 0.1
| p1/g.mol-1.pm.fs-1 | p2/g.mol-1.pm.fs-1 | Etot | Reactive? | Description of the dynamics | Illustration of the trajectory |
| -2.56 | -5.1 | -414.280 | Yes | The reaction is succesfull as A approches the Hydrogen molecule with a high enough energy and forms a new hydrogen molecule with atoms A and B. The new molecule has some vibrational energy as indicated by the small oscillations | 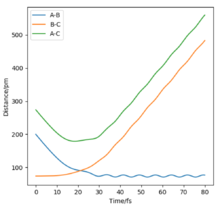
|
| -3.1 | -4.1 | -420.077 | No | The reaction is unsuccesfull as the initial energy is not sufficient for the collision to form the product, they collide and separate back | 
|
| -3.1 | -5.1 | -413.977 | Yes | These initial conditions are similar to the first example only that the Hydrogen molecule has a higher momentum. Keep in mind that the reader needs to be able to understand everything from your description. "Hydrogen molecule" is ok here, since there is only one. But what is the direction of the momentum? That makes a big difference and applied to the other entries in this table as well. Fdp18 (talk) 09:38, 24 May 2020 (BST)
The collision still results in a reaction forming the Hydrogen molecule between atoms A and B with vibrational energy ||
| |
| -5.1 | -10.1 | -357.277 | No | This reaction is quite different from the previous. Both momenta are relatively high. Consequently, the energy barrier is crossed once but the vibrational energy (represented by the oscillations) is so high that the barrier is crossed again, reverting back to the initial conditions and reagents. The reaction does not occur despite high momenta. | 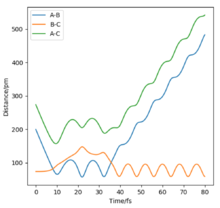
|
| -5.1 | -10.6 | -349.477 | Yes | Similar to the previous reaction, both momenta are high but p2 is even slightly higher. This results in the crossing of the reaction three times, thus forming the hydrogen molecule between the atoms A and B. The new molecule and the hydrogen atom C separate both with high vibrational energy | 
|
From this table, it can be concluded that having atoms/molecules with a higher momentum does not necessarily imply that the reaction will be "reactive" as the TS can be crossed multiple times due to the high vibrational energy. If, however, the TS is crossed an odd number of times, the reaction will be "reactive" while it will be unreactive if it crossed an even number of times.
Comparison with transition state theory (TST)
Without quoting the exact words used in the assumptions of TST, which can be found in this research paper [1]; the assumptions are as follows:
1. The Transition State is in equilibrium with the reactants and products.
2. The reaction is electronically adiabatic [2], meaning that the Born-Oppenheimer approximation is used for calculations To the best of my knowledge, these two things are not the same. Using the Born-oppenheimer approximation essentially means that electronic degrees of freedom are relaxed fully at every step, i.e. the electrons are "much faster than the nuclei", and "equilibrate instantly". In contrast, "electronically adiabatic" means that the electronic state of the system doesn't change - e.g. it doesn't change multiplicity or even between two distinct singlet states. Fdp18 (talk) 09:44, 24 May 2020 (BST)
3.The reaction path takes the minimal energy approach while going to and crossing through the transition state.
4. Once the TS point is crossed, the reaction takes place (it doesn't consider the possibility of recrossing)
The differences from experimental values of reaction rates and those predicted from TST will very probably differ. One thing that TST does not take into account is the quantum mechanical nature of atoms and molecules. Thus, the quantum tunneling effect is not considered, which is a factor that increases reaction rates in real-life experiments. The most probable difference will come from the fact that TST does not consider the possibility of energy barrier recrossing when the initial momenta are high as stated by assumption 4. If the reaction still occurs after an odd number of crossings, the TST prediction of the reaction rate will be higher than the real-life measurement.
F-H-H system
In this system, the fluorine atom is labeled as A, the hydrogen atom located in the middle as B and the last one at C.
Two different reactions are possible bear in mind that the description of a reaction requires reactants and products. "F + H2" is not a reaction, but "F + H2 --> HF + H" is. It is not likely here, but it could also be that they react to H2F - try to leave as little room for interpretation for the reader as possible. If what you write is unambiguous, then there is less room for misunderstandings. Fdp18 (talk) 09:49, 24 May 2020 (BST)
: F + H2  (reaction 1) or H + HF (reaction 2). Energetically speaking, they are quite different as one reaction is exothermic while the other is endothermic. Without yet looking at the potential energy surfaces (PES), this can be rationalised by looking at the bond strengths of the reagents and products. In the first reaction, the product is HF and the bond broken is between two hydrogen atoms. The H-F bond is strong (586.6 kJ/mol)[3] due to the electronegativity difference between hydrogen and fluorine, the most electronegative atom. This results in the bond having a bigger ionic character, which is correlated with stronger bonds. While this statement is not wrong, also keep in mind its limitations - N2 is a pretty inert molecule, too, and the difference in electronegativity is zero. Fdp18 (talk) 09:51, 24 May 2020 (BST)
ok, "too" is the wrong word here. I wouldn't consider HF inert. Fdp18 (talk) 09:51, 24 May 2020 (BST)
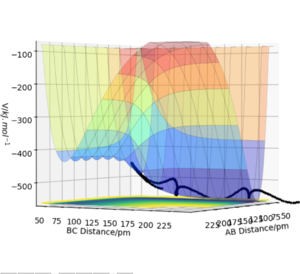
In comparison, the H-H bond(436 kJ/mol)[4] is much weaker and breaking an H-F bond to form the former is not energetically favourable. As a result, reaction 1 is exothermic while reaction 2 is endothermic. These predictions are confirmed by looking at the PES of both reactions:

Position of the transition state
Using the same method employed to find the TS in the previous system wouldn't exactly work since the system isn't symmetric anymore. The way to find the TS position, rts, is to set the distance between the Hydrogen atoms to r(BC) = 74 pm and observe the PES when variating r(AB). What is the rationale behind this approach? Tip: look up Hammond's principle. Fdp18 (talk) 09:53, 24 May 2020 (BST)
Both momenta are set to zero for this operation. The final position of the TS is r(AB) = 181.4 pm and r(BC) = 74 pm as shown by the contour plot and the internuclear distances vs. time graph (see Fig. 12). This TS position is actually the same as the one for reaction 2 since both reactions are the same only reversed.
Activation Energy for both reactions
The activation energy can be found by finding the Energy of the transition state (E ‡), the energy of the reactants and the products: E H-H/EH-F. Depending which reaction you are analysing, one or the other will be the reagent/product. Setting the initial distances to r(AB) = 181.4 pm and r(BC) = 74 pm yields a TS energy of: E ‡ = -433.942 kJ/mol. To find the other two energies, the length of the H-H bond (74pm) is set for r(BC) and the fluorine atom is set so far it doesn't affect the energy of the hydrogen molecule (for instance r(AB)=2000 pm) and the same is done for HF where r(AB) = 91 pm. As a result, E H-H = -435.100 kJ/mol and EH-F = -560.404 kJ/mol. Simply by taking the difference, the activation energy for reaction 2 is Ea = 126.462 kJ/mol. The activation energy for reaction 1 is Ea= 1.158 kJ/mol
The report was really good until here. However, two questions are missing - the one with the release of energy and the distribution of energy. That's really unfortunate - if you did these two questions as good as the rest, that would have been a 4 or 5. Did you forget them or run out of time? Fdp18 (talk) 09:57, 24 May 2020 (BST)
References
- ↑ Wigner, E. Trans. Faraday Soc. 1938, 34, 29.
- ↑ Donald G. Truhlar, Bruce C. Garrett, Stephen J. Klippenstein, J. Phys. Chem. 1996,100,31,12771-12800 https://doi.org/10.1021/jp953748q
- ↑ https://labs.chem.ucsb.edu/zakarian/armen/11---bonddissociationenergy.pdf
- ↑ https://labs.chem.ucsb.edu/zakarian/armen/11---bonddissociationenergy.pdf

