MRD:AM9315 CP3MD
Exercise 1: H + H2
Initial coordinates
| r1 | r2 | p1 | p2 ! |
|---|---|---|---|
| 0.91 | 1.824 | 0.1 | -7.5 |
Initial contour plot
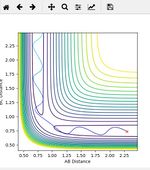
Initial skew plot

Initial surface plot
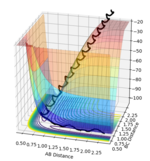
Initial Internuclear Distance vs time plot
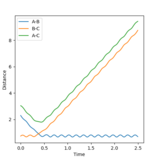
Initial Internuclear Momenta vs Time plot
Initial Energy vs Time Plot
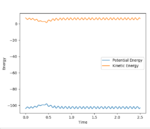
(Is there any point to including these initial condition plots? Fjs113 (talk) 16:30, 28 May 2018 (BST))
Dynamics from the transition state region
What value do the different components of the gradient of the potential energy surface have at a minimum and at a transition structure? Briefly explain how minima and transition structures can be distinguished using the curvature of the potential energy surface.
The value for the gradient at the potential energy surface is 0 both at the minimum and at the transition state as shown by the fact that the minima (see on graph below) is represented by ∂V/∂r1 = 0, and the transition state (see on graph below) is represented by ∂V/∂r2 = 0. However, the transition state can be distinguished from the minima via carrying out a 2nd derivative. A second derivative for minima would show that ∂2V/∂r12 > 0, thus demonstrating that a minima is a minimum energy point. A second derivative for the transition state would show that ∂2V/∂r12 < 0, thus demonstrating that the transition state is a maximum energy point, which would be expected. However, this is dependent on the direction, as the transition state can occassionaly be a minima. So long as the derivative in both directions shows one maxima, then the curve is a transition state.
Trajectories from R1 = R2, locating the transition state
Report your best estimate of the transition state position (rts) and explain your reasoning illustrating it with a “Internuclear Distances vs Time” plot for a relevant trajectory.
rts = 0.905653. This is demonstrated by the 'Internuclear Distance vs Time Plot' shown below where one can observe that the A-B and B-C curves are super imposed with one another, thus the averaging all the distances, and the transition state is the final value one gets.
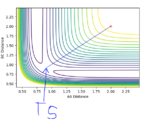

(Unfortunately, this does not show the transition state. At the TS, neither r1 or r2 should be varying, and thus the internuclear distances plot should show straight horizontal lines. Fjs113 (talk) 16:30, 28 May 2018 (BST))
Comment on how the mep and the trajectory you just calculated differ.
The mep calculation depends solely on the trajectory corresponding to infinitely slow motion or in other words, the velocity is always reset to zero. The effect of this can be shown on the MEP contour plot shown below whereby the there are no fluctuations in the reaction pathway as the velocity is always considered to be reset to 0 prior to each step. Contrast this to the the step based dynamics contour plot, and it is clear to see how not resetting the velocity results in fluctuations for each step. What is also interesting note is that MEP requires nearly 32x the number steps that a regular dynamics process would require tor a similar trajectory. The dynamics oscillations are thus shown to be significantly faster. This is because it is only taking into account the vibrational motion in an MEP as compared to the vibrational and translational state motion. (The last sentence is wrong - the MEP does not take vibrational motion into account. Fjs113 (talk) 16:30, 28 May 2018 (BST))

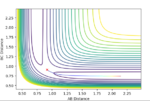
Complete the table by adding a column with the total energy, and another column reporting if the trajectory is reactive or unreactive. For each set of initial conditions, provide a plot of the trajectory and a small description for what happens along the trajectory.
| p1 | p2 | Total energy | R or U ! |
|---|---|---|---|
| -1.25 | -2.5 | -99.018 | R |
| -1.5 | -2.0 | -100.456 | U |
| -1.5 | -2.5 | -98.546 | R |
| -2.5 | -5.0 | -84.390 | U |
| -2.5 | -5.2 | -83.786 | U |
| p1 | p2 | Surface Plots | Detail ! |
|---|---|---|---|
| -1.25 | -2.5 | 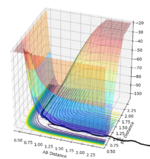 |
Reactive trajectory as the reaction proceeds across the transition state. |
| -1.5 | -2.0 | 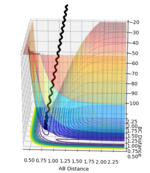 |
Unreactive trajectory as the reaction does not proceed across the transition state |
| -1.5 | -2.5 |  |
Reactive trajectory as the reaction proceeds across the transition state. |
| -2.5 | -5.0 | 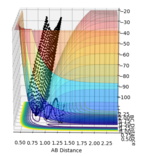 |
Unreactive trajectory as the reaction does not proceed across the transition state |
| -2.5 | -5.2 | 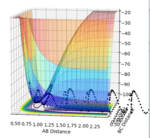 |
Unreactive trajectory as the reaction does not proceed across the transition state (This is reactive! You should have a closer look. Fjs113 (talk) 16:30, 28 May 2018 (BST)) |
(This is too sporadic. You need to not only describe what is happening, but also why. You need to show understanding! Fjs113 (talk) 16:30, 28 May 2018 (BST))
State what are the main assumptions of Transition State Theory. Given the results you have obtained, how will Transition State Theory predictions for reaction rate values compare with experimental values?
Transition state theory states that a hypothetical transition state occurs between reactants and the products. This special type of transition state known as an activated transition state will have a special type of chemical equilibrium with the reactant state known as quasi equilibrium. The species found in the activated transition state is known as the activated complex. There are some basic theory points that one can make with regard to transition state theory:
1) Rates of reaction can be studied by examining activated complexes near the transition state of a potential energy surface.
2)The activated complexes are in a special equilibrium (quasi-equilibrium) with the reactant molecules.
3)The activated complexes can convert into products, and kinetic theory can be used to calculate the rate of this conversion.
When applying transition state theory to all the examples applied above, given that only two of the reaction are reactive trajectories, it is likely that the activated complexes are all in quasi equilibrium with the reactants in at least these two trajectories. This is because Hammonds postulate states that the transition state resembles reactants for exothermic processes and resembles products for endothermic processes. Thus, it is unlikely that the unreactive trajectories be exothermic more likely that they are endothermic thus the transition states cannot be in quasi equilibrium with the reactants.
(In this exercise, we are looking at an isolated triatomic system, not a statistical ensemble, so considering equilibria makes less sense in this case! One assumption of TST is that once the trajectory crosses the transition state, the reaction has been successful. However, as you can see in examples 4&5, this is not always the case. This effect is sometimes called barrier recrossing. Furthermore, you have not given any references. Did you come up with these facts entirely by yourself?? Fjs113 (talk) 16:30, 28 May 2018 (BST))
Exercise 2: H-F-F system
Classify the F + H2 and H + HF reactions according to their energetics (endothermic or exothermic). How does this relate to the bond strength of the chemical species involved? Locate the approximate position of the transition state. Report the activation energy for both reactions.
| Reaction | Exo or Endo | TS position (r1) (r2) | Activation Energy ! |
|---|---|---|---|
| F + H2 | Exothermic | 1.810692, 0.745 | 0.175 |
| H + HF | Endothermic | 1.810692, 0.745 | 30.103 |
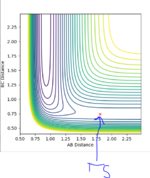
(Where did these values come from?? You just submitted values without showing either working or understanding. Fjs113 (talk) 16:30, 28 May 2018 (BST))
Initial conditions for reactive trajectory HH + F =
| rFH | rHH | pFH | pHH ! |
|---|---|---|---|
| 1.824 | 0.745 | -2.5 | 0 |
(Again, how did you arrive at these values? Fjs113 (talk) 16:30, 28 May 2018 (BST))
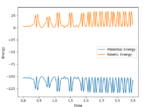
In light of the fact that energy is conserved, discuss the mechanism of release of the reaction energy. How could this be confirmed experimentally?
As the F and H2 molecules approach one another, there is an initial increase in kinetic energy as there is no potential energy barrier. As they collide dead center, the initial kinetic energy of both F and H2 is converted into potential energy as shown by the sudden spike in the potential energy as shown on the energy vs time graph.1 This is followed by a transition state between time 0.5 and 1.0, followed by continual vibrations as a result of the the HF bond vibrating thus influencing the potential curves. This can be confirmed by the Internuclear Momenta vs Time AB curve as the momentum is initially flat as the bond has not formed. The momenta drops initially as the direction is reversed and then increases significantly as the F and H2 molecules continue to colide. The momentum once again drops during the transition state before fluctuating indicating clear molecular vibration thus the formation of the HF molecule. Contrasts this to the BC curve where the momentum fluctuates throughout the transition state but after time 1.4, it proceeds to level out indicating that the energy that was released to produce the now fluctuating HF bond was used to break the HH bond thus the energy was conserved.
(This is just a bunch of observations without any explanation. You haven't shown that you understood as to why any of these phenomena occur. Neither have you answered the question of how to confirm this experimentally. Fjs113 (talk) 16:30, 28 May 2018 (BST))

Setup a calculation starting on the side of the reactants of F + H2, at the bottom of the well rHH = 0.74, with a momentum pFH = -0.5, and explore several values of pHH in the range -3 to 3 (explore values also close to these limits). What do you observe?
The internuclear momenta vs time graph below demonstrates that when the HH momenta is close to -3, the HH momenta initially fluctuates in a symmetric manner and then proceeds into a transition state whereby the fluctuations of the HH momenta decreases whilst the HF bond increases indicating the potential formation of a HF bond. After the transition state, HF fluctuations increase whereas the HH momenta eventually becomes constant thus indicating that the HF molecule forms. Thus, it can be concluded that when the HH momenta is close to -3 there is more than enough energy to overcome the transition state and form the relevant product.
A completely different observation is made for the internuclear vs time graph with a HH momenta close to 3, with there being an exceptionally small transition state is even smaller, indicating that there is not enough energy in the system, thus the reaction does not proceed to form a HF molecule.
However, in comparison, when the HH momenta equals 0, there is clearly enough enough energy for the reaction to form a HF molecule as demonstrated by the continual fluctuating HF momenta line following the transition state between periods.
The limit for momenta which seems to result in a continual transiotn state is when the HH momenta is equal to 0.48874 as shown in the graph below.
(There are no figures here to support your observations. Also, there is no such thing as a continual transition state - it is always one single point on the potential energy sufarce. Fjs113 (talk) 16:30, 28 May 2018 (BST))
For the same initial position, increase slightly the momentum pFH = -0.8, and considerably reduce the overall energy of the system by reducing the momentum pHH = 0.1. What do you observe now?
The molecule follows a similar fluctuation to what is shown for when pFH = -3 and pHH = 0, whereby there is a small transition state caused by the collision of the HH and F particles but there is not enough energy to overcome the transition state thus the HH continues to fluctuate whereas the HF becomes a constant momenta.
(Figure! Fjs113 (talk) 16:30, 28 May 2018 (BST))
Discuss how the distribution of energy between different modes (translation and vibration) affect the efficiency of the reaction, and how this is influenced by the position of the transition state.
Initial conditions for reactive trajectory HF + H =
| rFH | rHH | pFH | pHH ! |
|---|---|---|---|
| 0.91 | 1.824 | 0.1 | -7.5 |
The Polanyi Rules state that the vibrational energy used for a reaction is more efficient translational energy in promoting a late barrier/endothermic reaction i.e. where the transition state more closely resembles the products whereas the reverse is true for an earlier barrier/exothermic reaction i.e. where the transition state more closely resembles the reactants. This rule can be compared to our reaction because on the one hand, HH + F is exothermic and the reverse is endothermic. When viewing the exothermic process, it s clear to see that the forward reaction clearly depends more on translational energy than vibrational energy as whilst it is vibrationally active in that it crosses many vibrational energy barriers, it still appears to be mostly translational energy focused as it follows the reaction path one would expect to generate the HF molecule.
(How exactly can this be seen for the skew plot? Fjs113 (talk) 16:30, 28 May 2018 (BST))

However, when viewing a contour plot for the reverse reaction, the reaction path seems to match the reaction path for the reverse reaction in that whilst it is vibrationally efficient, it is more efficient in a translational sense in that it follows the translational path. This actually disagrees with Polanyis rules. A potential reason could be down to the energies. The total energy for the reverse reaction was still found to be -76.008 kcal/mol (How did you arrive at this value?? Fjs113 (talk) 16:30, 28 May 2018 (BST))
which is significantly and theoretically, Polanyis rules hold unless the collisions occur at very low energies thus, this could be a potential reason as to why the revese reaction appears to be more translationally efficient than vibrationally efficient.

