MRD:ALEXGS
EXERCISE 1: H + H2 →H2 +H system
Transition States

It's hard to see anything from most of these 3D plots. Consider choosing a different angle or, even better, a contour plot. Screens are 2D in the end.Fdp18 (talk) 19:28, 11 May 2019 (BST)

A transition state is key to every chemical reaction because it needs to be bypassed to get from reactants to products. This complex has a very short lifetime and although can't be isolated, but needs to be analysed to understand the dynamics of the reaction. It typically resembles both the products and the reactants having partial bond characteristics from each.
If we define the System with 3 hydrogen molecules- A,B and C- then there is two distance variables-RAB and RBC with Hydrogen B in the middle of the three. These 2 variables define the potential energy of the system V and this can be seen in Figure 1, a Potential Energy Surface Plot.
The Transition State on a Potential Energy Surface is defined as the maximum point on the minimum energy path from the reactants to the products, this path can again be seen on the Figure 1 below. To work out the position of this line, you must differentiate the potential energy with respect to both distance variables and any point along this line must satisfy Equation 1 for i= AB,BC:
∂V(ri)/∂ri=0 (1)
Once the points along the line have been found (and plotted), they must be differentiated again to find the transition point. The transition point will be a maximum on the line whereas the reactants will be minimums. This can be found by differentiating again as a maximum will have a second derivative of less than 0 and a minimum will have one of greater than a 0. This mathematical operation can be shown as, with i= AB, BC again:
∂V(ri)/∂ri2 (2)
Wiki really doesn't want my comments. Please take a look in the edit section above equation 1.Fdp18 (talk) 19:42, 11 May 2019 (BST)
There are, again, three possibilities. Actually even more, of which some are redundant due to Schwarz's theorem. How many of these have to be negative or positive for maxima and minima?Fdp18 (talk) 19:42, 11 May 2019 (BST)
Estimating Transition State Position
Because of the characteristics of the transition state discussed earlier, you can use the idea that a trajectory can be started on the transition state position and never fall off the 'top'. The H and H2 reaction surface is symmetric which means that rAB =rBC. Using these facts, the transition states exact position rts can be found by starting various trajectories near to it by changing the rAB and rBC distances until finding one where the contour plot shows the atoms are stationary as at a maximum and an internuclear distance against time plot shows a straight line (constant internuclear distance) which means the rts has been found. In practice, this is done by estimating the rts and zooming into the successive plots until the line is straight- this gave a rts value of 0.908 Angstroms (3 d.p).
Reaction Trajectories

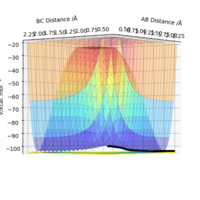
Once the transition state was found, a minimum energy path (mep) can be run. Because at every step of the reaction path the particles' momentum is set back to 0, it runs 'infinitely' slowly. The rAB distance was set to the rts (0.908 Angstroms) and the rBC was set to rts+0.01 (0.918 Angstroms) and both reactants momentum was set to 0. The mep was ran and as seen in Figure 3, the path follows the trajectory from the valley floor of the reactants to the maximum point of the transition state.
This mep was then contrasted with a trajectory ran on the dynamics mode with the same conditions- as shown in Figure 4. Although the two results are relatively similar, they are different because of the mep resetting the particles momentum to 0 after every step. This meant that the dynamic trajectory 'wiggled' a bit due to the vibrational motion with the molecules which is cancelled out in mep. Moreover, the dynamic trajectory doesn't stop at the reactants minimum point because it is not programmed to unlike the mep.
Unreactive or Reactive
To test the idea of whether it was simply the reactants needing over an activation energy or whether this was an oversimplification was testing with various momenta (p1 and p2) reactants at distances rAB =0.74 and rBC =2.0 Angstroms.
| p1 | p2 | Etot/kJmol-1 | Reactive? | Description of the dynamics | Surface Plot of Trajectory |
|---|---|---|---|---|---|
| -1.25 | -2.5 | -99.02 | Yes | Follows reaction path above approximately so relatively normal reaction. A symmetric transition state formed like above before splitting into products with new bond formed between B and C. | 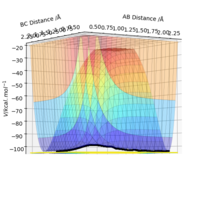
|
| -1.5 | -2.0 | -100.46 | No | Total Momentum, and therefore energy, too low to get over activation barrier. Although reactants 'hit' each other, each up bouncing off and going back to original state. | 
|
| -1.5 | -2.5 | -98.96 | Yes | Similar to first example but bond AB weakens before hitting single hydrogen C, so B easily combines with C for reaction to take place.
It is also similar to the second example... So why does it react?Fdp18 (talk) 19:53, 11 May 2019 (BST) |

|
| -2.5 | -5.0 | -84.9 | No | C and AB have too high momentum, so despite reaction pathway going over transition state, original H2 AB recombines in another collision to go back to reactants. | 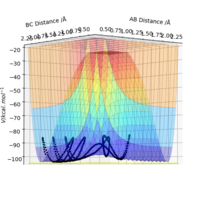
|
| -2.5 | -5.2 | -83.4 | Yes | As in previous example but as double barrier recrossing, the second collision ends in the products being formed overall instead of the reactants. | 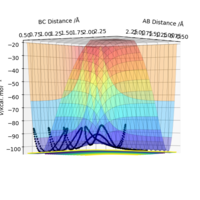
|
The key conclusion from the table is that just having over a determined amount of energy in the system doesn't mean that the reaction will proceed. The total energy values in the second column highlight this (these were calculated from the energy against time plot). The distribution of this energy, in the momentum of the particles, is important because if it is not correct (for example too high so leading to a second collision reforming the reactants) then the reaction may potentially not proceed to the products as desired.
Transition State Theory
Transition State Theory has 3 underlying principle assumptions which govern the chance of a reaction proceeding and they are:[1]
- The reactants in the reaction are in equilibrium with the transition state complex.
- The particles energy distribution follows that of a Boltzmann Distribution.
- When the reactants are in the transition state, they don't collapse back into reactants
Comparing this principles with my results above, you can see that in the 4th test for reactive/unreactive trajectories the momentum can be too high so the reaction doesn't proceed and thus the third assumption is not always true. As a result of this, the reaction rate would be lower than the one predicted by Transition State Theory.
EXERCISE 2: F-H Triatomic systems
Reaction Energetics: Endothermic and Exothermic
Now I will look at the reaction energetics for fluorine and hydrogen triatomic systems, starting with:
H2 + F→ HF + H
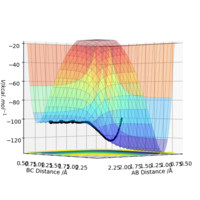
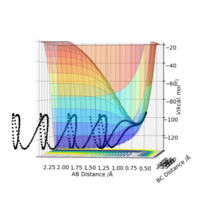
For this reaction the bond length in the H2 was put as 0.74 Angstroms whereas the distance between the F and closest hydrogen was 1.81 Angstroms. By using trial and error, the correct reaction pathway was found which went over the transition state. This pathway can be seen in the form of a Surface Plot in Figure 6 on the right. From this plot, you can clearly see that the products are lower in energy than the reactants as the reaction path goes downwards and therefore the reaction is exothermic with a negative free energy change. This can be understood because the H-F bond is stronger than the H-H bond, 565 kJ/mol compared to 436 kJ/mol for H-H, so the reaction gives energy out because more energy released from bond forming than is for bond breaking.
HF + H → H2 + F
Conversely, this reaction was also studied. This is the reverse of the above reaction so it is endothermic the products are higher in energy than the reactants as said above-less energy released from bond forming than is for bond breaking. Because of its positive free energy change, it will not be a spontaneous reaction and energy will have to put in to make it proceed.
Correct, but you won't get Hydrogen from HF and F just by putting energy in, since - as you correctly stated above - this would be the reverse of the first reaction... Fdp18 (talk) 20:03, 11 May 2019 (BST)
Position of Transition State
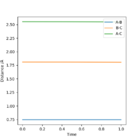
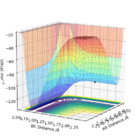
To calculate the position of the transition state for these two reactions, which is the same for both of them because they are the reverse of each other so go through the same reaction pathway, it is a bit different to Exercise 1 because it is not symmetrical like before-rAB (H-H bond length) doesn't equal rBC (F-H bond length). But the principle is the same and you use the idea that a trajectory can be started on the transition state position and never fall off the 'top'. Using these facts, the transition states exact position rts can be found by starting various trajectories near to it by changing the rAB and rBC distances using finding one where the internuclear distance against time plot in Figure 7 to the left which shows a straight line (constant internuclear distance) and where the surface plot (Figure 8 on the right ) shows no movement which means the rts has been found. This is found to be a H-H bond to be approximately 0.745 Angstroms and the H-F bond length as 1.808 Angstroms.
Figure 8 is a good surface plot since one can clearly see everything relevant. Fdp18 (talk) 20:06, 11 May 2019 (BST)
Activation Energies
To calculate the activation energy you need to subtract the energy of the reactants from the energy of the transition state because this is the energy needed to bypass the reaction barrier. The energy of the transition state was found to be -103.75 kJ/mol by putting the above values of the H-H bond as 0.745 Angstroms and the H-F bond length as 1.808 Angstroms into a mep and then looking at the energy against time plot. The energies of the reactants was then calculated by isolate the molecule in each reaction relative to the other reactant so that it wasn't influencing the energy of the molecule. Using this idea, the energy of the H2 + F system was -133.98 kJ/mol and the energy of the HF + H system was -104.00 kJ/mol. Then by subtracting these from the energy of the transition state, you can work out the activation energy for the H2 + F→ HF + H reaction as 30.23 kJ/mol and the activation energy for the HF + H→ H + F reaction as 0.25 kJ/mol.
Reaction Mechanism for Energy Release
As with any chemical reaction, in both of these reactions the overall energy is conserved.
I get your point since you are including the chemical energy in your discussions, though usually one talks about a macroscopical 'change in energy' that happens during a reaction. You can avoid this problem by just adding 'including the chemical energy' in the sentence above. However, of course Energy conservation is one of the most basic laws of physics, at least if you consider matter a state of condensed energy.Fdp18 (talk) 20:16, 11 May 2019 (BST)
So, now I will briefly look at the conservation of energy within this reaction including the mechanism of reaction energy release.
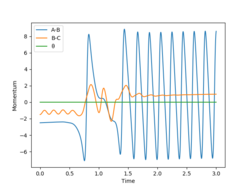
For the H2 + F→ HF + H reaction, Various starting reaction conditions were testing with a H-H bond distance 0.74 Angstroms and the F-H distance of 2.30 Angstroms whilst varying the relative momenta of the H2 and F particles. An example of this can be seen in Figure 9 where the momentum of H-F was -2.5 and the momentum of -1.5. As you can see before reacting there's a higher proportion of translational energy compared to vibrational energy because there's less sharp peaks and after the reaction there's much more of these sharp peaks.
Is it really translational energy that is relevant here?Fdp18 (talk) 20:24, 11 May 2019 (BST)
... and how could this be investigated experimentally?Fdp18 (talk) 20:20, 11 May 2019 (BST)
Energy Distribution between Modes
The reactions studied in Exercises 1&2 above are examples of the applications of Polanyi's Empirical rules and how energy distribution between modes impacts whether or not a reaction will proceed and also the position of the transition state. In these rules, formulated in 1972, Polanyi states that vibrational energy is more efficient for reactions for late transition states whereas translational energy is more efficient for early transition state ones. This means that vibrational energy is more important for endothermic reactions, such as HF + H → H2 + F, where the transition state resembles the product- as stated by Hammond's Postulate. Conversely, translational energy is more important for exothermic reactions, such as H2 + F → HF + H, where the transition state resembles the reactants.[2]
Overall a good report. I couldn't find anything seriously wrong. However, you should work on your figures - some of the plots are virtually indistinguishable or at least very hard to compare. Fdp18 (talk) 20:34, 11 May 2019 (BST)
<references>
- ↑ Steinfeld, Jeffrey I., Francisco, Joseph S, and Hase, William L. Chemical Kinetics and Dynamics. Englewood Cliffs, N.J.: Prentice Hall, 1989.
- ↑ Zhaojun Zhang, Yong Zhou, Dong H. Zhang, Gábor Czakó, and Joel M. Bowman, The Journal of Physical Chemistry Letters 2012 3 (23), 3416-3419, DOI: 10.1021/jz301649w
