MRD:AF2115physcomp
Initial conditions
Initially, a simulated system is described by a linear arrangement of H atoms, two linked to form an H2 molecule, while the third is fired at the molecule to attempt to initiate a reaction. The initial positions and momenta of the atoms are defined by relative values: R1 and R2 are the interatomic distances of atoms A-B and B-C respectively at initiation, and P1 and P2 give the initial momenta of A and C respectively with atom B.

(This is close, but p1 affects both A And B, and p2 affects both B and C. p1 is the momentum that separates A and B, for example Tam10 (talk) 16:21, 22 May 2017 (BST))
It is important to note that atom C is the one initially fired at the diatom comprised of A and B, and this convention is used for the rest of this page. To illustrate the simulation, a trajectory that leads to a successful reaction is displayed, along with the parameters that define it. Also, as the momentum stated for an atom is proportional to the root of the energy of that atom.
| R1 | R2 | P1 | P2 |
|---|---|---|---|
| 0.74 | 2.3 | 0 | -2.7 |
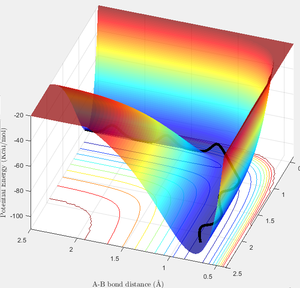
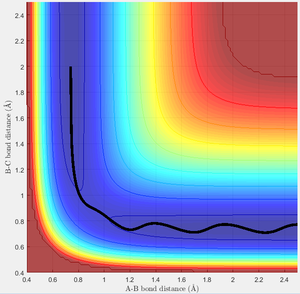
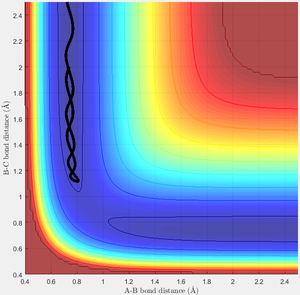
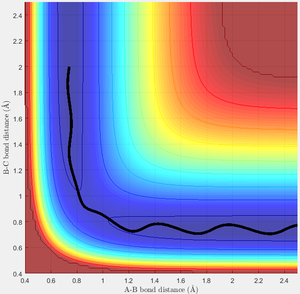
The potential surface in this region contains a valley, which corresponds to the state of the system where two H atoms form a molecule and one is free; a cross-section of the surface taken in the R1 or R2 direction, when R2 or R1 respectively is very high, would appear as the classic Morse potential. It is in this channel that the trajectory of the reaction resides, not having enough energy to escape to the region where both R1 and R2 are high; this being total dissociation. The reaction trajectory is shown in black, starting at the upper left in the first image, with R2 decreasing until the transition state is reached and the products are formed, followed by R1 increasing as the trajectory proceeds down the exit channel. This particular surface is for the special case of a totally symmetric reaction, and so a mirror plane exists in the R1=R2 axis.
Potential surfaces
On any potential surface there are two points where the potential gradient may equal 0: these being maxima and minima of the surface. However, these may be distinguished using the second derivative of the plot, which will be negative for a maximum and positive at a minimum. On a 2D or higher plot, the same theory applies, except partial derivatives must be used for each variable. Again, at maxima and minima, but here the second partial derivatives give more information. At any given point with first derivative = 0, if both partial derivatives are negative, , the potential peaks at this point; if both are positive, the function is a well, but if one of each occurs then this indicates a saddle point, the minimum of one potential function and the maximum of the other. This generalises to higher dimensions, where even more different types of gradientless point become available.
(What about a TS (first order saddle point) on a surface with more than 2 dimensions? Tam10 (talk) 16:21, 22 May 2017 (BST))
The transition state
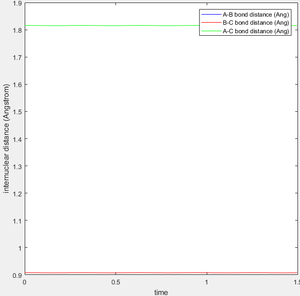
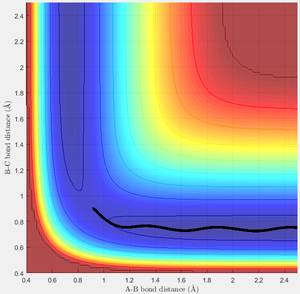
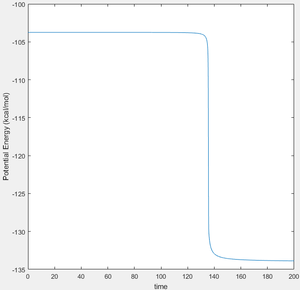
The transition state occurs where the system is in equilibrium; it is an energetic maximum on the minimum energy reaction path, but without external influence there would be no inclination for the system to evolve from this point. For the symmetric system below consisting of three linear H atoms, this of course produces a symmetric transition state, with the H atoms separated by 0.908 Å. This is evidenced by observation of an internuclear distance vs time plot of this scenario, where the internuclear distances are constant and equal, corresponding to a lack of motion. Even a slight alteration of one of the internuclear distance values results in loss of equilibrium. Below, this is illustrated in two ways. Firstly, the MEP (minimum energy pathway) is found. This is a plot of the lowest points all along the potential valley, found by resetting the velocity of the system after every iteration in the calculation. However, this is not physical. In reality, when moving away from the transition state potential energy is transformed into kinetic, but this is not transferred to the released atom with total efficiency, and so the bound atoms start oscillating. It is interesting to note that if the final interatomic distances and momenta are noted after a dynamic calculation initiated from very close to the TS, and these values used to initiate an interaction with the atoms travelling in reverse direction, the system will form a close approximation of the transition state. Unsurprisingly, an exact reverse trajectory is followed.
Testing trajectories
| Test | P1 | P2 | Reaction occurs? |
|---|---|---|---|
| 1 | -1.25 | -2.5 | Yes |
| 2 | -1.5 | -2 | No |
| 3 | -1.5 | -2.5 | Yes |
| 4 | -2.5 | -5 | No |
| 5 | -2.5 | -5.2 | Yes |
Test 1
This is very similar to the original case. The trajectory shows the incoming H smoothly passing through the transition state and forming the products. Interestingly, there is little oscillation in the distance R1 during this time, which is useful for a successful reaction here as it guarantees the reaction trajectory passes very close to the transition state, minimising the energy required to react successfully.
(Looking back at how I defined the momentum at the top, can you think of why these values of p1 and p2 would cause a flat trajectory in the entrance channel? Tam10 (talk) 16:21, 22 May 2017 (BST))
Test 2
In this case, the energy of the incoming H is too low to overcome the transition state energy, so no reaction may occur, and the H rebounds.
Test 3
Here is very similar to the first case, with a little more energy in the H2 molecule. This results in slightly more oscillation in the incoming trajectory, but is not sufficient to prevent a reaction.
Test 4
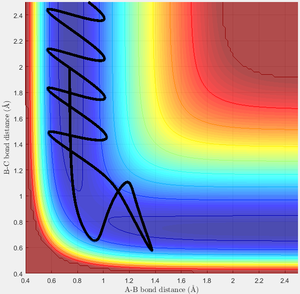
In this case, the transition state is passed, and the products are formed temporarily, but then the process reverts due to an unfavourable arrangement of atoms in the activated complex.
Test 5
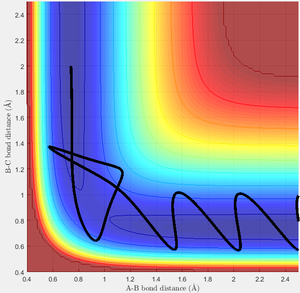
In this scenario, the saddle point is crossed twice. The high energy of the incoming H allows the transition state to be breached and products formed transiently, but then the complex reverts to its reactant form. However, the slightly different interaction with the H2 molecule now allows the original incoming H to successfully react, crossing a second time to form the products. This is an especially interesting as the system does not pass through the transition state found earlier, but due to the very high energy of the incoming H takes up a series of higher energy symmetric states on the transition structure.
Transition state theory assumes:
- The rate of reaction may be understood by considering an "activated complex", a region very close to the transition state, where the reactant and product may either form products or revert to reactants
- Quantum tunneling is disregarded.
- All atoms are large enough to behave classically.
- If the activated complex passes the transition state, then a reaction is certain to occur.
Transition state theory may over or underpredict the true rate for a given reaction, but is most likely to overpredict, due to the high possibility of transition state recrossing in a real reaction. This means that a great number of instances that transition state theory would predict lead to a reaction do not in fact do so. On the other hand, if the barrier to reaction is sufficiently short spatially, and thermal energy is low and insufficient to overcome the activation energy classically then the presence of quantum tunneling may be significant enough that the theory underpredicts the rate.
The F-H-H system
Two reactions were studied here: F+H2 to HF+H, and the reverse, H+HF to H2+F. The first is exothermic, HF being strongly bound and low in energy, while the other is endothermic, being the reverse reaction. This is confirmed by observation of the potential surface, where the lone F and H2 molecule are higher in potential energy than the HF molecule and lone H
The transition state is more difficult to locate than for the H-H-H system, this system being asymmetric, but approximately occurs when the F-H distance is 1.81 Å and the H-H distance is 0.75 Å. It can easily be inferred from this that the transition state strongly resembles the reactancts, a free F atom and H2 molecule. Taking the aforementioned point as the transition state, the activation energy of each reaction may be found, as shown in the plots below, by performing an MEP beginning near the transition point and ending in the respective reactant wells. The difference between the plateaus on each plot gives the difference in energy between the transition state and reactants:
Trajectory efficacy
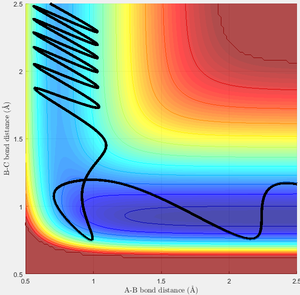
One possible trajectory for the forward reaction is given below, along with the conditions that produce it:
| R1 | R2 | P1 | P2 |
|---|---|---|---|
| 0.74 Å | 2.5 Å | -5 | -1 |
|

|
|---|---|
| A successful reaction of F with H2. | Another angle, showing the asymmetric nature of this potential surface. |
Here, the H2 molecule has very high energy compared to the incoming F atom. An examination of the potential surface shows the much lower potential energy of the products compared to reactants, and demonstrates the difficulty of locating the transition state! As energy and momentum are conserved, the sum of vibrational and translational energies of the atoms after the event must equal the sum of those before plus the energy delta between products and reactants; thus there must be more kinetic energy in this system after the reaction. This extra energy has been transferred into extra vibrational and translational energy, which could be measured experimentally via calorimetry over the course of the reaction.
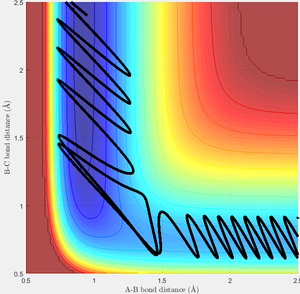
However, this trajectory is quite unusual. There are two types of potential surface for a reaction: attractive and repulsive. The surface above is attractive, one in which the transition state occurs early, and corresponds to an exothermic reaction.[1] The repulsive surface is the exact opposite, and necessarily occurs for the reverse reaction here. On the whole, an attractive surface is more likely to be traversed if most of the energy in an interaction is contained in the translational energy of the incoming atom, whereas for a repulsive surface the majority of energy should be in the vibrational motion of the molecule.[1] This can be understood most easily by considering the position of the transition state. For an attractive surface, the best approach to the transition state is directly along the entry channel of the surface, so can be reached most easily through high translational motion. to reach the transition state of a repulsive surface the reaction trajectory must pass round a "corner" and to accomplish this the most successful scenario involves a strongly vibrating molecule, where the distance R1 is already changeable. This sums up Polanyi's rules, and I have attempted to illustrate a typical example of each rule below.

|
|
|---|---|
| Successful trajectory for the exothermic reaction, starting with F+H2'Note high initial translational energy. | The reverse reaction, starting with H+HF'Note high initial vibrational energy. |
(In order to get only kinetic energy, you must cancel out some of the coupled motion Tam10 (talk) 16:21, 22 May 2017 (BST))


