MRD:AC5116
Molecular Reaction Dynamics: Applications to Triatomic systems
EXERCISE 1: H + H2 system
For this section r1=rBC and r2=rAB
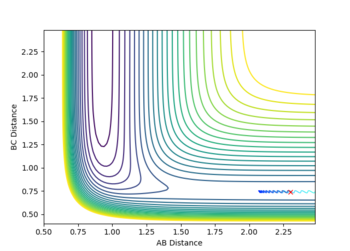
The trajectory of a reactive system
Determining the Transition State of the H2/H System
What value do the different components of the gradient of the potential energy surface have at a minimum and at a transition structure? Briefly explain how minima and transition structures can be distinguished using the curvature of the potential energy surface.
At both a energetic minima and a transition state, each component of the gradients of potential energy must be zero, i.e.:
for all coordinates ri.
Unlike an energetic minima, a transition state is a saddle point, meaning it is a maximum in one direction(co-ordinate) and a minimum in another. The second derivatives of potential with respect to the co-ordinates determines whether a stationary point (i.e. when where or all co-ordinates) is a maximum, minimum or saddle point. By considering:
If , the stationary point is a saddle point.
If , the stationary point is either a minimum or a maximum (minimum if , maximum if ).
Ng611 (talk) 13:22, 8 June 2018 (BST) This is good, but you should make it clear what the vectors r1 and r2 represent with respect to the PES (preferably with a diagram)
Report your best estimate of the transition state position (rts) and explain your reasoning illustrating it with a “Internuclear Distances vs Time” plot for a relevant trajectory.
rTS=0.908 for both H-H distances in the TS.
For the H2 system the potential energy surface is symmetrical in both co-ordinates so the transition state must lie somewhere along the line where r1=r2. Hence, in order to determine the location of the transition state, a number of simulations were ran with equal starting values of r1 and r2 and with zero initial momentum(so the particles initially have no kinetic energy and sit directly on the minimum path of the potential energy surface). If a transition point has been found, the particles the trajectory will not change, as the particles are stationary and the system is at a point on the surface where , and should not oscillate. If a transition state is not found, the system will simply form reactants or products.
By Hammond's postulate it is expected the TS has a structure similar to both the reactant H2 and product H2, as it is equally close in energy to the reactants and products, giving a linear H-H-H structure with equal H-H bond lengths. The H-H bond length in this TS should be longer than the bond length in diatomic H2 (0.74) as over the course of the reaction the diatomic reactant's bond lengthens (r1 increases) as one of the atoms leave and r2 decreases towards the bond length of a hydrogen atom (from an initial value greater than this).

The transition state structure was found by increasing the initial co-ordinates from r1=r2=0.74, with initial momenta p1=p2=0, until the distance vs. time graph for the simulation indicated no oscillation in the values of r1 and r2. If an increase in amplitude of the oscillation was observed, the The transition state was hence found at approximately, rTS=0.908
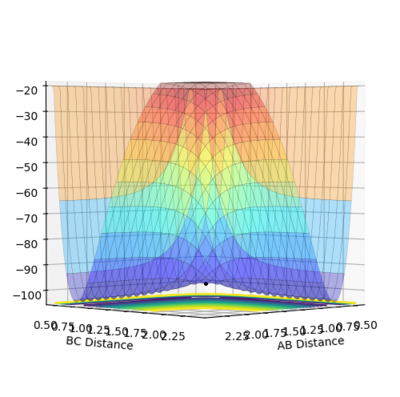
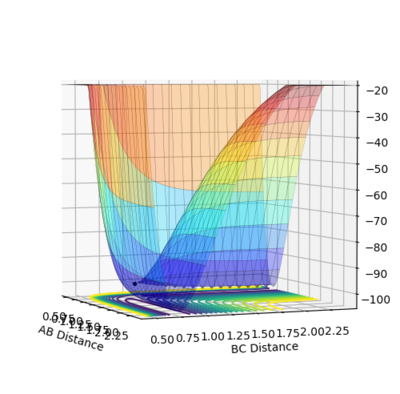
Ng611 (talk) 13:22, 8 June 2018 (BST) Very good examples here!
Minimum Energy Pathway(MEP)
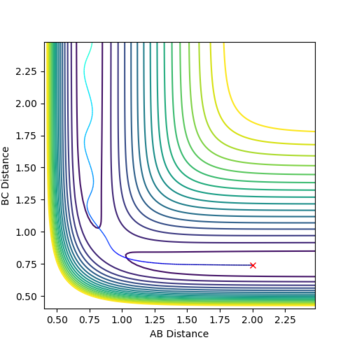
The minimum energy pathway (MEP) for the reaction is found by moving the particle along the surface infinitely slowly, by setting the total speed(and kinetic energy) of the system to 0 at each time step of the simulation. This results in the total energy of the particles to be equal to only the potential energy on the surface. It turns out that in this simulation the distances r1 and r2 vary so that the trajectory exactly follows a path such that at every point the system is at an energetic minimum in the direction of the path, i.e. 'the floor of the valley'. Along this path, however, points may be maxima in the direction orthogonal to the path (namely at the transition state, which is a saddle point). Part of the MEP was investigated by displacing the system a small amount from the transition state in one co-ordinate so that r1=rts+0.001 and r2=rts (where rts=0.908, as found previously) with an initial system momentum of p1=p2=0

This slight displacement r1 from the TS position results in the formation of a H2 molecule with the bond forming in r2 (i.e between H atoms 2 and 3) and the loss of the third hydrogen. This can be seen by the path in the MEP tending to a constant value of r2, i.e. the bond length of the H2, but with r1 continuing to increase as the third hydrogen moves way from the newly formed molecule. As expected the 'trajectory' follows a path along the bottom of the potential energy surface(PES).

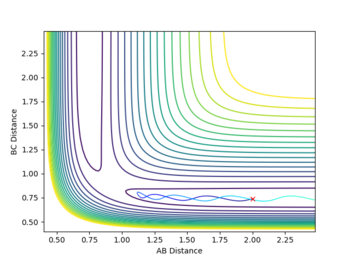
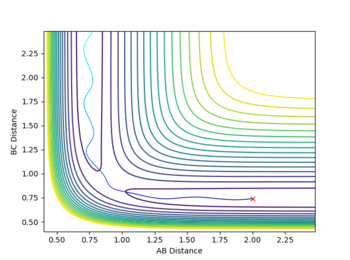
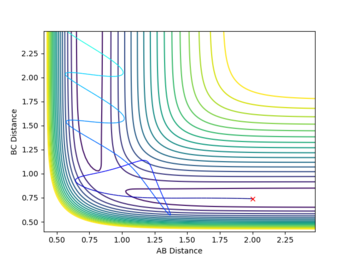
Running a calculation with the same initial conditions as the discussed MEP calculation, but as a dynamics simulation (i.e. where the speed and kinetic energy is allowed to vary naturally) gives a somewhat different path. Firstly, the trajectory reaches the edges of the contour plot in notably fewer time steps than the analogous MEP case; in this case the dynamics trajectory reached the edge of the surface at time step 578, whereas the MEP did not reach the edge even after 10,000 time steps. Secondly, there is a very noticeable oscillation along r2. This path can be interpreted similarly to the MEP case where a bond has formed in r2 and r1 continues to increase as the 3rd hydrogen atom moves away, the only difference is r2 no longer reaches a constant value, but instead oscillates about one.

The origin of this difference is simply that the in the dynamics trajectory, the system is allowed to gain kinetic energy, so as the system moves down the 'hill' of the potential energy surface (from its initial point near the TS), the potential energy lost is exactly converted to kinetic energy (this can be seen in the figure above). This kinetic energy gained by the system explains the two key differences between the MEP and the dynamics trajectory; the kinetic energy makes the reaction run faster as all the atoms involved may move faster and the system uses some of this kinetic energy to cause oscillation of the H2 bond observed in the dynamics trajectory. The process of vibration itself is a back and forth exchange of kinetic energy with potential energy; this however is not observed in the energy time diagram of the dynamics calculation as the H-H-H potential surface is very flat at the bottom and the momentum of the system is low so the fluctuations in kinetic and potential energy are too small to be seen in the plot, but can be seen upon zooming in.
Switching the initial particle position to be a small deviation from the transition state in the r2 direction instead (opposite to the previously discussed case), it is expected that the system falls down from the transition state by increasing r2 and forming a H-H bond in r1. In the MEP, the length of the bond formed will be determined by the minimum energy path and in the dynamic system the H-H bond length will oscillate about this value, as before.
Ng611 (talk) 13:24, 8 June 2018 (BST) A very thorough discussion here, well done!
Reactive and Unreactive Trajectories
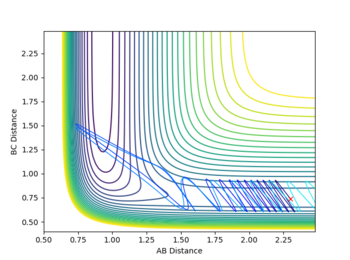
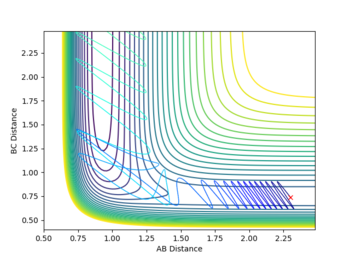
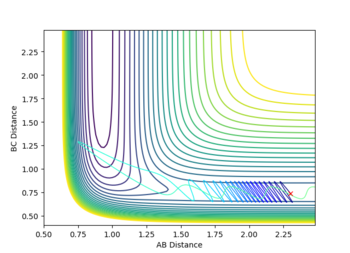
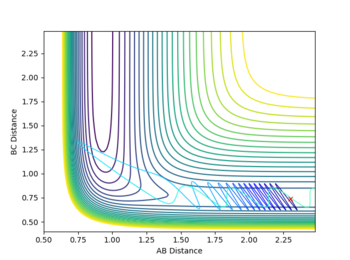
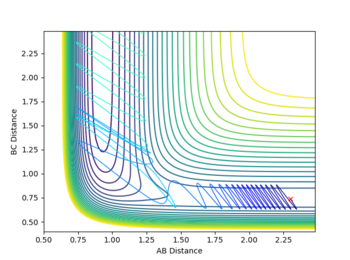
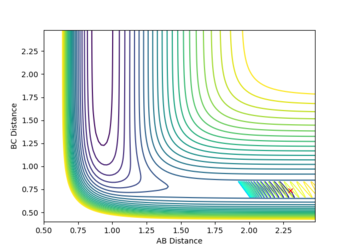
Complete the table by adding a column with the total energy, and another column reporting if the trajectory is reactive or unreactive. For each set of initial conditions, provide a plot of the trajectory and a small description for what happens along the trajectory.
State what are the main assumptions of Transition State Theory. Given the results you have obtained, how will Transition State Theory predictions for reaction rate values compare with experimental values?
Transition State Theory [1] [2]assumes that reactants are in a form of chemical equilibrium with activated complexes. These activated complexes are close in energy and similar in structure to the transition state, though and non-reversibly form the reaction products if the vibrational motion of it passes through the transition state. The non-reversibility of forming products this way prevents recrossing the barrier. This assumption also doesn't take into account the specific modes of vibration and bond activation required of the
Transition State theory should hence over estimate experimental rate reaction values as recrossing the barrier is not taken into account by TS theory, which decreases the rate of product formation.
Ng611 (talk) 13:26, 8 June 2018 (BST) Absolutely. Another significant (although far less significant than TS recrossing) effect is quantum mechanical tunneling. How would tunneling affect the rate? And how would this change for different species?
EXERCISE 2: F - H - H system
2 atoms of hydrogen and an atom of fluorine can be combined in three possible linear reactions(along with a few equivalent processes):
Classify the F + H2 and H + HF reactions according to their energetics (endothermic or exothermic). How does this relate to the bond strength of the chemical species involved?
H-H + F --> H + H-F Exothermic
F-H + H --> F + H-H Endothermic
H-F + H --> H + F-H
The first 2 of these reactions are simply the reverse of each other. They both involve a change in potential energy that is equal and opposite of the other. The first is an exothermic reaction, whereas the latter is endothermic; reflecting the greater stability of HF. This is a consequence of the H-F bond being much stronger than a H-H bond.
The 3rd reaction above is simply a molecule of HF losing one H and gaining another H. This case is almost as the H3 system, and the PES of in this case is similarly symmetrical. This reaction is not considered any further in this report.
The H - H - F Potential Energy Surfaces
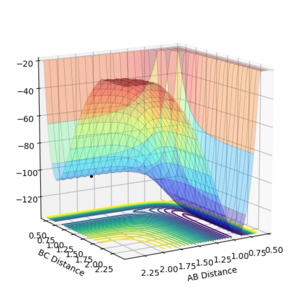
The potential surfaces of H-H + F and F-H + H are shown in the figures below. It can be seen they are simply reflections of each other. The reflection is caused as the coordinates(rAB & rBC) defining the H-H distance and the H-F distances are simply swapped between the two systems. In reality all that defines which of the above reactions is occurring is the initial seperation of the diatomic molecule.If the initial H-H distance is close to the H-H bond length (0.74 Angstrom), the H-H + F (exothermic) reaction is being investigated or if the H-F distance is close to the H-F bond length the H + H-F reaction is being investigated.
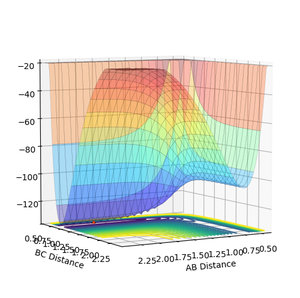
The Transition State of the F-H-H surface
As both the F H-H and F-H H systems have the PES (with reflection if the co-ordinate system is swapped), the transition state for both will have the same values of rFH,ts rHH,ts in both cases. As such the exothermic (F + H-H) reaction's surface will be considered to find the TS.
To assist with finding the TS state Hammond's Postulate is employed. Hammond's Postulate states that structure of a transition state is similar to the nearest in energy intermediate, reactant or product. In a single step process, three types of transition state;
- An early transition state occurs near the reactants on the PES. This occurs for exothermic reactions with a relatively low activation energy. Hammond's postulate therefore predicts the TS to be similar to the reactants.
- A late transition state is close in structure and energy to the products. This occurs for Endothermic reactions with a high activation energy(and hence a low energy difference between the products and the TS. Hammond's postulate therefore predicts the TS to be similar to the products.
- In a third case, Hammond's postulate cannot be used when the reaction is not particularly endothermic or exothermic and the activation energy is very high.
In the case of the H-H + F reaction, the reaction is fairly exothermic and the activation energy is very low (there is no visible maximum along the reaction coordinate, indicating a low Eact), suggesting the TS has a very similar structure to that of a H-H molecule. In terms of the PES this means that the transition state lies in the region before the turn corresponding to a H-H bond. As a H-H molecule clearly has no F in this implies a long H-F bond in the TS and a H-H bond very close (but likely longer) than 0.74 angstrom (the H-H equilibrium bond length).
The transition state was hence then found by varying the initial H-F bond length(and the initial H-H bond length a small amount from 0.74 Angstrom) from its equilibrium value (0.91 Angstrom) of a dynamic system with 0 initial momentum until the trajectory showed no motion and the energy time graph showed a flat line for kinetic and potential energy. Using the above method the transition state was found to be at the point rFH,ts=1.81 and rHH,ts=0.746. rHH,ts is very close to the HH bond length and rFH,ts is much greater than the equilibrium HF bond length(by a factor of approximately 2), as is expected by Hammond's Postulate.
Running the dynamics simulation with more time steps (1000 instead of 500) for a point starting at the transition state, it was found the system changed, decreasing the H-F distance a small amount. This implies that the transition state previously found was inexact and slightly underestimated the HF bond length of the true TS. The original rFH,ts was hence iterated on until the system no longer moved under 1000 steps, to obtain a value slightly accurate to the true TS of r'FH,ts=1.81022. This iteration is relatively insignificant, so the original value will used for the rest of this report.
Activation energies of F+H-H and F-H + H
The activation energy can be found by running MEP calculations from a point close to the transition state that is slightly displaced towards reforming the desired reactant. Plotting the energy vs. time graph of this minimum pathway then gives a reaction profile for the formation of the desired product from the transition state, as the MEP must follow the reaction co-ordinate. The activation energy can then be calculated from the difference between the initial energy (near the TS) and the plateaued energy of the reactants.
The table below summarises how the activation energies were found for the exothermic and endothermic reactions:
Report the activation energy for both reactions.
| Reaction | rFH | rHH | Einit | Ereactant | Ea=Einit-Ereactant |
|---|---|---|---|---|---|
| F + H-H (exo.) | 1.84 | 0.746 | -103.752 | -103.966 | +0.214 |
| F-H + H (endo.) | 1.79 | 0.746 | -103.753 | -133.847 | +30.094 |
The chosen displacements from the TS are to shrink or expand the rHF distance further or closer to the HF bond length depending on whether HF(closer) is the desired reactant or not (further).
The time energy plots used to get this data are shown annotated below:
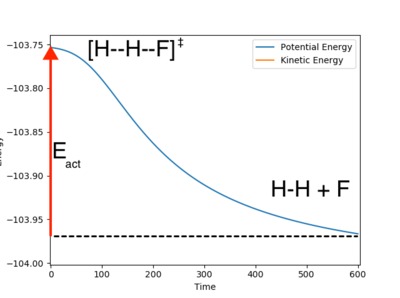

Due to the very shallow nature of the surface in the reactants region of the exothermic reaction, the energy time graph doesn't seem to quite reach a flat plateau in the plot shown. However as the H F distance continues to increase in time, the energy of the reactants should continue to decrease, with a flattening gradient, giving a slightly lower product energy. The differences should be negligible on Ea.
Ng611 (talk) 13:33, 8 June 2018 (BST) It's likely that it is a negligible difference, but some evidence backing up your assertion (fitting and extrapolating the curve for example) would be useful. It's not at all important that you've not done this, but it's something to consider in the future.
Dynamics of the Exothermic Reaction
Reactive Trajectories
The reactivity of initial conditions with rHH=0.74,rHF=2.3, pHF=-0.5 and -3=<pHF=<3
These reactions all start with a high initial vibrational energy(except pHH=0, of course). There is very little difference between the successful and unsuccessful reactions.
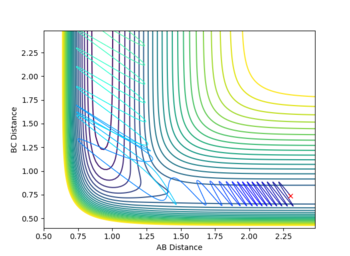
In another case where rHH=0.74,rHF=2.3, pHF=-0.8 and pHF=0.1. There is very low vibrational energy and high translational energy initially(shown by the small fluctuation in rHH and high translational energy. This reaction was successful under these conditions corresponding to the those expected by the Polanyi Rules [1]
In light of the fact that energy is conserved, discuss the mechanism of release of the reaction energy. How could this be confirmed experimentally?
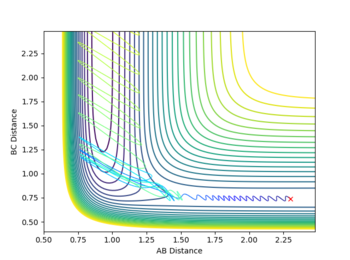
After reaction the energy lost by falling down the potential barrier is converted into a form of kinetic energy; either vibrational or translational. Strong vibration can be seen in the trajectory above. This results in an increase in the population of higher excited vibrational states. As a consequence, the IR spectra of the vibrationally excited molecules will show stronger hot bands (bands of lower intensity and slightly lower frequency normally only occurring at high temperatures) from the transitions from the excited state to the level above(the lower frequency is due to the anharmoticity of the potential surface).
Ng611 (talk) 13:33, 8 June 2018 (BST) Yep, good!
Dynamics of the Endothermic Reaction
Discuss how the distribution of energy between different modes (translation and vibration) affect the efficiency of the reaction, and how this is influenced by the position of the transition state.
The endothermic reaction being discussed is: F - H+H->F + H-H.
The transition state for this reaction is very close to the F + H-H products on the PES and hence there is a very late transition state with a very high activation energy.
Polanyi's Rules [1] (empirical rules for 3 body co-linear reactions) state that for a reaction with a late transition state the reactants must have a high initial vibrational energy in the diatomic molecule and a low translational energy. This allows the for the diatomic bond length to increase enough such that the system can pass into products channel where the transition state is located. If translational energy is too high, the H-H bond length will reach rHH,TS far sooner than the F-H bond may be able to reach its transition state length. In a case where there is an early transition state, a low vibrational energy in the diatomic bond and a high translational energy is generally favoured, for opposite arguments to the case before. The reverse is also true for both cases(e.g. if the reactants start with a high translational energy and low vibrational, for a late-transition state, reaction will not occur).
This can be understood in the F-H-H system, by the F-H bond in the reactants(of the endothermic reaction) being the strongest bond in the system (i.e. stronger than the H-h bond in the products) and so a large amount of vibrational energy is needed to be put into it to weaken the bond so the other hydrogen atom can form a now stronger H-H bond (due to the H-F weakening from vibration high amplitude vibration) with the dissociated molecule instead of just colliding with the molecule and bouncing off.
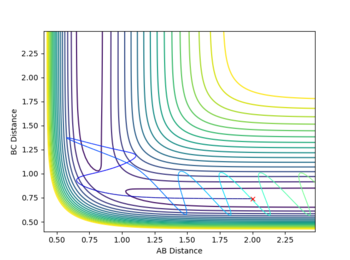
A reactive trajectory was found by starting the system with a set of conditions that would suggest an unreactive trajectory by Polanyi's Rules; a high pHH=-7 and a low pFH=-2 was given to the system to give a high translational and low vibrational energy to the initial conditions, with starting positions of rFH=0.91(the F-H equilibrium bond length) and rHH=2. This set of initial conditions had a kinetic energy of 39.684, greater than the activation energy of 30.094.
Despite the initial total energy being greater than activation, reaction does not occur. This is because, as previously stated there isn't the correct amount of energy in the appropriate mode (in this case not enough vibrational energy and too much translational); simply sending a high energy atom toward a molecule doesn't instantly break it apart and form a new bond. The trajectory for this reaction is shown below.
Ng611 (talk) 13:35, 8 June 2018 (BST) Some good examples in this section, and overall a very good report, well done. I've made a few comments throughout, but by and large these were minor things. Overall, a very good piece of work.

A reactive pathway was found by increasing pFH and decreasing pHH until a reactive pathway was found. Although pFH and pHH don't directly correspond to the vibrational and translational momenta, varying these properties as if they were does help put more vibrational and less translational energy into the system.
A reactive trajectory was found with initial conditions pFH= -12 and pHH =-3.6. The far greater increase in pFH momenta is needed to cause a sufficient increase in Evib due to the high mass of the F atom.
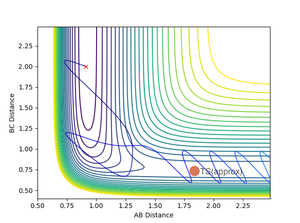
Having the high vibrational energy allows the reaction to pass into the products channel and over the TS.
This reaction had a very high initial kinetic energy of +45.549. All though this is much higher than the previous case, it still shows the requirement for high vibrational energy in the reactants, obeying the Polanyi rule
Other reactive conditions were found with pFH= -12 and -3.0 =<pHH =<-4.5. These all had much more chaotic trajectories than the previously mentioned trajectory, including barrier recrossing a few times.

