MRD:AA12116
H + H2 System
Transition state and minimum energy paths
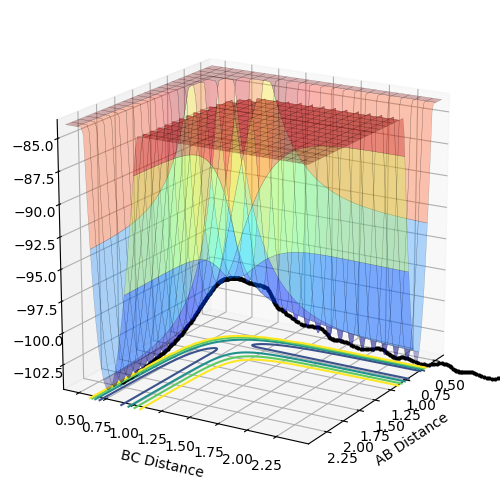
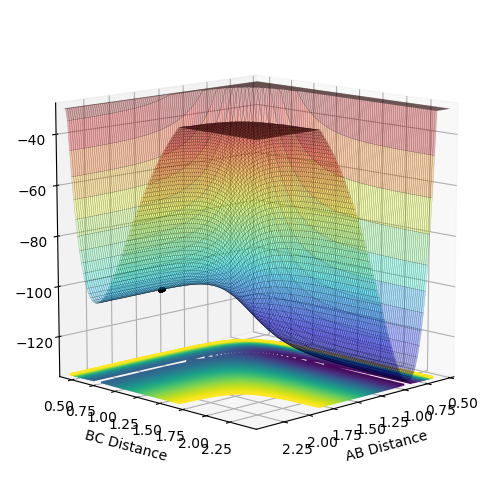
The transition state is an energy barrier, referred to the 'saddle point', and appears as a maximum point along the minimum energy path on the potential energy surface of this system. The minimum energy path shows a route in which asymmetric stretching is observed through out the trajectory, and is essential to achieve dissociation of the initial HB-HC and subsequently form the HA-HB bond. Following a path of symmetric coordinates would result in the dissociation of all the atoms.[1] By taking the derivative of the line trajectory along the minimum energy path at the transition state and at the minimum, the gradient is found to equate to zero. By taking the second derivative of the gradient, the minimum and maximum points can be distinguished. A positive second derivative implies that the critical point is a minimum, and a negative second derivative distinguishes the critical point as a maximum. At the saddle point both a minimum and a maximum are observed, as the trajectory of the minimum is found to be orthogonal to the lowest energy path trajectory, where the critical point observed is a maximum.
Minimum: ; Maximum:

Locating the transition state
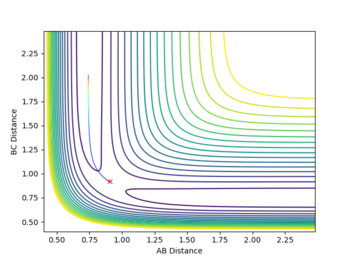
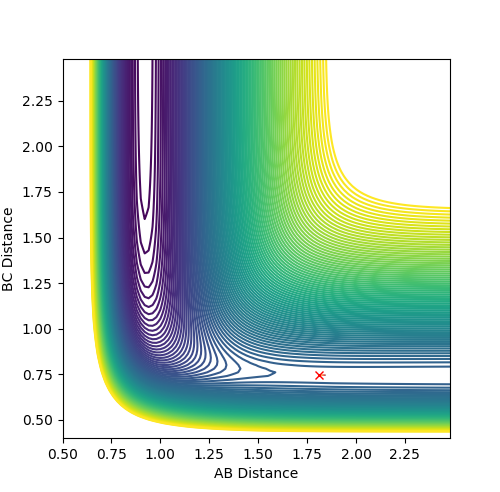
At the transition state there are no oscillations observed as no bonds are present, and the distance between the atoms are the same either side the central atom, therefore rAB is equal to rBC, with momenta at zero. A good estimate for the bond distance at the transition state was found to be 0.90777 Â.
Figure 1 shows a lack of oscillations for a period of about 13 min. This implies that there are no bonds present at this point and until an A-B bond forms, where a fall in distance and oscillations are observed.
Minimum energy path (MEP)
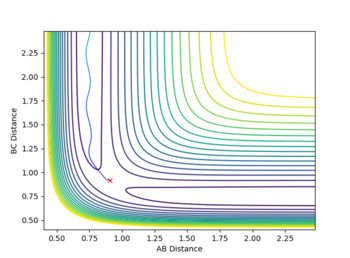
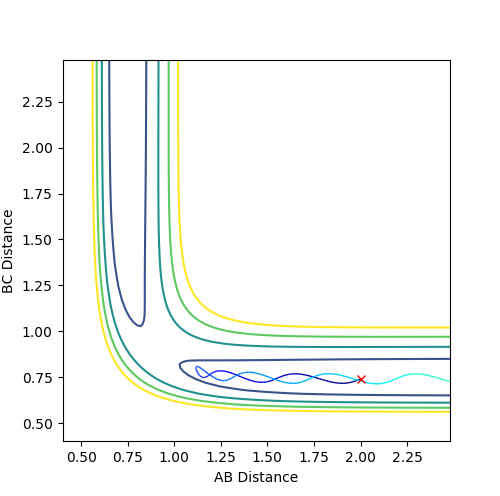
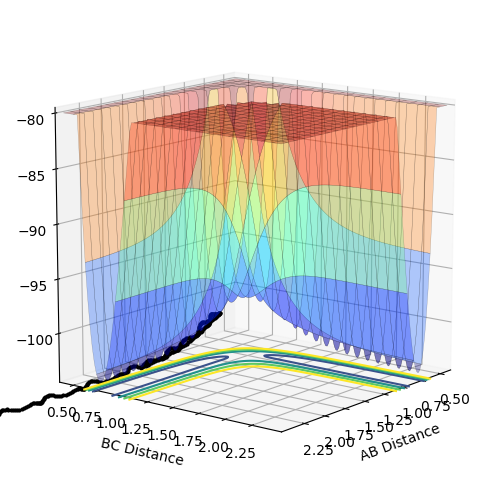
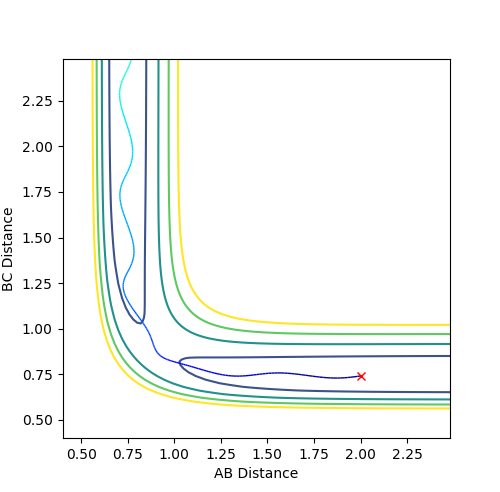
The estimate found for the transition state allows visulisation of the trajectory of the minimum energy path. By slightly displacing the system, through increasing the rBC distance by +0.01 whilst keeping rAB constant, an MEP calculation illustrates the minimum energy trajectory (Figure 2), where the reaction starts at the transition state marked as X; however, this does not accurately depict the motion observed in the atoms. Although the trajectory is accurate, the line displayed is fails to account for the motion of the diatomic molecule formed by A and B.
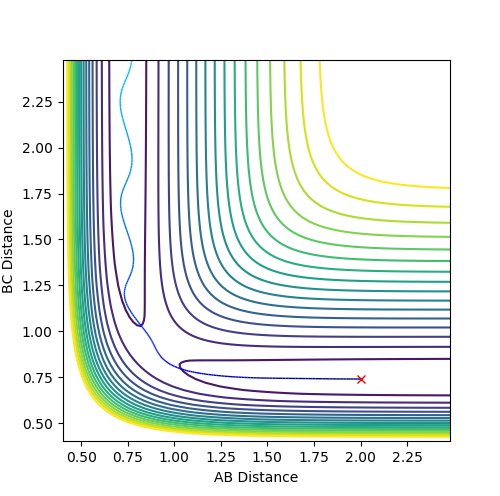
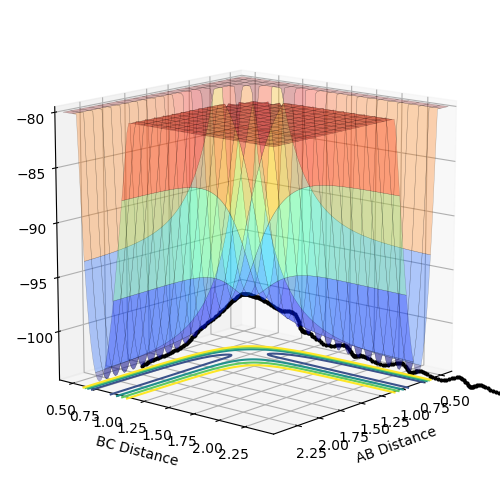
Running system under the same conditions through a dynamic calculation displays a more realistic trajectory. In Figure 3 the trajectory is shown to oscillate, which accounts for the formation of the A-B bond in the system, where the oscillations are small variations in the A-B bond distance due to vibrations.
Reactive and unreactive trajectories
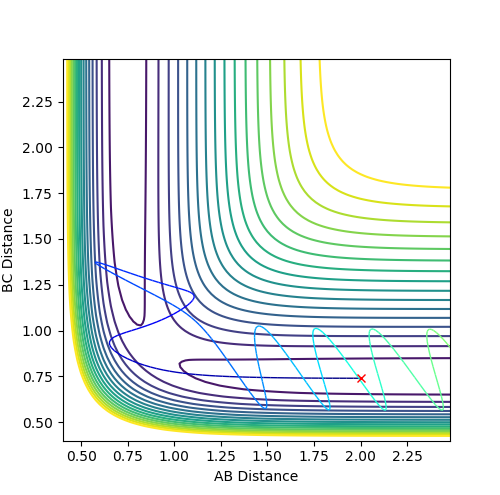
The reactivity of the trajectory can be determined by observing whether its passes the transition state region. For successful reactivity the atoms must have enough momenta; this means that the atoms would have enough energy overcome the energy of the transition state, and achieve reaction completion. In the table below, the reactivity of the atoms of the system are assessed based on the momenta of between the atoms at distances of 2.0 and 0.74 for rAB and rBC respectively.
Transition State Theory
Transition state theory uses 3 assumptions that assist in the determining whether a molecular collision translates into a reaction. The assumptions are[2]:
1. Reactant states are in equilibrium with the transition state and not the products.
2. Trajectories that cross the transition state saddle point do not recross it before attaining equilibrium with the product or reactant side.
3. The reaction coordinate degree of freedom is treated by classical mechanics.
The assumptions of transition state theory are not always applicable in reality. The third assumption would observe a successful reaction every time the molecules collide with sufficient energy. This fails to take into account the tunneling effect observed in quantum mechanics which allows the crossing of a barrier with a finite energy.
Although at lower temperatures, reactants typically pass through the lowest energy point on the PES, TST fails to predict the reactions at higher temperatures. The increased motion of the reactants can lead to unpredictable pathways which do not involve transition states at the lowest energy.
The limitations of the transition state theory lead to the prediction of reaction rates that are faster than observed experimentally. Failure to consider recrossing shows that many unsuccessful reactions may be predicted as reactive in reality.
F - H - H System
Energetics of the F + H2 and H + HF systems
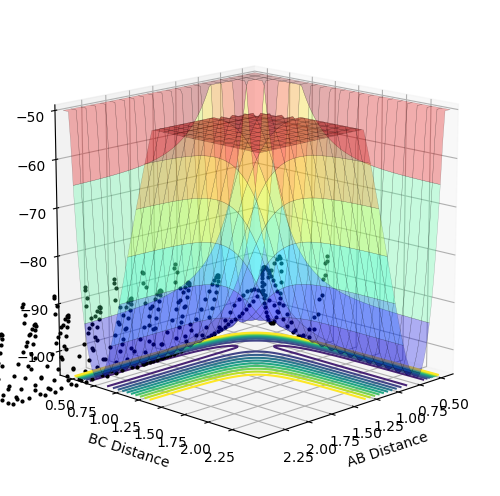
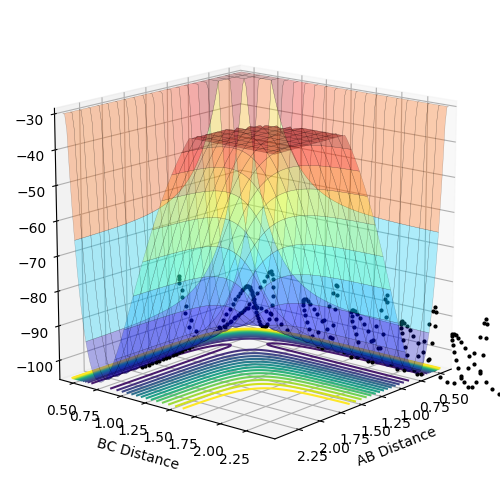
Analysis of the potential energy surface of each system allows classification of the reaction as either exo- or endothermic. The PES of the F + H2 shows a steep fall in the energy of the reactants after passing through the transition state energy. This suggests that the system is exothermic as there is a release of energy from the system, and the products lie deeper in energy. The potential energy surface of the H + HF system displays an increase in the energy of the products compared to the reactants. This shows that the reaction is endothermic as the system is gaining energy. The results obtained from both systems shows that the H-F bond strength is more energetically stable than the H-H bond. This can be observed through the more stable energy of the product observed in the first system. The difference in bond strength can be attributed to the polarisation of the bond. Since F has a greater inherent electronegativity than H, the attraction of H to F is greater than H to H. As a result, the energy involved in the enthalpy of formation of the H-F bond is greater than the enthalpy of dissociation of a H-H bond.
Approximating the location of the Transition state
Hammond's postulate states[3]: "If two states, as, for example, a transition state and an unstable intermediate, occur consecutively during a reaction process and have nearly the same energy content, their interconversion will involve only a small reorganization of the molecular structures."
Activation Energies of the systems
The activation energy was calculated as the energy separation between the reactants and the maximum point of the transition state energy.
Activation Energy = Energy of transition state - Energy of starting reagents
The activation energy difference between the endothermic and exothermic reactions observed in the table below is expected due to the greater separation between reactant energy and transition state energy peak.
| System | Transition State Energy (Kcal/mol) | Starting Reactants Energy (Kcal/mol) | Activation Energy (Kcal/mol) |
|---|---|---|---|
| F + H2 | -103.752 | -103.886 | +0.134 |
| H + HF | -103.752 | -133.807 | +30.055 |
Mechanism of release of the reaction energy
Observation of the "Internuclear Momenta vs Time" graph shows that the H-F bond oscillated with significantly higher momentum than the H-H bond. Given that the reaction of this system is exothermic, following the dissociation of H-H, potential energy is released by the reaction (visible in the potential energy surface plot shown earlier). However, since the total energy in the system must remain constant, according to the law of conservation, the potential energy is converted into kinetic energy (Figure 5). The subsequent effect of this energy conversion causes the H-F molecule to oscillate with greater momentum due to the gain in kinetic energy.
The conservation of energy can be experimentally observed IR, through electronic absorption spectra. Excitation of a molecule will result in observable transitions in the spectra as vibrations which correspond directly to the energy of the incident radiation applied on the molecule. The frequencies obtained after the excitation are in the form of the initial fundamental vibration followed by higher energy overtones.
Polanyi's empirical rules
Reactants in a system must have sufficient energy to overcome the transition state energy for a successful reaction. The distribution of energy between translational and vibrational modes can be useful in determining whether the reaction is feasible. Consideration of the location of the transition state is important in determining the distribution of the reactant energy, and therefore whether the reactants will overcome the transition state energy. The general principles outlined by Polanyi's relate to Hammond's postulate an assist in identifying the successful reactions based on energy distribution.[4] An "early" barrier, as seen in an exothermic reaction is more effectively overcome by translational energy, whereas excess vibrational may not be enough to achieve a successful reaction. On the contrary, endothermic reactions that observe a "late" barrier are most effectively surmounted by vibrational energy. The exothermic and endothermic reactions were analysed with consideration of Polyani's rules at distances of (rHF = 2.3; rHH = 0.74) and (rHH = 2.3; rHF = 0.91) respectively.
F + H2 Reaction
The system was setup with different momenta values of pHF and pHH, which were taken as indicators of the relative amount of translational and vibrational energy respectively, to demonstrate Polyani's rules.
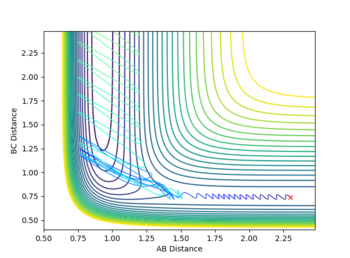
This reactions was observed to have an exothermic reaction earlier and therefore an early transition state which is more effectively surmounted by translational energy. The system was setup with pFH = -0.5 and pHH = -1. Figure 6 shows prominent oscillations in the diatomic H2 molecule corresponding to the vibrational energy. However, due to the low translational energy, there is not sufficient reactive energy to overcome the early transition state energy. This result in no reaction and oscillation of the molecule back down the reaction channel.
Slightly increasing the pFH momentum form -0.5 to -0.8; and deceasing the pHH momentum from -1 to 0.1 results in a clear decrease in the overall energy of the system. However, as figure 7 shows, the reaction is successful as there are oscillations down the product channel corresponding to the bond formed in the H-F molecule. Both of the plots reinforce Polyani's rules as the translational energy was shown to have to dominant impact surmounting the early transition state.
 |
 |
H + HF Reaction
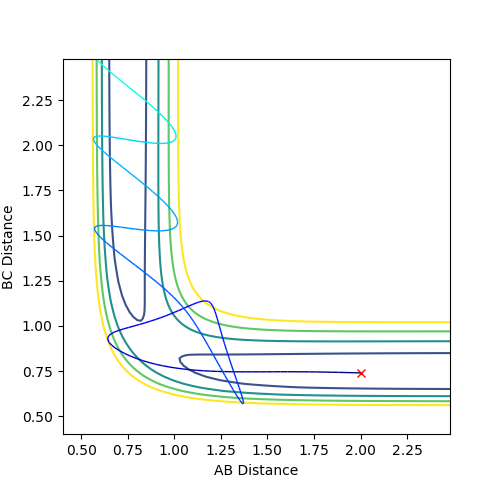
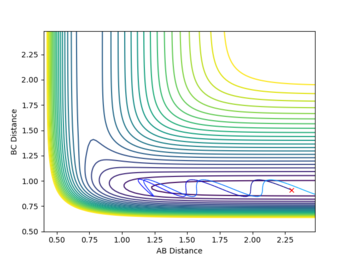
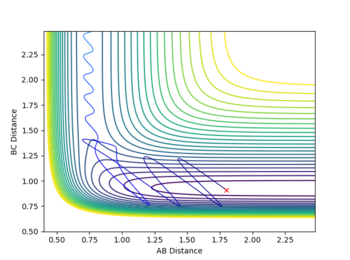
This reaction was observed to be an endothermic reaction and therefore have a late transition state. According to Polyani's rules, it is expected that vibrational energy is more effective than translational energy in surmounting the transition energy of this reaction. Figure 8 shows a calculation at high translational energy and low vibrational energy, where pHH = -3 and pHF = 0.1. Figure 8 shows the resulting plot, where the reaction is not successful. The oscillating H-F molecule approaches the late transition state, however is unable of overcoming the energy. In this case, even though the translational energy is large, there is insufficient vibrational energy, which is the more effective energy in endothermic reactions.
To achieve a successful reaction, translational energy was gradually decreased whilst vibrational energy was increased. The resultant plot of the successful reaction is displayed in figure 9, where the smaller oscillations that are observed in the product channel are due to the H-H bond. The final values obtained were pHH = -1 and pHF = 6.8.
 |
 |
References
[1] McBridge, J.M. Potential Energy Surfaces for Structure and Dynamics, Yale University, 2001.
[2] Felipe, Mihali; Xiao, Yitian; Kubicki, J.D. Molecular Orbital Modeling and Transition State Theory in Geochemistry, Rev. Mineral. Geochem. 2001, 42(1):485-531.
[3] Hammond, G.S. A Correlation of Reaction Rates. J. Am. Chem. Soc., 1955, 77: 334–338.
[4] Steinfeld, Jeffrey I.; Francisco, Joseph S.; Hase, William L.; Englewood Cliffs, N.J. Chemical Kinetics and Dynamics. Prentice Hall, 1989.

