MRD:231014
Molecular Reaction Dynamics: Applications to Triatomic Systems
H+H2 System
I read through all of your explanation. I think you can clearly identify the TS/saddle point and the local minima. The figures illustrate your idea well. The only point I think you mentioned a bit but worth elaborating is how to use the second partial derivatives to test your saddle point, local min/max. For that you can check this video. link--Sw2711 (talk) 17:09, 31 May 2018 (BST)
According to the potential energy curve for a diatomic molecule, the potential energy increases when the molecules move towards each other, i.e. the short-range repulsive forces are dominant, and the energy also increases when the molecule move away from each other, i.e. the long-range attractive forces are dominant. The potential energy is at the minimum when both rAB and rBC are at the equilibrium distance, which corresponds to the bond length of the molecule. Hence, the minimum on the potential energy curve represents the formation of product.
When the potential energy is plotted as a function of both r1 and r2, the reactive trajectory can be shown on the potential surface as a wavy line. The reaction coordinate is the minimum energy pathway that links the reactants and products. The system will reach the minimum potential energy point as the trajectory moves towards the product. The potential energy is thus continually converted into kinetic energy. According to the reaction energy profile, the system needs to overcome an energy barrier to reach a higher energy state called the transition state in order to the form the products. Hence, the transition state is at the maximum in terms of potential energy along the lowest energy pathway.
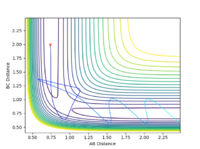
All the minima on the potential energy surfaces are analysed in this investigation. Since the surface plot is 3-dimensional, the gradient of the potential energy surface comprises of two components with respect to two different directions, q1 and q2. The potential energy of the final product corresponds to a minimum on the potential energy curve, which has a zero gradient of potential energy with respect to r2. This final product occurs at the minimum point of the minimum energy path linking the reactants and products, which has a zero first derivative of potential energy with respect to r2, i.e. ∂V(r2)/∂r2=0. The minimum energy path is illustrated as the 'trough' along the reaction coordinate as shown below.
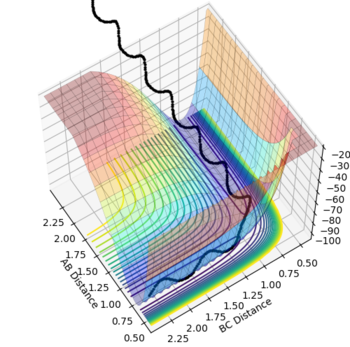
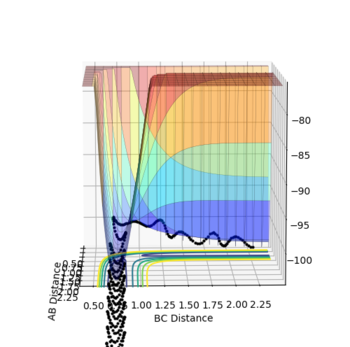
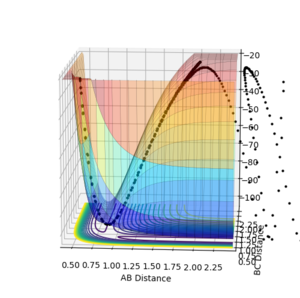
The surface plot, Fig 2, illustrates the potential energy curve of the product: when the dBC is at its lowest and dAB is at its highest, the point corresponds to the product HBHC. The minimum energy path leading to the product is also clearly shown.
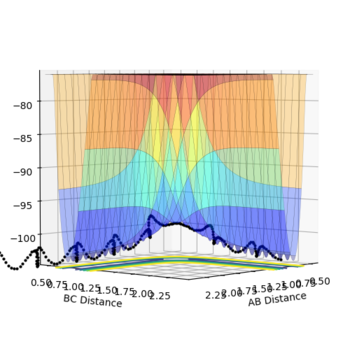
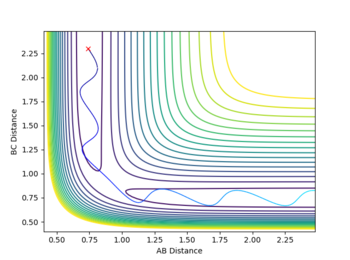
It is worthwhile to explore the transition states as they are often difficult to be observed and short lived transient species. The transition state is a saddle point, which is at the maximum of the minimum energy path. This suggests that, the transition structure is a minimum with respect to some directions on the surface and meanwhile a maximum with respect to other directions. There are many curves along the reaction coordinate that form the minimum energy path as shown on the Fig 3.
The turning point along the reaction coordinate denotes the transition state of the reaction.
The maximum point of potential energy on the minimum energy path denotes the transition state on the reaction profile. It indicates the energy barrier that the reactants have to overcome in order to form the products. Fig 4 indicates that the transition state is situated in the purple concave region. Based on the contour plot, the transition point as the turning point on the reaction coordinate is a maximum along the reaction coordinate and a minimum along the symmetric stretch coordinates perpendicular to the reaction coordiante.
Dynamics from the transition state region
In order to give a better estimation of the transition state position, different initial conditions were investigated with r1 = r2 and p1 = p2 = 0.
Since the H-H bond is 0.74 Angstroms, the internuclear distance of this system must be above 0.74 Angstroms.
When the internuclear distance ranges from 0.74 to 2.3, the animation displays a periodic symmetric vibration initially followed by the break-off of atom C and the increase of distance between atoms B and C.
When r1 and r2 are above 2.3, the animation displays a periodic symmetric vibration. However, the distance is so high that the H atoms do not interact with each other strong enough to form H-H bond.
r1 = r2 = 2.0 Angstroms
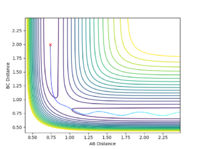
When the distance is set as 2.0 Angstroms, the system is illustrated as shown below.

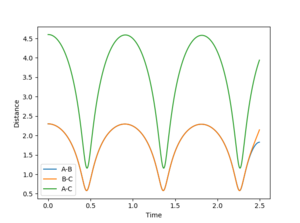
The internuclear distance plot illustrates the periodic oscillation of the atoms in the system. The atoms are far apart from each other initially then the attractive forces draw them moving towards each other causing the internuclear distances to decrease. When the atoms repel each other, they move away again leading to the increase of the internuclear distances. The periodicity suggests that the system lacks sufficient energy needed to overcome the activation barrier. That's not quite true. The activation energy is the energy difference between your TS to the reactants. The energy of your system is already higher than that. --Sw2711 (talk) 17:13, 31 May 2018 (BST) Therefore, the trajectory goes back down and the atoms A and C return to their original positions. This corresponds to the initial conditions where both the momentum values are set to zero. However, this also suggests that the transition state point has not been located yet. Based on the surface and contour plots, the transition state position should occur when the internuclear distance is between 0.75 and 1.0 Angstroms.
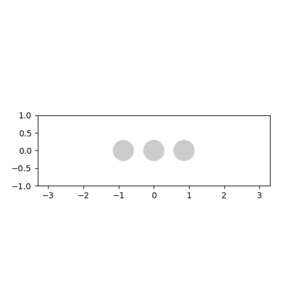
r1 = r2 = 0.908 Angstroms
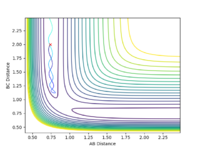
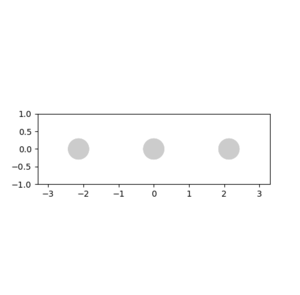
When the distance is set as 0.908 Angstroms, the animation displays that the three atoms stay still indicating that the transition state. Main thing is that it is a saddle point. That's why you set zero momentum, the system won't move--Sw2711 (talk) 17:15, 31 May 2018 (BST)
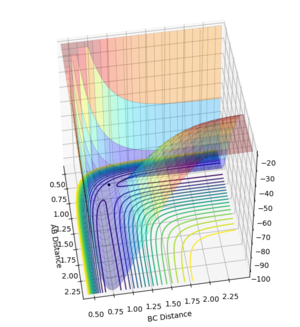
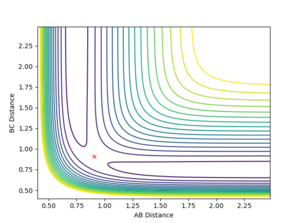
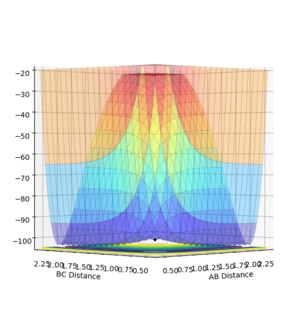
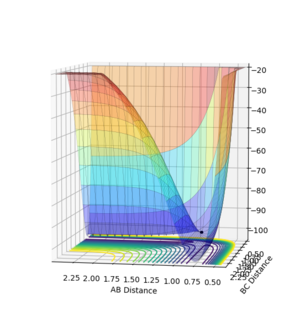
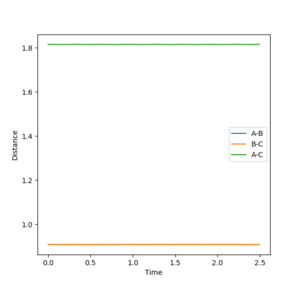
Fig 14 illustrates two straight lines, which indicates that the system overall stays constant so that both rAB and rBC remain the same. Hence, the transition state of the system occurs at r = 0.908 Angstroms.
Calculating the reaction path
Trajectories from r1 = rts + δ = 0.918, r2 = rts = 0.908
The mep is minimum energy path that is not mass-weighted while the reaction coordinate that is calculated under Dynamics method takes the masses of the atoms into account. Thus, the mep simply follows the path of least resistance while the intrinsic reaction coordinate (IRC) is the pathway in mass-weighted coordinates connecting the reactants and products. Based on the comparison of contour plots and surface plots, it takes more steps for the calculation method MEP to obtain the full trajectory of the system.
Based on my understanding, whether it is mass-weighted doesn't define whether it is a MEP. But you are right that depending on which algorithm you use to calculate the MEP, it could be sometimes not mass-weighted. But here, you just need to know the momentum is reset to zero every step. No oscillation in MEP. It follows the lower gradient in the path. If you compare the very first example in this lab with MEP and dynamics, you will see what I mean. Hopefully.--Sw2711 (talk) 17:23, 31 May 2018 (BST)
Final values of the positions r1(t) r2(t) and the average momenta p1(t) p2(t)
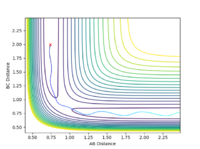
When the r1 = 0.918 Angstroms and r2 = 0.908 Angstroms, the final values ofr1(t) and r2(t) are 9.00 and 0.74 Angstroms respectively; the final values of p1(t) and p2(t) are 2.48 and 0.91 respectively. When the r1 = 0.908 Angstroms and r2 = 0.92 Angstroms, the final values ofr1(t) and r2(t) are 0.74 and 9.00 Angstroms respectively; the final values of p1(t) and p2(t) are 0.91 and 2.48 respectively. The results are reversed due to the reversed values of the initial positions of atoms. This study indicates that the atoms are interchangeable in the system.
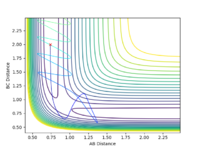
When the initial conditions are set as the final positions of the trajectory that is calculated above but with the reversed signs of momenta, the trajectory is shown as below.
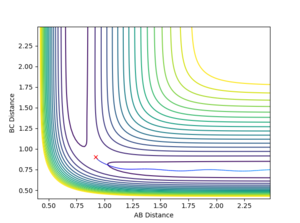
The study shows that the atom A is far apart from atoms B and C (atoms B and C form a H-H bond) initially and then they move closer towards each other forming a 3-atom system with r1 = 0.92 Angstroms, r2 = 0.90 Angstroms and the average momenta of zero. This demonstrates the formation trajectory of the transition state along the minimum energy path.
Reactive and unreactive trajectories
How will Transition State Theory predictions for reaction rate values compare with experimental values? Transition state theory separates the surface energy surface into two regions called the reactant region and product region. The border between the two regions is the transition state. The fundamental assumption of Transition State Theory is that the transition state is in the quasi-equilibrium with the reactants and products. The transition state is assumed to have zero thickness. When applying the Transition State Theory to the potential energy srufaces, quantum tunnelling effects are assumed to be negligible and the Born-Oppenheimer approximation is invoked. Other assumptions include: the atoms in the reactant state have energies that are Boltzmann distributed and an incoming flux of reactants should be thermally equilibrated when the initial state is unbounded. Besides, once the system attains the transition state, with a velocity towards the product formation, it will not return to the initial state region again. [1] [2]
Your table is good. Two points for your TST study. 1. 'equilibrium' is not very applicable here. 'equilibrium' or 'distribution' is normally used for statistical thermodynamics. Here you only have 3 atoms, one reaction. 2. So what is your opinion on TST. Does it predict your experimental results above well?--Sw2711 (talk) 17:26, 31 May 2018 (BST)
F - H - H system
PES inspection
H-H has a bond length of 0.74 Angstroms and H-F has a bond length of 0.91 Angstroms. The longer the bond length, the weaker then bond strength. Thus, the bond length of H2 is stronger than that of HF. Where did you get the idea that the longer the bond length the weaker it is? In that case, the energy to break HH is higher than the energy release from HF. Then this F+H2 reaction will be endothermic. How did you get this reaction is exothermic then?--Sw2711 (talk) 17:32, 31 May 2018 (BST)The F + H2 reaction is exothermic and H + HF reaction is endothermic. This corresponds to the fact that the formation of HF requires the release of energy from the reactants and the formation of H2 needs the input of energy.
The transition state of system is defined as the maximum in terms of potential energy on the minimum energy path. The transition state for the forward reaction F + H2 should be the same as that for H + HF as both reactions form the same [H-H-F] complex at the transition state. The position for the transition state is located to be rAB (distance between F and H1 ) = 1.810 Angstroms and rBC (distance between H1 and H2) = 0.746 Angstroms or rAB (distance between H1 and H2) = 0.746 Angstroms and rBC (distance between H2 and F) = 1.810 Angstroms.
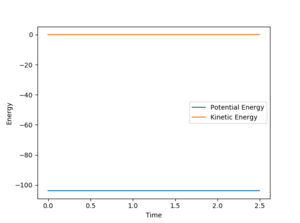
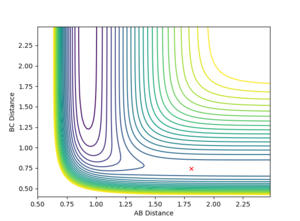
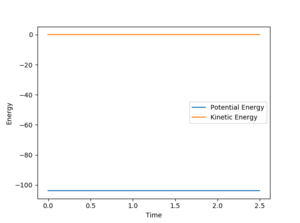
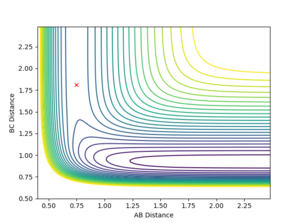
The activation energy is the energy difference between the transition state (a saddle point) and the product (a minimum). Using MEP calculation to plot the energy against time at H-H = 0.75 Angstroms and H-F = 1.70 Angstroms, the transition state is found to occur at -103.783 KCal/mol.
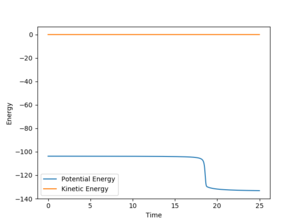
The kinetic energy at the structure around the transition state is zero which corresponds to the definition of transition state as the minimum in terms of kinetic energy.
Hence, for F + H2 reaction, the activation energy = -103.783 - (-104) = 0.217 KCal/mol.
For HF + H reaction, the activation energy = -103.783 - (-136) = 32.217 KCal/mol.
All the rest is good, although you can be more specific how you locate your TS. --Sw2711 (talk) 17:32, 31 May 2018 (BST)
Reaction dynamics
The distance between F and H1, rAB is set as 1.80 Angstroms and the distance between H1 and H2, rBC is set as 0.75 Angstroms. The AB momentum is -1.5 and the BC momentum is -1.0.
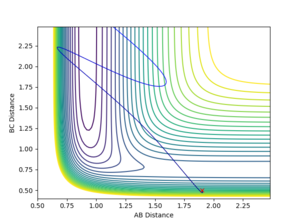
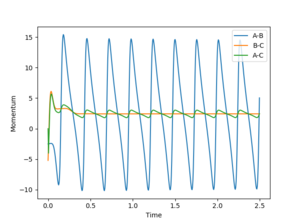
The energy of a system is conserved. From the Fig 22, the potential energy of H1 and H2 is converted to the kinetic energy and vibrational energy between F and H1. IR spectrum can be used to find confirm the existence of vibrational bands of the product HF. The transition between the vibrational states of HF can be seen from the IR spectrum. The second transition (from v = 1 to v = 2) should have a lower frequency than the first transition (from v = 0 to v = 1) due to the narrower spacing as the vibrational quantum number increases.
This part is good--Sw2711 (talk) 17:34, 31 May 2018 (BST)
The Polanyi's empirical rules state that the vibrational energy is more efficient in promoting a late-barrier reaction than translational energy. Hence, if the vibrational energy is dominant then a late transition state is more likely to occur. A late energy barrier usually comes with a highly endothermic reaction, e.g. H + HF forming F + H2. In this case, the transition state adopts a product-like geometry. There is a greater elongation of breaking the H-F bond than the that of forming H-H bond. Thus, a late transition state usually happens in a slow endothermic reaction. On the other hand, a larger amount of translational energy favours an early transition state that adopts a reactant-like geometry. An early transition state is usually characteristic of a rapid exothermic reaction. [3]
Good research. So what is your opinion to the Polanyi's rule? Does it agree with your experimental results or not?--Sw2711 (talk) 17:34, 31 May 2018 (BST)
References
- ↑ M. J. Pilling, P. W. Seakins, Reaction Kinetics, 2nd edition, OUP, 1995.
- ↑ T. Bligaard, J.K. Nørskov, Heterogeneous Catalysis in Chemical Bonding at Surfaces and Interfaces, 2008
- ↑ Transition-State Theory Rate Calculations with a Recrossing-Free Moving Dividing Surface Thomas Bartsch*, T. Uzer, Jeremy M. Moix, Rigoberto H, The Journal of Physical Chemistry B 2008 112 (2),206-212 DOI: 10.1021/jp0755600.

