MRD:2205krb15
Exercise 1: H and H2 System
Dynamics from the Transition State Region
Potential Energy Surface: Gradient Analysis
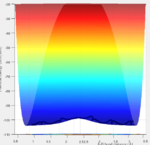
The total gradient of the potential energy surface at both a minimum structure and a transition structure is equal to zero as these are both stationary points of the curve. However, the nature of these stationary points is different and this effects how the trajectories behave when at these points. The potential energy at these points is not static, it oscillates between contours of low and equal value, as the molecule is vibrating despite being at a stationary point.
Distinguishing Minima and Transition Structures using the Surface
Distinguishing between stationary points of different types (minima and transition) can be done through inspection of the curve or through calculation of the second derivatives of the potential energy surface gradient. Inspection is the easier method for this type of situation so will be discussed in sightly more detail.
Inspection:
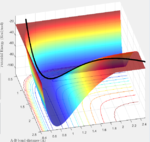
The curve at the minimum has the typical shape expected for a minimum point, and is a stable equilibrium. There must be some kind of initial momentum to move from this point, and the system will tend to one of the global minima on the surface. The curve at the transition state is also a stationary point but is a saddle point rather than a minimum. This creates an unstable equilibrium where a slight change in the geometry deviating from the transition state will cause the system to tend towards either the reactant or product minimum point.
(Any more detail on the mathematics behind distinguishing a minimum and a TS? Tam10 (talk) 17:31, 8 June 2017 (BST))
Finding the Transition State
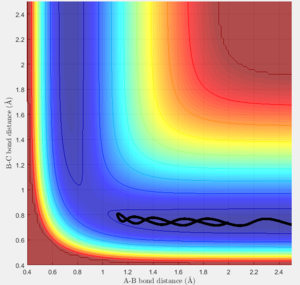
The transition state must obey the condition r1=r2 as the surface being considered is symmetric. Under the influence of this condition, the trajectory will be limited to oscillating along a ridge, seen in the contour plot, effectively eliminating one of the variables, reducing the contour to a 2-D plot and making the process of finding the transition state geometry simpler. With initial momenta set to zero, the system will undergo a periodic symmetric vibration, with the amplitude of this oscillation decreasing as the transition state is reached.
These vibrations in the system are enough to distort the system from the unstable equilibrium of the transition state geometry to tend towards the minima of the reactants or products. The transition state geometry lies at the point where these vibrations are at a minimum, where the system can remain at this unstable equilibrium. The system at this point is held in a static equilibrium, as any distortion from the transition state geometry will cause the system to collapse down to one of the minima.
This point was found to be where the internuclear distances r1 and r2 are equal to 0.90775A.
(Nice use of the GUI to generate this plot Tam10 (talk) 17:31, 8 June 2017 (BST))
Minimum Energy Path
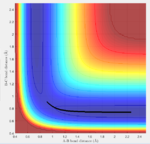
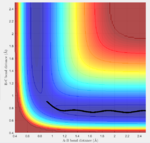
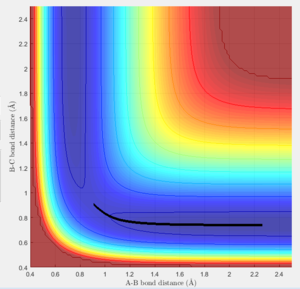
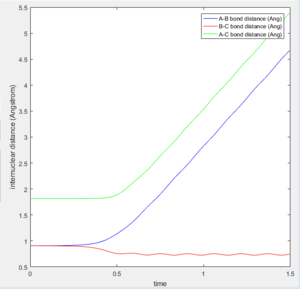
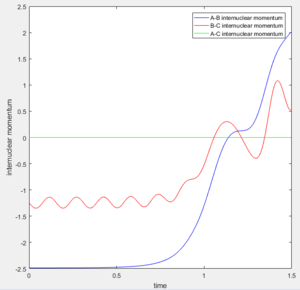
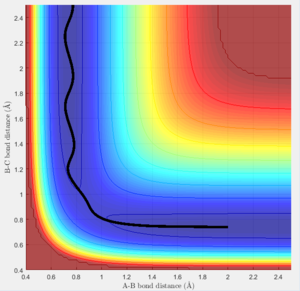
The minimum energy path does not represent a possible physical system, as the reset of velocity at every time step resets the kinetic energy to zero, leaving the potential energy as the only contribution to the total. This breaks the conservation of energy law as the total energy is artificially set to just the potential after every time step. This eliminates any variations in the total energy of the system, reducing it to a flat line lying at the lowest point of the surface contour.
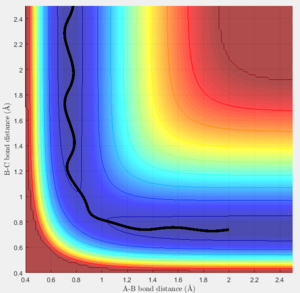
The dynamic calculation using the same conditons produces a similar trajectory but has the oscillation seen in previous plots, due to the variation in velocity and kinetic energy at each time step. This causes the oscillation between the equal contours but still represents a minimum total energy, and a possible physical system because the conservation of momentum law is obeyed.
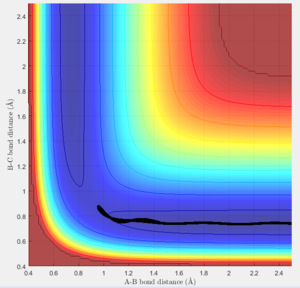
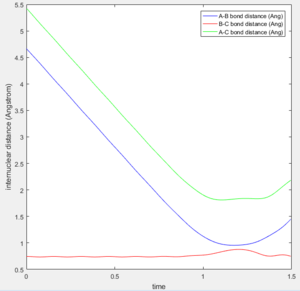
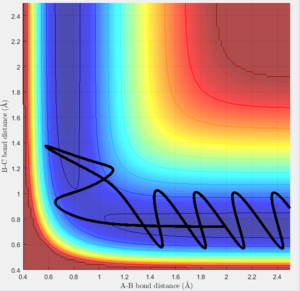
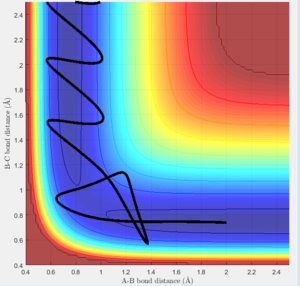
Changing the initial conditions so the values of r1 and r2 are swapped results in A and B coming together to react rather than B and C. The atoms will the smaller distance between them will come together to react, as this more closely resembles the diatomic molecule in the system. These condition sets correspond to a slight displacement towards the reactants or a slight displacement towards the products, with the system tending towards the minima closer in energy to itself.
A new calculation was carried out with the initial distances equal to the final distances oberved in the previous calculation (r1 and r2 equalling 0.73Å and 4.6Å respectively, and the inital momenta equalling the final momentum values with their signs reversed, -1.24kgms-1 and -2.5kgms-1 respectively.
(Wrong units! This is far into the relativistic realm of momenta for atoms Tam10 (talk) 17:31, 8 June 2017 (BST))
This trajectory is unreactive because the transition state trajectory is not breached, so the system does not have the correct geometry to fall to the product minimum.
Reactive and Unreactive Trajectories
Transition State Theory states that any reaction path must pass through the transition state region, the area of the energy surface where the transition state is located. Another assumption made is that the substances involved obey the laws of classical mechanics, this is not always the case with phenomena such as electron tunnelling. The theory also states that when given enough energy, the system should tend to form the products and cannot barrier cross to form the reactants again.
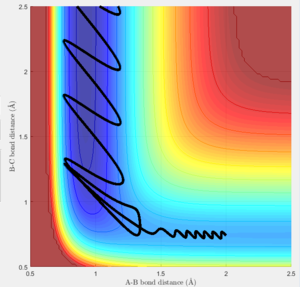
The 4th simulation in the table above should be a reactive trajectory according to the theory, as the barrier recrossing that makes the system unreactive would not be allowed to occur. The final simulation would still be a reactive trajectory as it was given enough energy, but there would be a lot less variation in the trajectory as it would have to pass through the transition state region on the surface, and would not be allowed to bounce through the barrier at all, much less the multiple times that it does.
Therefore, according to the simulations carried out, transition state theory would not accurately predict experimental reactions due to the exclusion of significant quantum effects and a breakdown of the assumptions made when considered in a real sitiuation.
Exercise 2: F-H-H System
Potential Energy Surface Inspection
Classification of Reactions
The reactions being considered for the F-H-H system are F + H2 and its corresponding reverse reaction H + HF. the former of these reactions is exothermic and the latter endothermic. Therefore, the H + HF arrangement of this system is lower in energy (more stable).
This can be related to the strength of the bonds as a stronger bond will be more stable and require more energy input to break it. The HF is the strongest bond being considered in this system as the difference in the electronegativities of the atoms is high, creating a very polarised bond. The H2 bond is symmetric and has no polarity, this along with the low electron density of hydrogen creates a much weaker bond than that present in HF.
Transition States and Activation Energies
 |
 |
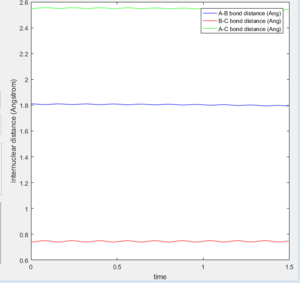
The reactions we are considering are a foward reaction and its corresponding reverse reaction, so the transition state for each will be the same. This lies at a point with F-H distance of 1.81Å and a H-H distance of 0.74Å.
This was found in a similar way to the hydrogen system in exercise 1, except this system is not symmetrical due to the presence of the fluorine atom. With the momenta set to zero, there is only oscillation along a ridge and this was used to pinpoint the transition state of the reaction.
The transition state is similar in energy to the H2 + F part of the system, so will also be similar in structure. This is reflected in the estimated location of the transition state, where the H-H distance is found to be similar to the H2 bond length and the H-F distance is found to be significantly greater than the HF bond length of 0.91Å.
The foward and reverse reactions have significantly different activation energies due to the different natures of their energetics.
The H2 + F exothermic reaction has an activation energy of 0.2 kcalmol-1 (0.837 kJmol-1). The HF + H endothermic reaction has a much greater activation energy of 30.2 kcalmol-1 (126.4 kJmol-1) as the energy of the system must exceed the energy of the transition state which is closer to the much higher energy of the product of this reaction.
Reaction Dynamics
Energy Release for Exothermic Reactions
 |
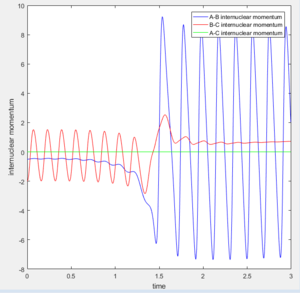 |
The exothermic reaction being considered will be the F + H2 trajectory. As this is an exothermic reaction, the products have less energy than the reactants so there is an excess of energy in the system. This must be released in some way, so the system obeys the conservation of energy law.
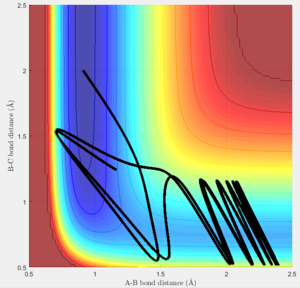
On the surface plot, the reactants are along the horizontal axis and the products the vertical. The amplitude of the symmetric oscillation is much greater in the products, which is one form through which the energy of the reaction can be released. This can also be seen the momentum plot, with the HF internuclear momentum having significant oscillation as the trajectory progresses and the bond is formed, when compared to the smaller amplitude oscillations of the H2 reactant.
These vibrations can be examined using infrared spectroscopy but they are already at an excited state. The relaxation of the vibrations to the ground state will release energy, most likely in the thermal form, so this can be examined through calorimetry to probe the change to the surroundings.
Exploring Values of Momenta
Increasing the value of pHH cause the trajectory to barrier-cross more frequently due to the increased energy of the system. Having a lower pHH value with a slightly increased pHF still caused barrier crossing, at a much lower total energy than the previously discussed case.
The first conditions tested do not form products, the kinetic energy of the approaching hydrogen is likely too high for the system to react. Increasing the pHF value causes significant barrier crossing and recrossing, and decreasing the pHH value means the system doesn't reach the transition state at all.
Polanyi's Rules
Polanyi's Rules state that high vibrational energy favours late transition state reactions and conversely high translational energy favours early transition state reactions. The F + H2 reaction should be favoured by high translational energy. Large variations in the vibrational energy of this systen had relatively low impact on the reactivity of the system, suggesting that Polanyi's Rules apply to this system and the reaction path is determined by the translational energy. The H + HF reaction should be favoured by high vibrational energy. The only condition set tested that crossed the barrier was the one with high vibrational energy, although this was still an unreactive system due to barrier recrossing.
Polanyi's Rules are empirical, derived from experiment, so do not follow the simulations to the extent we would expect, as we are condsidering a single molecule rather than a larger system. There would be other effects present in a larger system with more molecules that would cause the results to tend more towards the predicitons of Polayni's Rules.

