MRD:2019
Introduction
Exercise 1: H + H2 system
On a potential energy surface diagram, how is the transition state mathematically defined? How can the transition state be identified, and how can it be distinguished from a local minimum of the potential energy surface?
The transition state is defined as the maximum on the minimum energy path linking reactants and the products. This point on the potential energy surface has the special property that ∂V(ri)/∂ri=0 (the gradient of the potential is zero), and the energy goes down most steeply along the minimum energy path linking reactants and products. Consequently, if one starts a trajectory exactly at the transition state, with no initial momentum, it will remain there forever. However, if one changes the geometry by a small amount in the direction of the products it will roll towards the products (and similarly for the reactants). One way of locating the transition state is to start trajectories near the transition state and see whether they "roll" towards the reactants or products.
The transition structure is a saddle point in the potential energy surface However the transition state can be distinguished from minima because if one starts a trajectory at the transition state with momentum towards a minima it will move towards either the reactants or products. Starting at the minima with a small amount of momentum will cause a small movement before rolling back down to the minima. The points can therefore be distinguished by examining the second derivatives. The transition state is a saddle point so the second derivatives will have component gradients with opposite signs; one negative, one positive. However global minima will have two positive second derivative components.
Mathematically the difference can be expressed in the following manner given that the two directions examined are q1 and q2 and the energy is defined by V. Global minima, maxima and saddle-points will share the property \frac{\partial V(q1)}{\partial q1}\frac{\partial V(q2)}{\partial q2}=0. However saddle-points are unique in having second derivative components with opposite signs such that: \frac{\partial V^2(q1)}{\partial q1^2} > 0 , and \frac{\partial V^2(q2)}{\partial q2^2} < 0
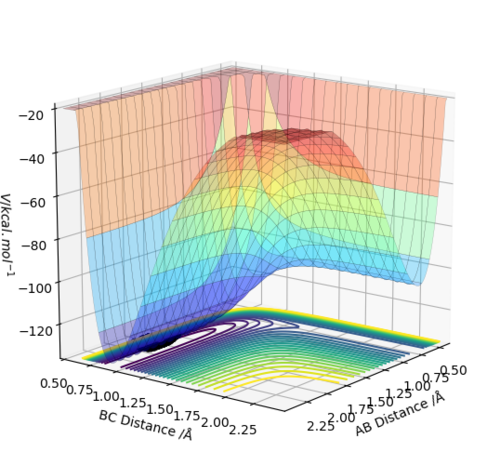
The transition energy (maxima This is not only a maxima, it is both maxima and a minima at the same time (depending on which direction you are looking at). This weird point is called a saddle point--Sw2711 (talk) 18:49, 15 May 2018 (BST)) and minima both have differentials equal to 0 (gradient is 0This part, fair.--Sw2711 (talk) 18:49, 15 May 2018 (BST)). The potential energy surface presents the minima and maxima by use of different curvature. The curvature is more at the maxima points and less at the minima points. For this part, I understand that is what you observed. But this is not the definition of min and max on the PE surface, if you see what I mean. But I think your observation is very cool. Have you thought about why it is like this? The curvature happens to be this way is because of the intrinsic chemical properties – check the Morse potential, then you draw millions of Morse potential at all distances for both AB and BC, combining with the activation energy for a reaction to occur, you will get an energy surface diagram as shown. --- Make sense? --Sw2711 (talk) 18:49, 15 May 2018 (BST) At the maxima the potential energy (y axis I think you mean z axis, the energy right? xy axes are AB/BC distances--Sw2711 (talk) 18:49, 15 May 2018 (BST)) is much higher than the potential energy at the minima, as shown in the image:
Furthermore, as indicated by the curvature of the lines, the maxima can be found as this is where the lines increase in curvature. I am not sure whether it is true. You can have a maxima, minima or a saddle point at different arbitrary curvatures. --Sw2711 (talk) 18:49, 15 May 2018 (BST)This also indicates that the potential energy is increasing. (Increase in curvature doesn’t indicate the potential energy is increasing. But if you argue that ‘This’ is the maxima, well, fair enough. But then it is not an indication. Maxima means Maximum energy, is that what you meant?--Sw2711 (talk) 18:49, 15 May 2018 (BST)The reverse can be applied for the minima (less curvature). Again, curvature has nothing to do with minima or maxima. Curvature doesn’t defined them. What you said here, is an observation just for this example.--Sw2711 (talk) 18:49, 15 May 2018 (BST) Sorry for being wordy. I just want to make sure that you understand this properly. What I am looking for here, is that you understand that TS is a saddle point (Please check the pringles TSsaddle.png ) – which means depending on which direction/plane you are looking at this point, it can either be a maxima or a minima. This is different from a local maxima or a local minima – whichever direction you look, it is always a max or a min. Then as you said, the gradient is 0 for max and min (and saddle point). How do you differentiate this? You use secondary partial derivatives. Please check the video link, if you want to learn further. So the TS, in your diagram, from your figure, we know it is a maxima. Then if you look at the plane of the xy diagnosis and z axis – you can see this is a minima on the potential energy surface. If you can’t see that, you can pop in another lab time, and ask one of the demonstrators. --Sw2711 (talk) 18:49, 15 May 2018 (BST)
Report your best estimate of the transition state position (rts) and explain your reasoning illustrating it with a “Internuclear Distances vs Time” plot for a relevant trajectory.
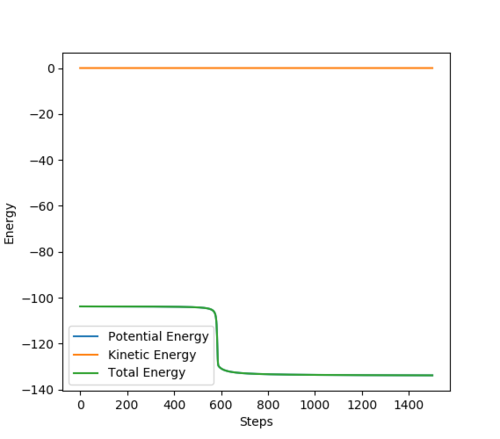
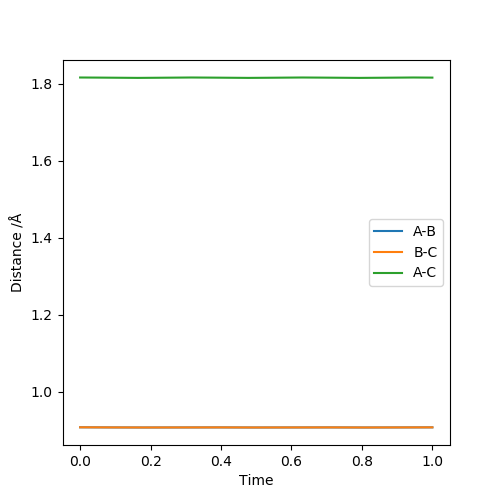
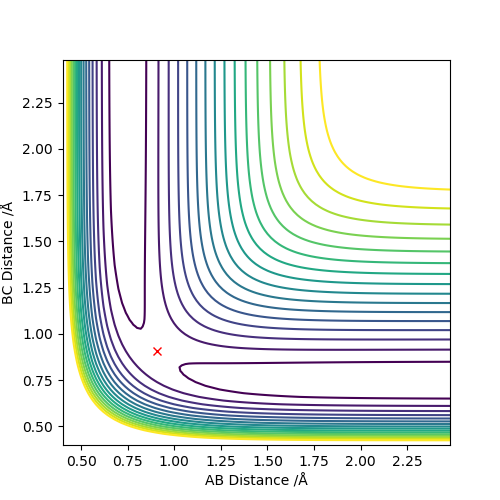
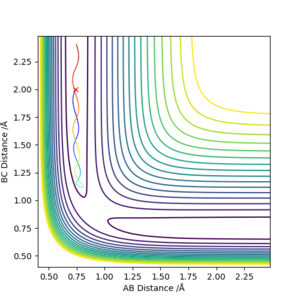
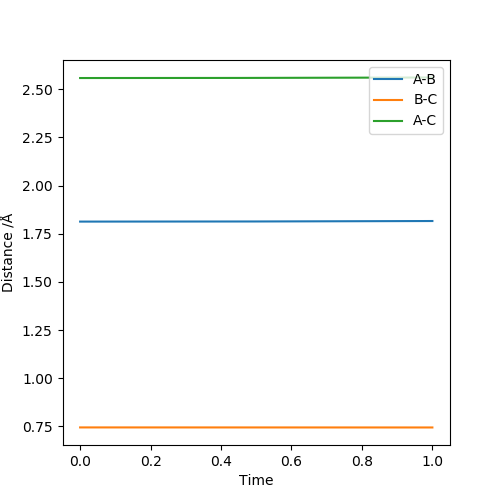
To two decimal places, the transition state positions for the two AB and BC are 0.908 angstrom. This is because on the contour plot, the trajectory is non-existent. As this is the transition state, one would expect as such, due to their being no momentum since there is no kinetic energy at the maximum.
This is supported by the internuclear distances vs time plot, which shows that the AB and BC distances are the same, which is what you should see at a transition state. They both oscillate but in phase.
Comment on how the mep and the trajectory you just calculated differ.
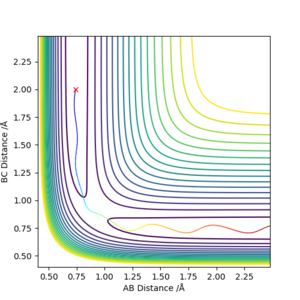
reaction path (minimum energy path or mep) The main difference between these two graphs is the velocity. In the first graph (MEP), the velocity is set to zero at each step, which is why it stops after the line/transition state trajectory reaches a minima. In the case of the dynamic graph, the trajectory continues on to infinity. Both these graphs show that if an infinitesimally small change is made in order to favour the product, then the transition state will 'fall' towards to products, trajectorially speaking and energetically speaking.
Complete the table above by adding the total energy, whether the trajectory is reactive or unreactive, and provide a plot of the trajectory and a small description for what happens along the trajectory. What can you conclude from the table?
State what are the main assumptions of Transition State Theory. Given the results you have obtained, how will Transition State Theory predictions for reaction rate values compare with experimental values?
1. The separation of electronic and nuclear motions occur, equivalent to the Born-Oppenheimer approximation.
2. The reactant molecules are distributed among their states in accordance with the Maxwell-Boltzmann distribution
3. Molecular systems that have crossed the transition state in the direction of products cannot turn around and reform reactants
4. In the transition state, motion along the reaction coordinate may be separated from the other motions and treated classically as a translation. There is the assumption that if the atoms or molecules don't collide with enough energy for the transition structure to be formed, then the reaction will not take place. This is the classical point of view because from a quantum mechanical point of view, tunneling can take place (with a finite possibility). This would mean in physical terms that the particles have a possibility of reacting without colliding with enough energy to overcome the energy barrier. Tunneling is a negligible effect for reactions with large activation energies, but becomes important for low energy barriers.
5. Even in the absence of an equilibrium between reactant and product molecules, the transition states that are becoming products are distributed among their states according to the Maxwell-Boltzmann laws.
(Ok, but most certainly your are quoting these from some reference, which should be cited and acknowledged. João (talk) 19:31, 15 May 2018 (BST))
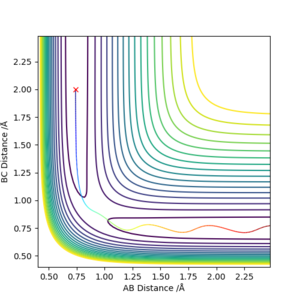
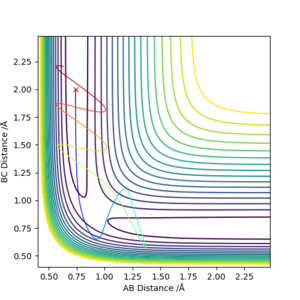
Transition state theory underestimates the rate of the reaction. There are two assumptions that have been made which go against what is viewed in the graphs above. The first discrepancy is the "Molecular systems that have crossed the transition state in the direction of products cannot turn around and reform reactants". As can be seen in the contour plot, the molecule will reach a transition state position, then either proceed onward to the products, or go back down to the reactants. This shows that even if the transition state is achieved, the products won't necessarily be formed. The second assumption which is an issue is that "in the transition state, motion along the reaction coordinate may be separated from the other motions and treated classically as a translation". As can be viewed in the surface plot, the transition state is rather low in energy, and so there is a low energy barrier. In these cases, the low energy barrier means that the quantity of tunneling that occurs is greater and therefore significant. Ignoring this means that the rate of reaction predicted by the transition state theory will be significantly lower than what it actually is.
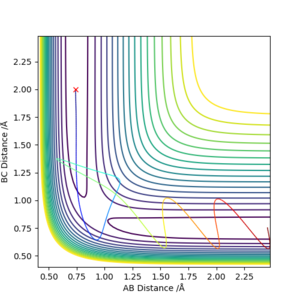
Transition state theory assumes that motion along the reaction path may be treated classically and has no normal components. The actual reaction path may not cross the minimum saddle point, this increases the effective activation energy. This can be seen in the contours above where vibrations of the product indicate the collision happened in an excited vibrational state; not at the minimum of the surface orthogonal to the reaction pathway on the energy surface. Applying this to a physical experiment, conditions required for reaction may be harsher than expected to compensate for the higher than predicted activation energy.
It is assumed that systems that have crossed the transition state potential may not recross it and reform the reactants. This is shown to be not true by reaction 4 where the reaction pathway is reversed after the transition state potential. In an experiment this effect may cause lower than expected yields of product.
Transition state theory is a relevant and wide used concept across many areas of chemistry. It is mainly based on four assumptions:
On the potential energy surface, the atomic motion can be described as obeying classical mechanics. (What are we missing by using Classical Mechanics? Je714 (talk) 16:30, 8 May 2017 (BST))
The transition state is contained in a "bottleneck" transition state region. Any reaction path that passes the energy barrier to reach the transition state must react to form the products and it cannot bounce back to reform the reactants. At the transition state, dynamic coupling will not take place between atomic motion and other degrees of freedom. However, many studies have been carried out on the subject to successfully disprove this theory. Their main focus was proving that reaction paths which cross the saddle point but then bounce back towards the reactants before crossing the transition state indefinitely to form the products do exist, even if at a higher energy cost hence a slower reaction rate. An example of this theory being broken via barrier recrossing is portrayed in figure 18.
Transition state theory (TST) aims to understand how chemical reactions take place by explaining the reaction rates of elementary chemical reactions. The transition state theory works because of assumptions. One of these being that there are no quantum effects and classical mechanics is applied. The TST assumes that unless molecules have enough energy to reach transition state, they will not react. Which means, as long as it has enough energy to reach TS, it will react. Compare to the five tests you did above, do you agree this assumption or not?--Sw2711 (talk) 19:23, 15 May 2018 (BST) Hence, TST does not take into account quantum-tunneling effects, which can cause a reaction to occur without atoms reaching transition state. The TST also assumes that the atoms in the reactant state have energies that are Boltzmann distributed. our system only has three atoms. Does Boltzman distribution apply?--Sw2711 (talk) 19:23, 15 May 2018 (BST)This is satisfied if the system has had enough time to calibrate. However, this is not the same in all cases.
Another assumption of TST is that the reactants, once past the energy maxima: the transition state, forms the products, and it cannot return to the reactants.
Overall, I think it is good effort here. You've read literature and attempted to explain based on your knowledge. You just need to sometimes think about in a more coherent way - how does it link to what I am doing.--Sw2711 (talk) 19:23, 15 May 2018 (BST)
Exercise 2: F - H - H system
By inspecting the potential energy surfaces, classify the F + H2 and H + HF reactions according to their energetics (endothermic or exothermic). How does this relate to the bond strength of the chemical species involved?
The conditions of this reaction is as follows:
H-F bond distance: 2 Å
H-H bond distance: 0.74 Å
H-F momentum: -0.5 kgms-1
H-H momentum: 2.90 kgms-1
The reaction is exothermic as the products are lower in energy than the reactants.

The conditions of this reaction is as follows:
H-H bond distance: 2 Å
H-F bond distance: 0.92 Å
H-H momentum: -0.5 kgms-1
H-F momentum: 2.55 kgms-1
The reaction is endothermic as the reactants are lower in energy than the products.
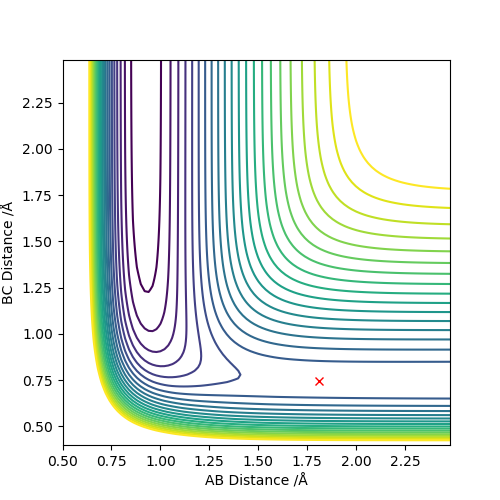
Locate the approximate position of the transition state.
F-H 1.810 Å
H-H 0.746 Å
This is the approximate position of the transition state as in the contour graph below there is only one point and no trajectory.
Report the activation energy for both reactions.
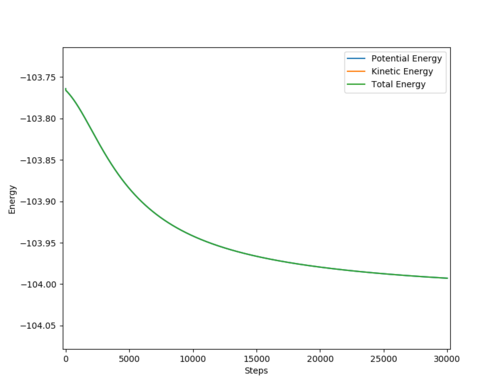
TS energy: - 103.753
F + H2 model
Activation energy = -103.753 - (-103.992) = +0.239 kcal/mol
HF + H model
Activation energy = -103.753 - (-133.580) = +29.827 kcal/mol
