MRD:1905
EXERCISE 1
Ng611 (talk) 11:47, 22 May 2019 (BST) This was a disappointing report. Your answers were too short, lacking in detail, and failed to demonstrate a grasp of the subject matter. Many of your answers didn't even address the question asked. A great deal of improvement is needed.
Transition States
On a potential surface energy diagram, how is the transition state mathematically defined?
The transition state is a point on the potential surface energy diagram where the gradient of the potential is zero, i.e. ∂V(ri)/∂ri=0.
How can the transition state be identified, and how can it be distinguished from a local minimum of the potential energy surface?
Ng611 (talk) 11:34, 22 May 2019 (BST) This is not nearly enough detail here. How do you distinguish a TS from a local minimum/maximum (they'd also give a first derivative of 0). What directions are you taking your derivatives along?
Trajectories from r1 = r2: locating the transition state
Report your best estimate of the transition state position (rts) and explain your reasoning illustrating it with a “Internuclear Distances vs Time” plot for a relevant trajectory.
My best estimate of the transition state position (rts) is 0.90774 Å.
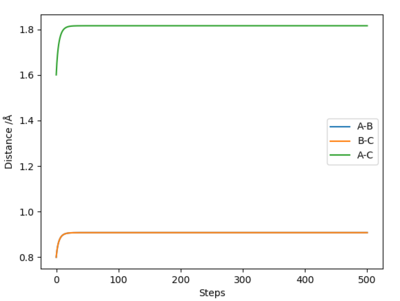
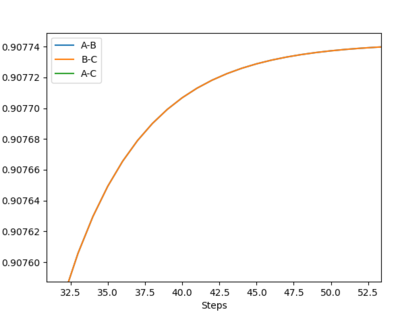
The reason for this estimate is because the transition state position is the position at which the internuclear distances between atoms A and B and B and C are equal, and their momenta are equal, i.e. 0, and there is no resultant movement between the atoms. Using the lepsgui.py programme, the internuclear distance at which there is no visible movement was estimated to be ~0.908 Å.
Ng611 (talk) 11:38, 22 May 2019 (BST) How did you find this point? Did you do a dynamics simulation, or use an MEP calculation. How did you confirm this was the saddle point? You said you found the point at which there was no visible movement, could you provide some evidence to demonstrate that there is no movement?
Trajectories from r1 = rts+δ, r2 = rts
Comment on how the mep and the trajectory you just calculated differ.
Using the Intermolecular distances vs Time graphs to compare:
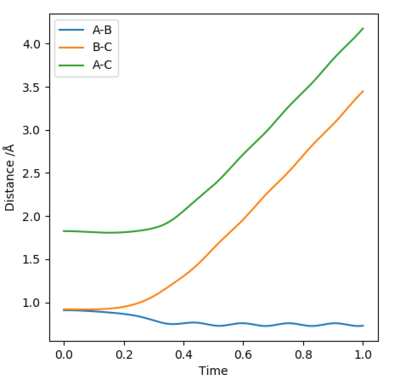
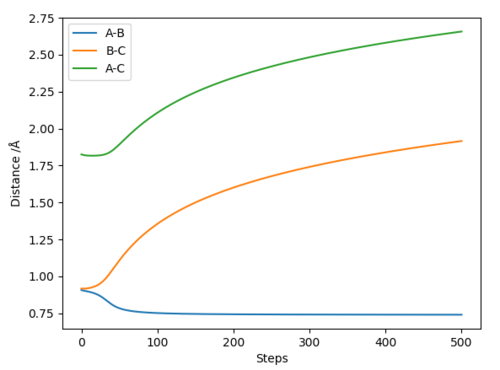
The distance between atoms A and B become constant, indicating that they have become a molecule, while the distances between atoms A and C, as well as atoms B and C, have increased, indicating that C is moving away from both A and B. These two facts are shown by both graphs. Using calculation type = minimum energy path (MEP), this finds the nearest possible region where the gradient of the potential is 0.The graph relating to MEP has a line corresponding to A and B that falls to a a horizontal constant line, which states that in the minimum energy path, the molecule AB has no vibrational energy. This is because at each step, as the atom/molecule falls along the potential energy surface, it does not recall its initial momentum at each step, therefore reaches a standstill at the nearest flat surface, where the gradient of the potential is 0. Using calculation type = Dynamics, the line corresponding to A and B's internuclear distance has a trajectory that's slightly wavy, indicating that the molecule AB has vibrational energy, and this is because as the atom/molecule falls along the potential surface at each step, it continues with its initial momementum.
Ng611 (talk) 11:38, 22 May 2019 (BST) Good!
Reactive and unreactive trajectories
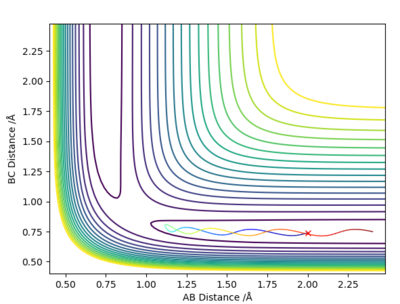
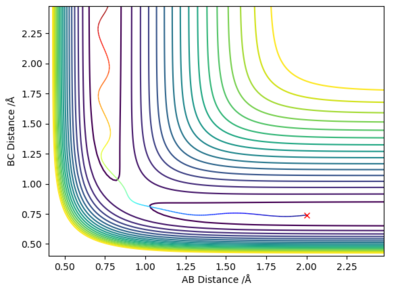
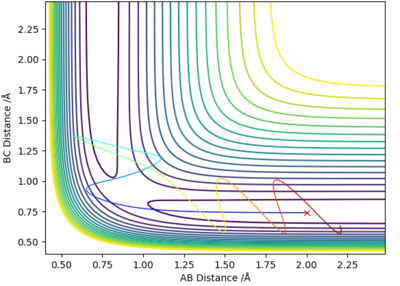
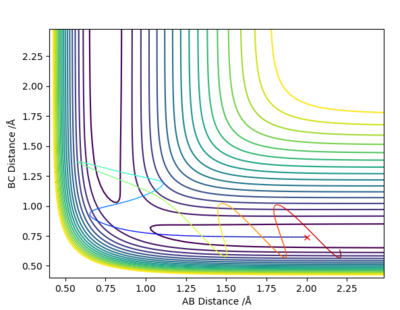
Complete the table above by adding the total energy, whether the trajectory is reactive or unreactive, and provide a plot of the trajectory and a small description for what happens along the trajectory. What can you conclude from the table?
| p1 | p2 | Etot | Reactive? | Description of the dynamics |
|---|---|---|---|---|
| -1.25 | -2.5 | -99.018 | Yes | Reactant molecule BC collides with atom A, they have enough energy to form product molecule AB and atom C; reactant BC had no vibrational energy, but product AB has vibrational energy. |
| -1.5 | -2.0 | -100.456 | No | Atom A doesn't have enough energy to collide with molecule BC; no reaction occurs and molecule BC possesses vibrational energy. |
| -1.5 | -2.5 | -98.956 | Yes | Atom A collides with reactant molecule BC, they have enough energy to form product molecule AB and atom C; reactant BC had little vibrational energy, but product AB has more vibrational energy. |
| -2.5 | -5.0 | -84.956 | Yes | Atom A collides with reactant molecule BC, they have enough energy to form product molecule AB and atom C; however product AB vibrates and collides with atom C, reforming reactants: molecule BC and atom A. |
| -2.5 | -5.2 | -83.416 | Yes | Atom A collides with reactant molecule BC, they have enough energy to form product molecule AB and atom C; however reactants are immediately reformed, then BC collides with A again to form AB and C. |

State what are the main assumptions of Transition State Theory. Given the results you have obtained, how will Transition State Theory predictions for reaction rate values compare with experimental values?
The transition-state theory attempts to provide a more accurate picture of what happens during a reaction as compared to the Arrhenius equations as well as the collision theory. [1] According to the transition-state theory, there is a state called the transition state where the reactants are combined in a species called the activated complex. [1] The theory proposes that there are 3 significant factors that will determine whether or not a reaction will occur: (A)-the concentration of the activated complex, (B)-the rate at which the activated complex breaks apart, and (C)-the way in which the activated complex breaks apart; whether it reforms the reactants or a new complex, the products. [1]
Ng611 (talk) 11:40, 22 May 2019 (BST) You've provided a description of TS theory, but you've not outlined the main assumptions. What are the main assumptions here? How accurate are they given your simulations?
EXERCISE 2
PES Inspection
By inspecting the potential energy surfaces, classify the F + H2 and H + HF reactions according to their energetics (endothermic or exothermic). How does this relate to the bond strength of the chemical species involved?
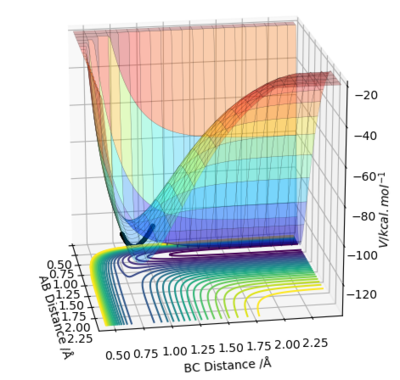
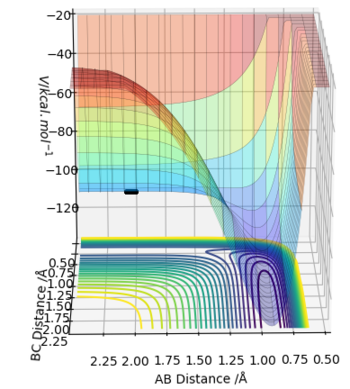
The potential energy surface diagram of F + H2 shows the path of the reaction going from a higher energy minimum to a lower energy minimum, indicating that the products are at a lower energy than the reactants, which therefore corresponds to an exothermic reaction.
The potential energy surface diagram of H + HF shows the path of the reaction going from a lower energy minimum reaction to a higher energy minimum, indicating that the reactants are at a lower energy than the products, which therefore corresponds to an endothermic reaction.
Energy is taken in to break bonds, and energy is given out to make bonds. When the energy taken in is greater than the energy given out, this results in an endothermic reaction, and the opposite leads to an exothermic one. With F + H2, it's exothermic, which means that the bond formed (i.e. H-F) has a greater bond enthalpy than H2. With H + HF, it's endothermic, which suggests that the bond formed (i.e. H-H) has a lower bond enthalpy than the bond broken (i.e. H-F).
Locate the approximate position of the transition state.
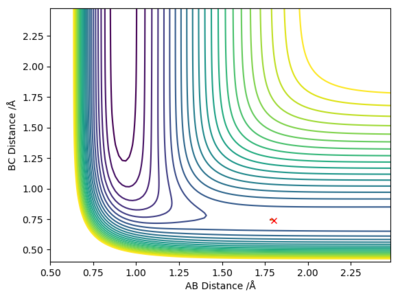
The above contour plot shows that the transition state position for the reactions F + H2 and H + HF is at approximately 0.74 Å.
Report the activation energy for both reactions.
Using the potential energy surface plot as previously shown above, the activation energy for the F + H2 reaction is ~128.896 kcal mol1, while the the activation energy for the H + HF reaction is ~116.407 kcal mol1.
Ng611 (talk) 11:43, 22 May 2019 (BST) Why is the activation energy for the F+H2 reaction higher than for the H+HF? Does this make any sense at all?
Reaction dynamics
In light of the fact that energy is conserved, discuss the mechanism of release of the reaction energy. Explain how this could be confirmed experimentally.
The initial conditions used were: H1-H2 distance = 0.74 Å, H1-F distance = 1.3 Å, and initial momentum for both species = 0. Since energy is conserved, the energy given out when the H-F bond forms helps break the H-H bond, which takes energy in. Because H-F has a higher bond enthalpy than H-H, the leftover energy is converted to vibrational energy of the H-F molecule, allowing it to vibrate after the reaction is complete.
Ng611 (talk) 11:42, 22 May 2019 (BST) How could you confirm this experimentally?
Discuss how the distribution of energy between different modes (translation and vibration) affect the efficiency of the reaction, and how this is influenced by the position of the transition state.
Using the H + HF reaction, the initial conditions were set as: H-F distance = 0.91 Å, H-H distance = 1.5 Å, pHF = 5 and pHH = -5. At these conditions, the momentum of both reactants was enough to cause a collision, however the collision did not have enough energy for the reactants to turn into products. As the momentum of H was decreased and the momentum of HF was increased, the possibility of conversion into products was increasingly likely, when at pHF = 9 and pH = -1, the reactants turn into products, i.e. H-F breaks and H-H forms.
Increasing the vibrational energy of H-F apparently seems to increase the possibility of the reaction occurring, which indicates that if there is a distribution of energy over reactants leans towards giving the vibrational mode a higher amount, this would increase the efficiency of the reaction.
The transition state position can very easily influence the results of reactions; for example if the position of the TS was moved, even by a tiny amount, towards the direction of the products, this would lead to the products forming. Similarly, if the TS position was moved closer to the reactants, this would mean that the reactants would reform from the activated complex rather than the products.
Ng611 (talk) 11:41, 22 May 2019 (BST) You need to provide trajectories as examples
