MRD:10969OOR
Molecular Reaction Dynamics: Applications to Triatomic systems
Introduction
The experiment is to analyze reactivity and to locate transition states of a triatomic system mainly by looking at the potential surface plots and internuclear distance vs time plots drawn by Matlab. A H-H-H and a H-H-F/F-H-H systems are studied in this experiment. A potential energy surface represents the energy of a system as a function of atoms' relative position. In the surface plot, the trajectories represent a path cross the potential surface.Moreover, the trajectories help to visualize the reaction pathway and reactivity. Based on Hammond postulate, locations of transition states and activation energies are found for various systems. Transition State theory is also discussed in this experiment for example, once the system reaches the transition states with sufficient energy then the products can form. The experiment also investigates about Polanyi's empirical rules as different transition states positions will have different translational and vibrational modes in the energy distribution, which directly affect the efficiency of the reaction.
H + H2 system
Dynamics from the transition state region
- The total gradient of the potential energy surface at a minimum and at a transition structure is 0. The transition state is the maximum position on the minimum energy path, the minimum is at the lowest position on the potential energy curve therefore gradients at the transition state and at the minimum are both zero.(first derivative=0) However, minima and transition states can be distinguished by working out second derivatives at each point as transition states have second derivatives less than zero and the minima have second derivatives greater than zero.
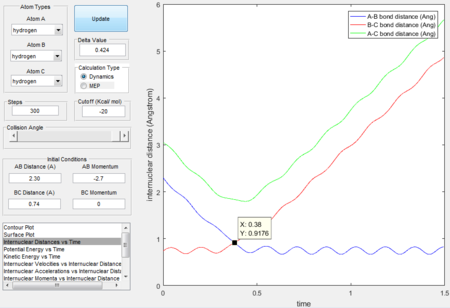
- Because at the transition state of the reaction, r1 = r2, therefore distance can be first roughly estimated by finding the intersection(rts = 0.9176 Å, t = 0.38 s) in the Figure 1 and then by testing conditions at around rts=0.91 Å, p=0 N/s, the best estimate(rts = 0.908 Å) is obtained until the internuclear distance vs time graph shows straight lines as molecules at the transition state have almost no vibrational energy.
 |
 |
Comparing MEP and Dynamics calculation types
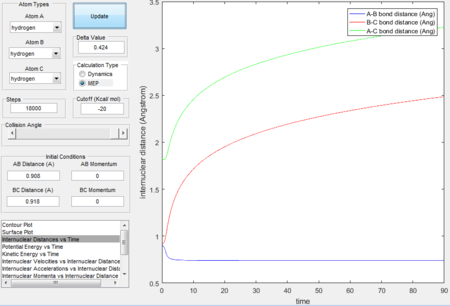
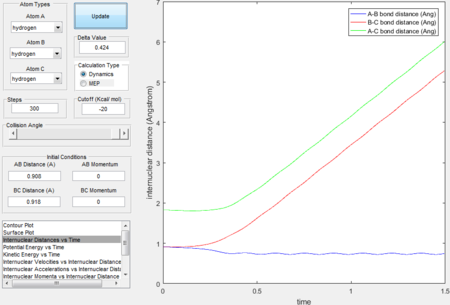
- Initial conditions are set to be r1 = rts + 0.01 = 0.918 Å, r2 = rts, initial momenta p1= p2
 |
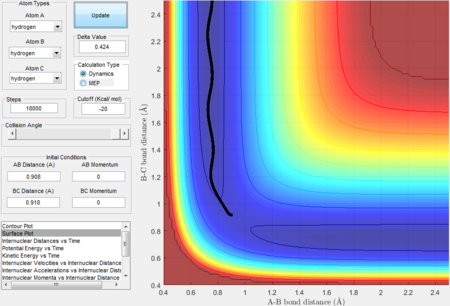 |
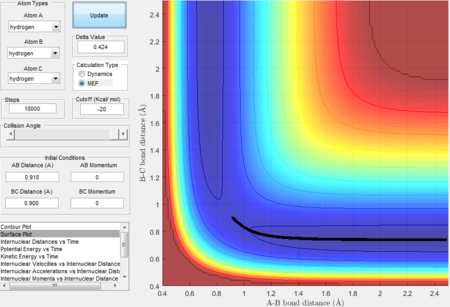
- Graphs obtained by MEP calculation type generally have smooth curves, which is because MEP calculation sets the velocity to zero in each time step therefore atoms moves in an infinitely slow motion. Dynamics calculation type takes the realistic motions of atoms into account thus the fluctuated curves and trajectories imply the consideration of vibrational motions.
 |
 |
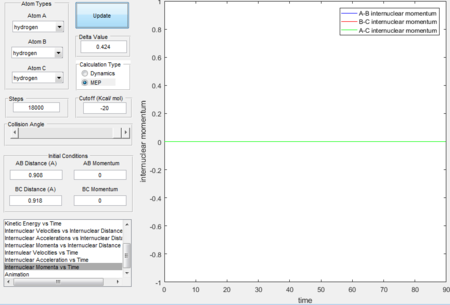 |
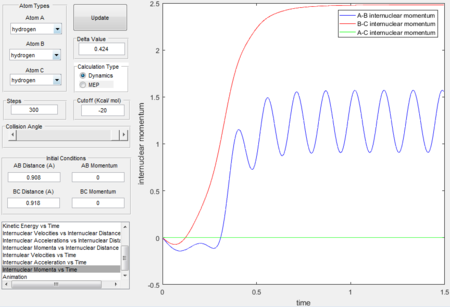 |
- Initial conditions are set to be r2 = rts + 0.01 = 0.918, r1 = rts, initial momenta p1= p2.
 |
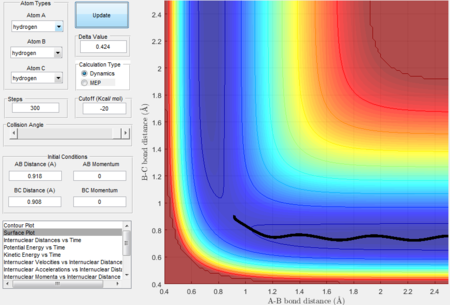 |
Because now r2 is greater than r1 therefore the trajectory in the surface plot passes through the entrance channel(reactant side).
Reactive and unreactive trajectories
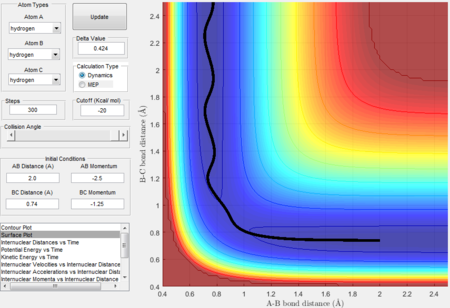
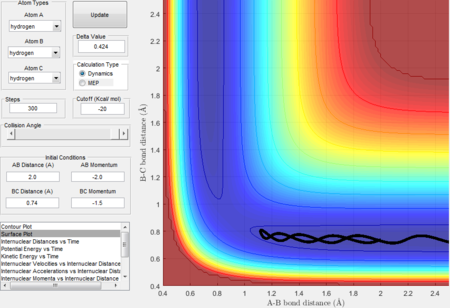
- Five trajectories with the same initial positions (r1=0.74 and r2= 2.0) but with different combinations of momenta were tested to see if they have enough kinetic energy to overcome the activation barrier. In the potential energy surface plot of a reactive trajectory, wavy lines should appear in exit channels.
| Trajectory | p1 | p2 | Reactivity |
|---|---|---|---|
| 1 | -1.25 | -2.5 | Reactive |
| 2 | -1.5 | -2.0 | Unreactive |
| 3 | -1.5 | -2.5 | Reactive |
| 4 | -2.5 | -5.0 | unreactive |
| 5 | -2.5 | -5.2 | reactive |
Trajectory 1---reactive
 |
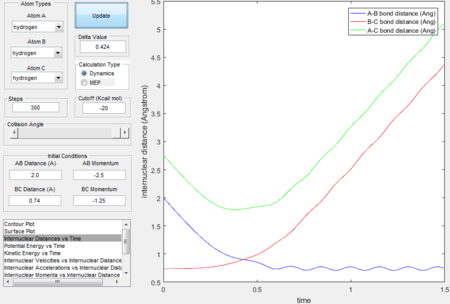 |
- The trajectory is reactive.
- The decreasing A-B bond distance indicates that HA approaches HB-HC. The increasing B-C bond distance and the wavy line in the exit channel indicate the formation of HA-HB and this also proves that the reaction has enough kinetic energy to surmount the energy barrier.
- The intersection between A-B bond and B-C bond curves in the Figure 12 indicate the formation of transition state.
Trajectory 2---unreactive
 |
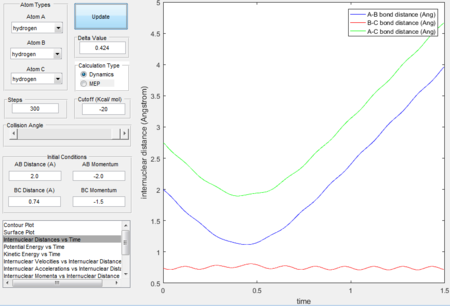 |
- The trajectory is unreactive.
- The decrease in the first half of the A-B bond distance curve in the Internuclear distance vs time plot illustrates the fact that HA approaches HB-HC but the increasing second half of the A-B bond distance curve shows that Atom A bounces back. The trajectory bounces back to the entrance channel in the surface plot indicates that the reaction does not have enough kinetic energy to surmount the energy barrier.
Trajectory 3---reactive
 |
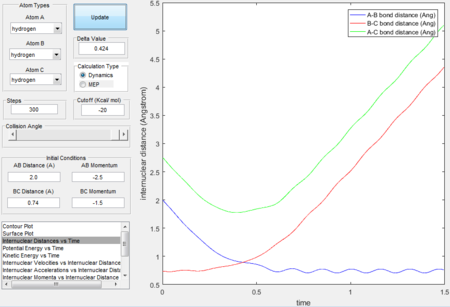 |
- The trajectory is reactive.
- The surface plot and intermolecular distance vs time plot for this trajectory has a similar shape as the trajectory 1. The progressing wavy line in the exit channel proves that the reaction has enough kinetic energy to overcome the energy barrier.
Trajectory 4---unreactive
 |
 |
- The trajectory is unreactive.
- The two intersections in the exit and entrance channel indicates that the transition states formed twice during the reaction. Though P2 is given enough momentum to collide with B-C and the reaction has enough kinetic energy to overcome the barrier after forming the first transition state, the energy is not in the right vibrational modes at the right time thus the trajectory is bounced off to the entrance channel. The excess momenta of Atom A allows Atom A to attempt to form the second transition state but then the reaction has not enough energy to overcome the kinetic barrier.
- Some of the translational energy of Atom A converts to the vibrational energy of B-C thus the trajectory shows a wavy line after bouncing back to entrance channel.
Trajectory 5---reactive
 |
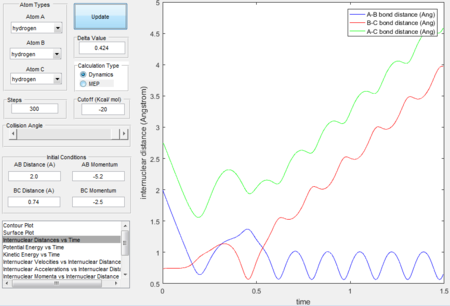 |
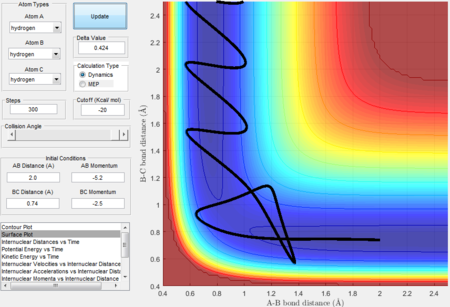
- The trajectory is reactive.
- The three intersections in the internucleara distance vs time graph indicates that the transition states formed three times in the reaction and eventually formed the product.
- As P2 is given the highest momenta among all 5 trajectories therefore HA-HB has the highest vibrational energy and the oscillating curve in the exit channel proves that the reaction has enough kinetic energy to surmount the barrier.
Transition State Theory
Assumptions
- Reactants and transition states have a Boltzmann distribution of energy in every degree of freedom.[1]
- Atoms follow newton's laws and molecular vibrations are quantized or quantum tunneling effects are neglected.[2]
- The system reaches the transition state only once in the reaction process.
- TST assumes that a trajectory that reaches the transition state in the direction from reactants to products is a reactive trajectory and once the trajectory passes the transition state, it is almost impossible to find the way back to reactants.
- Conventional TST locates the transition state at the saddle point and all vibrations and rotations about the saddle point are out consideration.
Compare with experimental values
- In reality, trajectories may reach the transition states for several times before ultimately forming the product and these are counted in TST. As a result, TST often overestimates reaction rates.[3]
- Rate constants calculated without tunneling usually underestimate the exact rate constants at low temperature.
F-H-H System
PES inspection
F + H2
- reaction profile
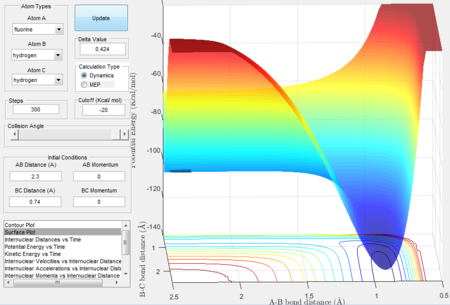
F + H2 is an exothermic reaction. Because in the surface plot,the entrance channel(reactants) has a higher surface potential energy comparing to the products as H-F bond is stronger than H-H bond therefore heat energy is released in the reaction.
- the transition state location

According to Hammond postulate, the transition state resembles the structure of species neighboring it along the reaction coordinate thus in an exothermic reaction, the transition state is close in energy to the reactants. The transition state location on the potential surface can be found close to the reactants. The transition state is found when rAB = 1.81 Å, rBC = 0.745 Å, momentum = 0.
- calculating activation energy
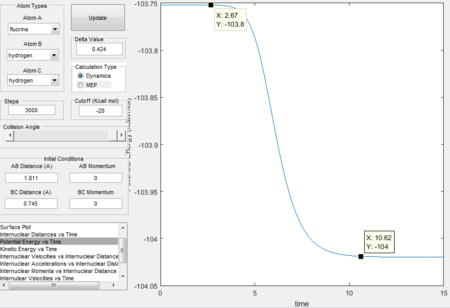
The activation energy for this reaction is the energy difference between the reactants and transition states, which is 0.2 Kcal/mol.
H + HF
- reaction profile

H + HF is an endothermic reaction. Because the entrance channel(reactants) has a lower surface potential energy comparing to the products. As H-F bond is much stronger than H-H bond therefore breaking H-F bond intakes heat energy. In an endothermic reaction pathway, the transition state resembles products more than the reactants.
- the transition state location
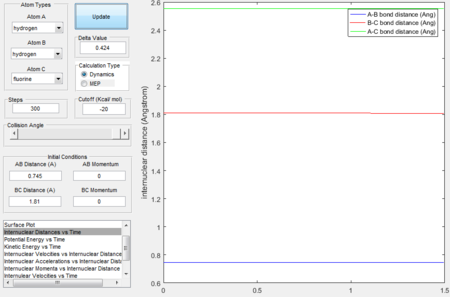
- calculating activation energy
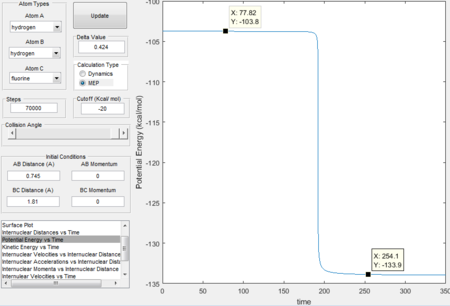
The activation energy for this reaction is the energy difference between the reactants and transition states, which is 30.1 Kcal/mol.
Reaction dynamics
mechanism of release of the reaction energy
 |
 |
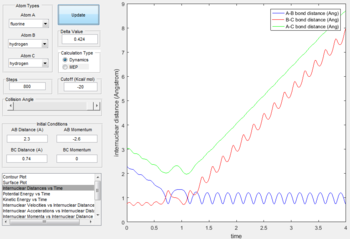 |
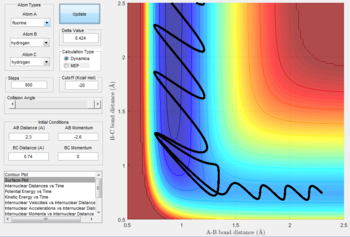
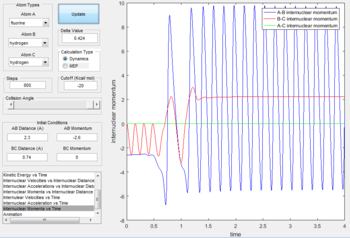
- The initial conditions are set as: rAB= 2.3 Å, rBC= 0.74 Å, pAB= -2.6 N/s,pBC= 0 N/s.
- F + H2 is a two-step reaction. In the first step, distance between H and F decreases as F atom approaches H atom. After forming the first transition state, the reaction fails to overcome the kinetic energy barrier thus the distance between H atoms increases slightly. The second transition state is reached as the F atom attack the H atom again. The A-B curve in the internuclear momenta vs time oscillates at a very high amplitude indicates that the formation of H-F bond is exothermic and the released heat energy converts to the vibrational energy of H-F bond.
- This can be confirmed by infrared chemiluminescence and calorimetry. Because the reaction is exothermic therefore it can be followed by the raising of the temperature.(Q = mcΔt, where Q is the heat released, c is the specific heat capacity and Δt is the changes in temperature.)
- As the reaction is exothermic, the released heat converts to vibrational energy and excites products. Infrared chemiluminescence can be used to measure the emission of the infrared photons from vibrationally excited products. The intensity in the chemiluminescence spectroscopy can distinguish between attractive and repulsive potential surfaces. The reaction with attractive potential surface proceeds more efficiently when the energy is mostly translational energy and the reaction with repulsive potential surface proceeds more efficiently when the energy is as vibrations.[4]
(In what form of energy is the "heat" stored?Lt912 (talk) 03:53, 2 June 2017 (BST))
Polanyi's empirical rules
 |
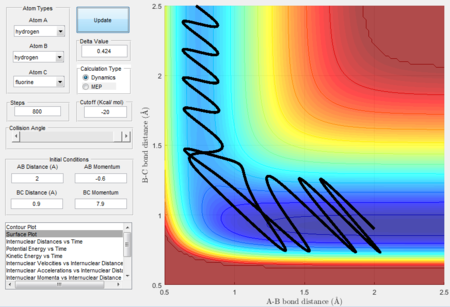 |
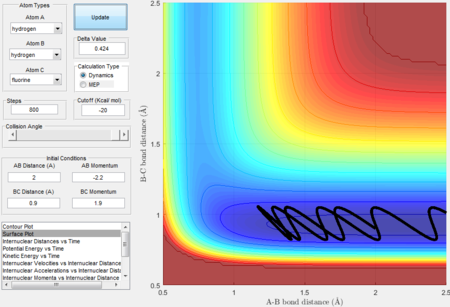
initial conditions for unreactice H + HF: rAB= 2 Å, rBC= 0.9 Å, pAB= -2.2 N/s,pBC= 1.9 N/s. initial conditions for reactice H + HF: rAB= 2 Å, rBC= 0.9 Å, pAB= -0.6 N/s,pBC= 7.9 N/s.
The Polanyi's empirical rules, which state that the vibrational energy contributes more in a late barrier reaction than the translational energy. [5] The endothermic reaction is a late barrier reaction as the transition state resemble more from the products than reactants thus a system has a higher vibrational energy will have a higher possibility to overcome the transition barrier. H + H-F is an endothermic reaction. It is clear that the system in the Figure 30 has a higher translational energy and lower vibrational energy than in the Figure 31 therefore higher the vibrational energy in the Figure 31, more contribution for the reaction to surmount the barrier.
Conclusion
The surface plots can be used to identify the transition sates and reactivity. The trajectory travels from the entrance channel to the exit channel on the surface plot implies that the reaction is reactive. Otherwise, if the trajectory stops before travelling into the exit channel, the reaction is unreactive. Transition State theory and Hammond Postulate help to identify transition states location and reaction pathway. In this experiment, it was proved that F + H-H reaction is exothermic and its reverse reaction (H + H-F) is endothermic, which has an higher activation energy. Polanyi's empirical rules can be illustrated by Figure 30 and 31, as vibrational energy is more efficient in promoting for a late barrier(endothermic) reaction than translational energy.
