MRD:01576020
Molecular reaction Dynamics Lab Report
Introduction
Modelling the dynamics of molecular reactions has been enabled by the emergence of computers and the field of computational chemistry is an ever-expanding field. Despite most approaches being purely theoretical, ab initio, calculations, the insight given is invaluable for understanding the pathways of chemical reactions. It is often also not necessary to include quantum mechanics, as atoms are of sufficient mass to be reasonably accurately modelled by Newton's equations of motion. Isolated systems in the gas phase only experience interatomic interactions which can be represented by a potential energy surface (PES) which is a function only of atomic positions. The force on a given interatomic coordinate can be calculated as follows:
where F =
Calculating the forces and adjusting the system in consecutive steps results in a trajectory which shows how a system evolves in time. Such calculations have almost endless application from chemical biology and medicine[1] to materials science[2].
It is worth mentioning some main aspects about the transition state (TS) theory here as it is central to the concepts used here. It is purely classical - it ignores any quantum mechanical effects such as tunnelling, which is incredibly small anyway. It also assumes that the transition state structure is in equilibrium with the reactants, which is called a quasi-equilibrium. TS theory also assumes that the reactants have energies which follow a Boltzmann distribution, which is not a bad assumption as long as the system has had time to equilibrate. This assumption, however is not very applicable to the system studied here. Another crucial assumption of the TS theory, developed in the 1930s, is that once the TS is surpassed, the products will necessarily be formed, which was not the case in some simulations performed here. This latter assumption is also the reason why theoretically derived reaction rates using the TS state theory overestimate experimentally obtained reaction rates. This can be improved by adding a correcting factor, but to do that one must already have extensive knowledge of the system in question. The TS is defined as the maximum on the minimum energy path going from reactants to products. This is called a saddle point and the net force on the system is 0.[3][4]
We will deal here with triatomic linear systems, as depicted in the following Figure 1.

Terms like reactive and unreactive trajectories will be used often. A reactive trajectory is one which leads the reaction to completeness, i. e. the products are formed. In contrast an unreactive trajectory will not form products. The work here is divided into two exercises. Questions from the script are coloured blue for clarity and the answers follow below.
EXERCISE 1
Dynamics from the TS region
On a potential energy surface diagram, how is the transition state mathematically defined? How can the transition state be identified, and how can it be distinguished from a local minimum of the potential energy surface?
Good but your mathematical definition for the TS is unclear. Also, the derivatives are partial derivatives Sf3014 (talk) 15:40, 24 May 2020 (BST)
Report your best estimate of the transition state position (rts) and explain your reasoning illustrating it with a “Internuclear Distances vs Time” plot for a relevant trajectory.
The minimum of this curve is the maximum of the lowest energy path. Since the gradient is zero at that point, there should be no movement of our system if the initial structure corresponds to the TS structure. By changing the initial internuclear distances, we can indentify the TS as the distance where the internuclear distances are constant throughout the simulation.


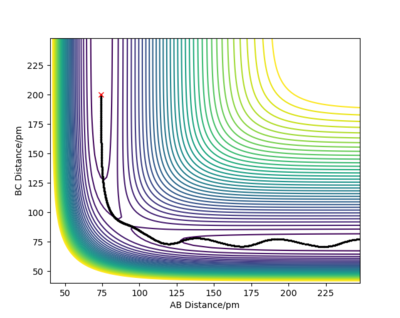
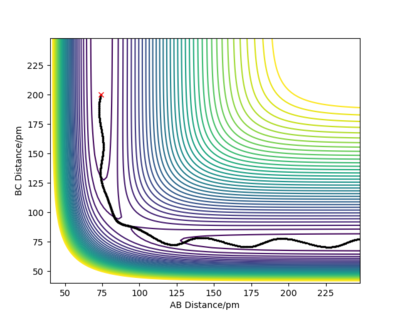
We can see that in cases (a) and (c) there were oscillations of the atoms present so the net force on the system was not 0, which means that these are not transition state structures. But looking at these two graphs more thoroughly, we can see that the oscillations began in opposite directions. In case (a) the initial distance was elongated at first, meaning that there was a repulsive force between the atoms and that in the TS the atoms are separated by more than 90 pm. Conversely, in case (c), the distance between atoms was shortened at first, denoting attraction between atoms. We know that the transition state structure will be between these two. There are no noticeable oscillations in case (b), suggesting that the distance between the atoms in the transition state structure will be in close proximity to 90.8 pm.
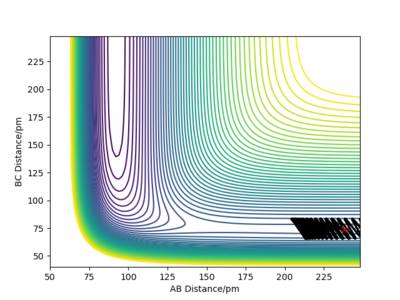
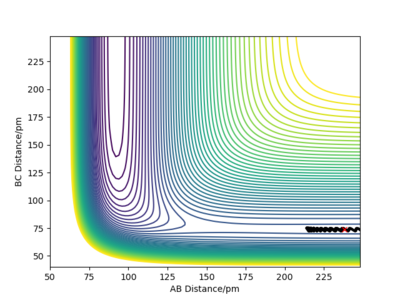
But we can get a more accurate value now that we know where to look for the transition state. With some interval bisection, our best estimate for the transition state is rTS = 90.775 pm. And most importantly, the forces on this initial geometry are -0.000 kJ/mol.pm along AB and -0.000 kJ/mol.pm along BC so this is the actual saddle point. Of course this is only true for our accuracy, there may be additional decimal points which are not 0. But force fields are not without errors either and such a system would be experimentally almost impossible to construct and study anyway so it makes no sense to improve the precision any further.
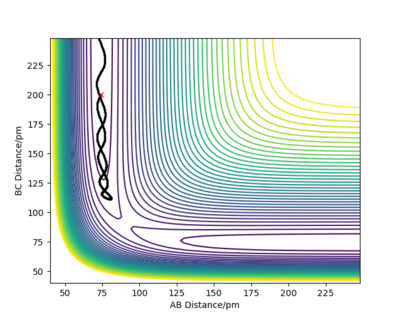
The plot on the right confirms that the chosen rTS is correct, since the system did not roll into either of the valleys even in a long simulation.
Very good. For more clarity, you should refer to "(a) and (c)" as fig. 3(a) and (c) Sf3014 (talk) 15:46, 24 May 2020 (BST)
Dynamics vs. MEP
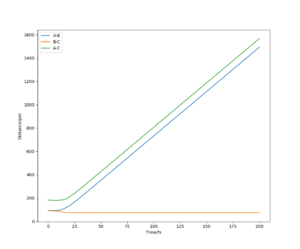
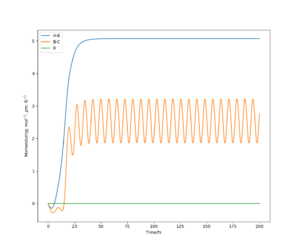
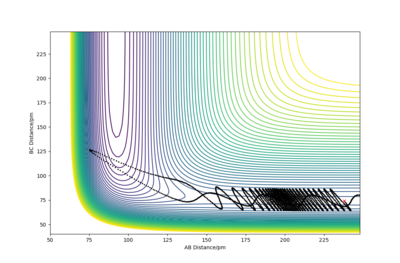
Using the initial conditions r1=rts and r2=rts+1, the system would roll into the other valley on the PES with similar behaviour to what is described in the figures on the left and right.
If we start another simulation, where the initial positions are the same as the final positions of the previous calculation, and we set the initial momenta to be the inverse of the final momenta, the new simulation will almost reach the transition state and then roll back through the valley. The reason that it does not reach the transition state is that we started slightly off the transition state structure in the previous calculation since otherwise our system would just stay at the transition state. Our first simulation started off with 0 momentum, and only had potential energy as it was very close to the saddle point. During the simulation the potential energy was transformed into kinetic energy (translational and vibrational). We then took this kinetic energy and started transforming it into potential energy again. Since no energy was lost or gained, we reached the exact same point as we started off and then, depending on the length of simulation, the system may roll down the valley again. It will not turn back however, unless we manually revert momenta again.
If we use these initial conditions and run a MEP simulation, the first step will go back uphill, but then as the momenta are set to 0 and new momenta are calculated from the PES, the system will roll back downhill so the initial point of the previous simulation will not be reached.
Good but show that the momenta is set to zero using the mep calculation. Your evidence doesn't support your discussion because you don't show any plots for the mep calculation.Also, fig. 5 is to small to see the BC vibrations mentioned in the caption. Sf3014 (talk) 15:55, 24 May 2020 (BST)
Reactive and Unreactive Trajectories
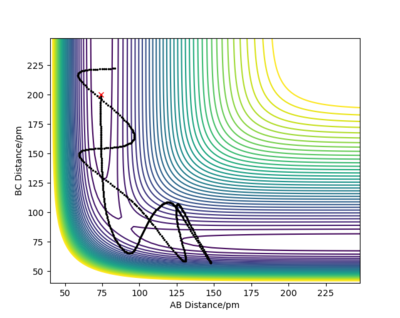
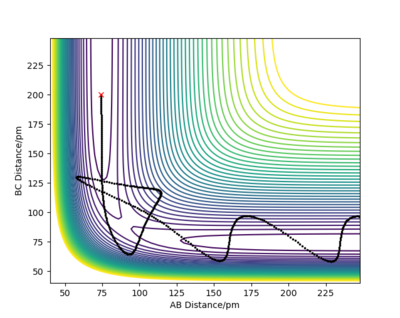
Complete the table above by adding the total energy, whether the trajectory is reactive or unreactive, and provide a plot of the trajectory and a small description for what happens along the trajectory. What can you conclude from the table?
In contrast to one of the assumptions of the transition state theory, it is obvious from the table that even if the system has sufficient energy to surpass the kinetic barrier, this is not a guarantee that the reaction will proceed as expected. There is also no general way to determine a reactive trajectory. This is influenced by many factors. There were significant vibrations present in the product molecule, which is a result of conservation of energy and the fact that the reaction is exothermic.
Good layout in table but descriptions on the trajectories are very confusing (note the trajectories show the approach of an atom towards a molecule) and your lack of mention on the approach of the atom to the molecule shows some misunderstanding by you. Clarity needed, there is some mention of fluorine but from the look of the potential energy line spacing on your trajectory plots it looks like the H-H-H system which is the system you should be referring to based on your lab script. Sf3014 (talk) 16:15, 24 May 2020 (BST)
Given the results you have obtained, how will Transition State Theory predictions for reaction rate values compare with experimental values?
As mentioned in the introduction, one of the assumptions of transition state theory is that, once the transition state is surpassed, the system will in all cases end up in the products state. This assumption may cause some discrepancies between theoretical and experimental findings. As we have seen in some cases, even if the saddle point is reached and the system finds itself in the valley of the products, it can end up in the valley of the reactants again, which means that not in all cases does the system reach the products even if it had sufficient energy to overcome the activation energy. The transition state theory therefore overestimates the reaction rate.
Very good description and link to your introduction. Sf3014 (talk) 16:15, 24 May 2020 (BST)
EXERCISE 2
PES inspection
By inspecting the potential energy surfaces, classify the F + H2 and H + HF reactions according to their energetics (endothermic or exothermic). How does this relate to the bond strength of the chemical species involved?Locate the approximate position of the transition state.

The F + H2 --> HF + H reaction is exothermic and H + HF --> H2 + F is endothermic. This means that the HF molecule is more stable than the H2 molecule. This also means that the H-F bond is stronger than the H-H bond. This makes sense as the former has a significant ionic contribution, whereas the H-H bond is purely covalent. This nature is also reflected in the activation energies of the two reactions and the bond dissociation energies. The transition state structure is approximately: AB = 74.478 pm and BC = 181.455 pm, where C is a fluorine atom. For these initial conditions, the forces were: along AB: 0.000 kJ.mol-1.pm-1 and along BC: 0.001 kJ.mol-1.pm-1. Due to these minimum forces, this structure is very close to the TS structure. One can notice that the distance between the H atoms in the TS structure is very close to their bond distance. This phenomenon is expressed in Hammond's postulate which says that the TS structure will resemble that of the species close to it in energy. Since this reaction is very exothermic, the TS structure is close to the structure of reactants which are a H2 molecule and a F atom.
Good but refer to your image. Your description on bond energies can be backed up further using published bond energies for HH and HF. Good description on locating the transition state. More clarity can be gain from relevant simulated plots and by stating the experimental HH bond distance Sf3014 (talk) 16:27, 24 May 2020 (BST)
Report the activation energy for both reactions.
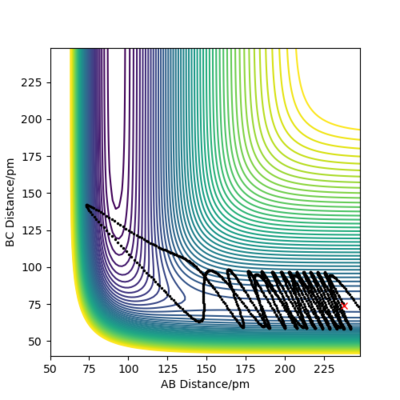
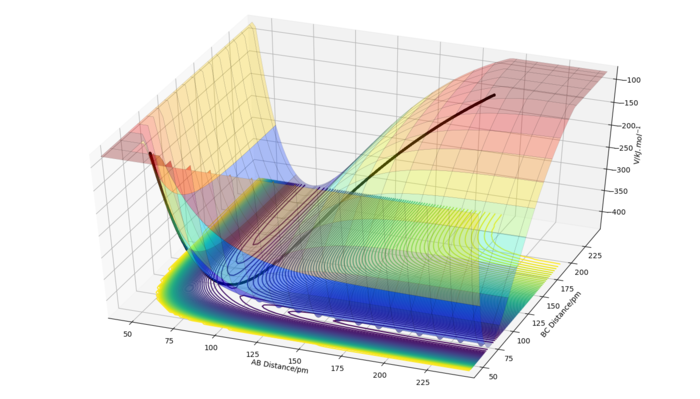
The activation energy for F+H2-->HF+H is approximately 1.05 kJ/mol, whereas the activation energy for the reverse reaction is 126.681 kJ/mol. These were calculated by first finding the energy of the TS structure, which was -433.981 kJ/mol. Energies of the reactants and products were then obtained by performing a MEP simulation starting slightly off the TS structure in both directions (towards the reactants and towards the products, the one for the products is shown in the figure on the right). The calculated energy of the HF + H complex was -360.662 kJ/mol and that of the H2 + F complex was -435.031 kJ/mol. These values were used to calculate the activation energies given above. The obtained values are only approximate as we cannot move the atom infinitely far from the molecule but are nevertheless in good agreement with experimental findings.
Very good. This can be shown clearly using an energy vs time graph Sf3014 (talk) 16:30, 24 May 2020 (BST)
Reaction Dynamics
In light of the fact that energy is conserved, discuss the mechanism of release of the reaction energy. Explain how this could be confirmed experimentally.
Since the reaction is exothermic and the system is isolated, there must be a way of release of the excess energy. This energy is released as strong vibrations of the HF molecule. Since the vibration of a H-F bond, in contrast to a H-H bond, results in a change of dipole, electromagnetic radiation from the IR part of the spectrum is emitted as the molecule vibrates. This emitted IR radiation can be experimentally observed by emission vibrational spectroscopy and the production of products can be confirmed.

Good. Refer to graphs and don't leave all your description in your image caption, the images are meant to support your text not stand alone. This confuses the overall layout Sf3014 (talk) 16:36, 24 May 2020 (BST)
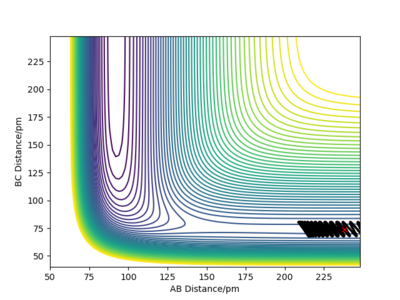
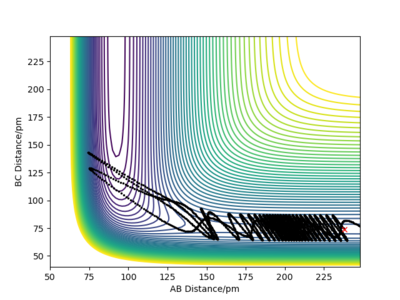
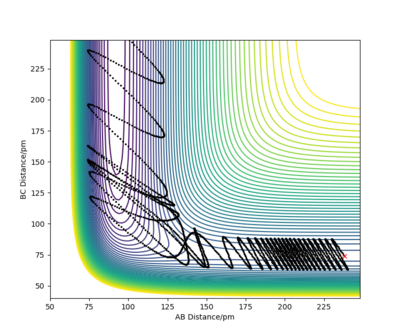
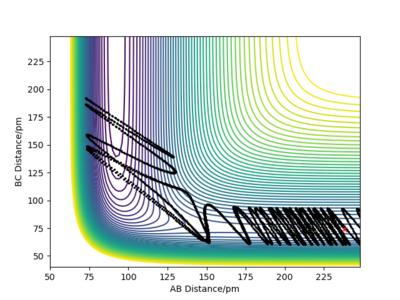
Let's now setup a calculation starting on the side of the reactants of F + H2, at the bottom of the well rHH = 74 pm, an rFH = 238 pm with a momentum pFH = -1.0 g.mol-1.pm.fs-1, and explore several values of pHH in the range -6.1 to 6.1 g.mol-1.pm.fs-1. Note that we are putting more energy into the system than the activation energy. The table below shows some observations and contour plots.
Very good, clear definitions of variables! Makes your descriptions very easy to follow. Sf3014 (talk) 16:43, 24 May 2020 (BST)
From the table above it is obvious that whether the reaction will result in the formation of products is clearly not dependent only on the energy of vibration of the H2 molecule. We have also seen that these conditions where the molecule and the fluorine atom approach each other rather slowly rarely result in producing products. Maybe increasing the momentum pFH will help ...
For the same initial position, increase slightly the momentum AB, and considerably reduce the overall energy of the system by reducing the momentum BC. What do you observe now?
There is very little vibration in the H2 molecule now and the F atom and the H2 molecule are approaching each other faster than before. The trajectory is reactive and the reaction proceeds with a considerable amount of vibrational energy in the HF molecule.
Good but show the reaction trajectories for the higher translational energy Sf3014 (talk) 17:05, 24 May 2020 (BST)
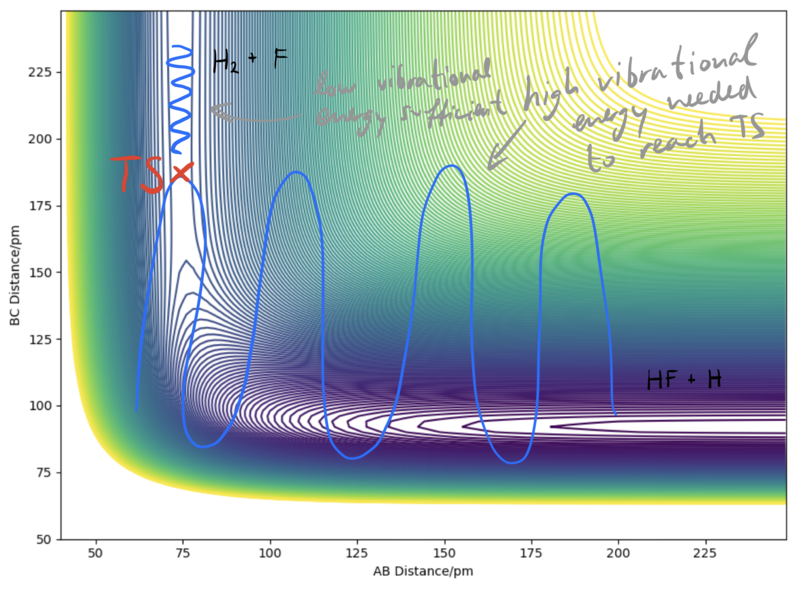
Let's now focus on the reverse reaction, H + HF. When there is very little vibrational energy in the HF molecule, the trajectories are non reactive, as we increase the vibration strength more and more trajectories become reactive. Why this is so is discussed below (Polanyi's empirical rules).
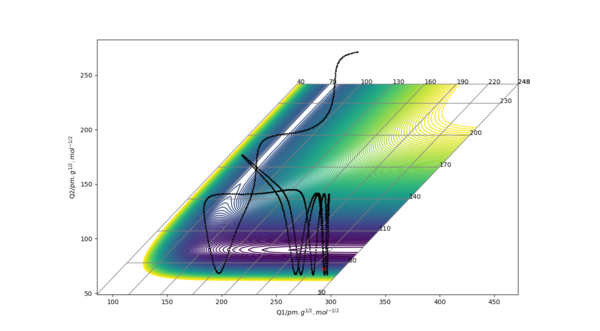
An example of a reactive trajectory for this reaction would be produced by the following initial conditions: AB distance = 230 pm, BC distance = 74.2 pm, AB momentum = -1 g.mol-1.pm.fs-1 and BC momentum = 14.5 g.mol-1.pm.fs-1. The animation of this rather interesting trajectory is below.

Discuss how the distribution of energy between different modes (translation and vibration) affect the efficiency of the reaction, and how this is influenced by the position of the transition state.
Polanyi's empirical rules are very useful when we are trying to find suitable initial conditions for a reactive trajectory. These rules tell us what modes need to have sufficient energy for certain types of TSs for a reaction to proceed. For early TSs, translational energy is more efficient than vibrational energy. For late TSs, on the other hand, vibrational energy will be more efficient. Why this is so is discussed in the figure below.
Very good. More examples (trajectory plots) for the H + HF reaction will solidify your point Sf3014 (talk) 17:05, 24 May 2020 (BST)
Conclusions
Two linear triatomic systems, HHH and HHF, were studied here. Their reaction trajectories were of particular interest. Transition state theory was used and the Polanyi's empirical rules were applied in finding suitable initial conditions for reactions. It was shown that even with a relatively simplistic model, without even invoking quantum mechanics, a remarkable amount of information can be gathered about a system and the insight into the dynamics of molecular reactions is eye-opening.
References
- ↑ Pregeljc, Domen, Jug, Urska, Mavri, Janez, Stare, Jernej (2018). Why does the Y326I mutant of monoamine oxidase B decompose an endogenous amphetamine at a slower rate than the wild type enzyme? Reaction step elucidated by multiscale molecular simulations..
- ↑ Artritha, Nonguch, Urban, Alexander (2016). An implementation of artificial neural-network potentials for atomistic materials simulations: Performance for TiO2.
- ↑ Laidler, Keith J. (2016). Chemical Kinetics.
- ↑ Atkins, Peter, de Paula, Julio (2014). Atkins' Physical Chemistry.

