MRD:01566447
5/5 - An excellent report, well done. Some minor comments throughout (see the below)
H + H2 system
Dynamics from Transition State region
HA + HB-HC -> HA-HB + HC
The progress of the reaction above can be mapped on a potential energy surface (PES). The trajectory shown on the potential energy surface represents the change in potential energy, rAB and rBC as reaction proceeds given an initial set of parameters (rAB, rBC,pAB, pBC at time=0, where r is distance and p is momenta).
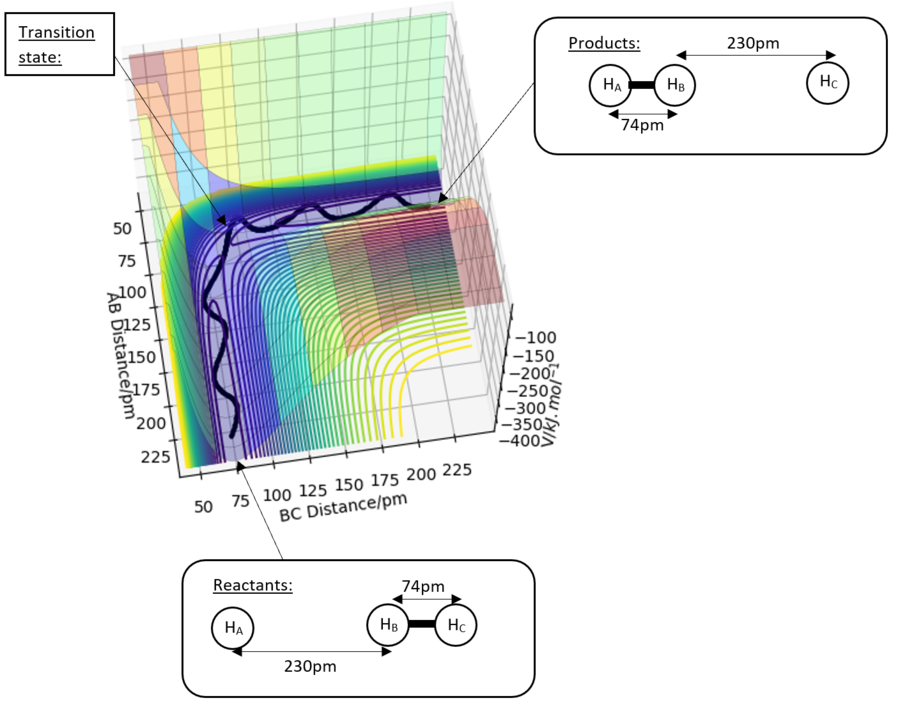
On the PES, the transition state (TS) is a first order saddle point. It is the maxima on the minimum energy path, and the minima in the directions orthogonal to this path.
Assuming a set of initial parameters that result in the successful formation of the products HA-HB and HC, the trajectory shown passes though a saddle point which represents the TS of the reaction. It is mathematically defined as ∂V(rAB)/∂rAB=∂V(rBC)/∂rBC=0. Since Force=∂V(r)/∂r, zero gradient means zero force along AB and BC. To distinguish the TS from a local minima on the PES, we can use the Hessian matrix to compute the Hessian eigenvalues. For local energy minima, both Hessian eigenvalues will be positive. For a TS, one Hessian eigenvalue is positive while the other is negative.
Good definition!
Locating TS position
If initial rAB and rBC distances are set to the distances corresponding to the TS, with no initial momentum, the force acting on the atoms is 0 thus would remain there indefinitely. Since the H + H2 system is symmetrical, rAB=rBC at the TS.

The TS position rts is approximately 90.8 pm, where rts=rAB=rBC. The parameters set for the plotted trajectory rAB=rBC=90.8 pm and pAB=pBC=0 g.mol-1.pm.fs-1. Oscillation is at a minimum as shown by the horizontal lines on the Internuclear distance-time graph above, which means the system is at the midpoint on the ridge, the atoms are stationary and system is at the transition state: rts=(rAC-rAB)=(rAC-rBC)=90.8 pm as illustrated in the graph.
Good TS estimate.
Trajectories from rAB = rts, rBC = rts+1pm
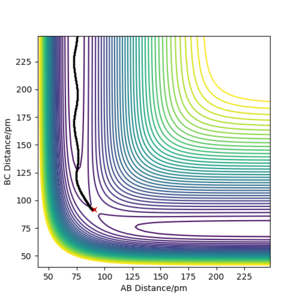
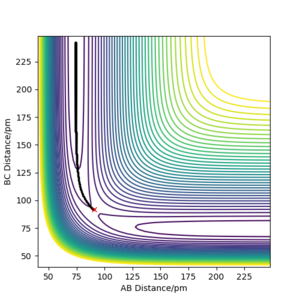
There are two ways to calculate the trajectory, 'Dynamics' and 'Minimum energy path(mep)', the latter of which resets the momenta and velocity to 0 at every time step. Results obtained from using the 2 different methods are shown below. Products formed are HA-HB and HC.
Trajectory from 'Dynamics':
 |
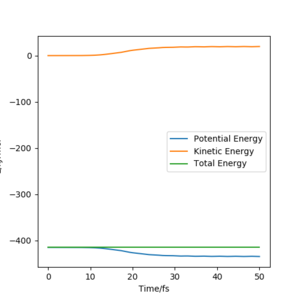 |
The trajectory calculated using the 'Dynamic' option shows greater oscillation, which means the product molecules vibrate and possess kinetic energy. Potential energy is converted to kinetic energy as shown in the Energy-Time graph where the kinetic energy increases whilst potential energy decreases.
Trajectory from 'mep':
 |
 |
Whereas in the 'mep' contour plot, the trajectory is smooth and follows the valley floor of the PES, kinetic energy throughout the reaction path is constantly 0 as shown in the Energy-Time graph. Atoms possess no kinetic energy to vibrate as a result of removing the inertial effect, thus no oscillation is observed from the trajectory on the contour plot. This is not representative of reality because atoms have mass and thus have inertia.
The mep connects the 2 energy minima on the PES and the energy maxima along the MES corresponds to the saddle point that represents the transition state of the reaction.
Good explanation!
Changing initial conditions
If we used the initial conditions rAB = rts+1pm, rBC = rts, reaction would proceed in the opposite direction instead, products formed are HA and HB-HC.
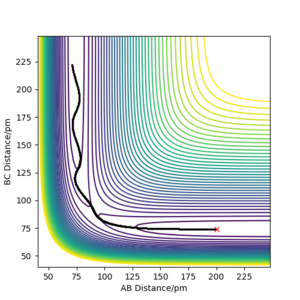
After setting the initial parameters with the final positions and reversing the signs of the momenta, trajectories from the Dynamics calculation differs from that of mep. For the dynamics calculation, reaction proceeds back towards the initial position. For the mep calculation, the pathway proceeds in the opposite direction and continues to follow the valley floor of the PES.
Why not back this up with an example?
Reactive and Unreactive Trajectories
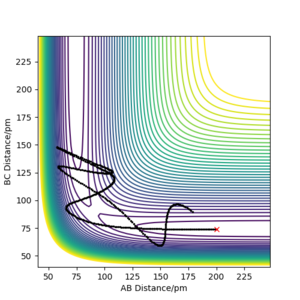
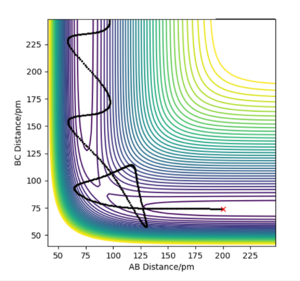
From the table, we can conclude that the hypothesis that trajectories starting with the same positions but with higher values of momenta (higher kinetic energy) would be reactive is false. Comparing the 1st and the 4th graph, we can see the 4th has greater momenta thus more kinetic energy, but the trajectory is unreactive, while the 1st graph shows a reactive trajectory. This means that whether a trajectory is reactive or not is not dependent only on the size of its values, because the TS can be recrossed. The momentas must be of the right combination such that the resulting products are formed after crossing the TS(once or more than once). Atoms must possess the right amount of vibrational energy and possess the correct orientation for a reaction to proceed successfully.
Transition State Theory (TST)
TST has certain assumptions which may lead to deviations in reaction rate values from experimental values.
Assumptions[1]: 1)Born-Oppenheimer Approximation where electronic and nuclear motions can be separated.
2)Reactant molecules are distributed among their states according to the Maxwell-Boltzmann distribution.
3)Molecular systems that have crossed the TS in the direction of the products cannot recross the TS again to reform reactants
4)In the TS, motion along the reaction coordinate may be separated from the other motions and treated classically as translation, ignoring any quantum tunneling effects.
5)Even in the absence of equilibrum between the reactant and product molecules, the TS that are becoming products are distributed among their states according to Maxwell-Boltzmann laws.
Assumption 4 which states that quantum effects are ignored in the TST does not hold in reality, because quantum tunneling effects do occur, which means reactant molecules do not need to overcome the activation energy and cross the TS to form products. Hence in reality, experimental reaction rates would be larger than those predicted using the TST.
Assumption 3 is also another assumption that does not represent what happens in reality. As seen in the table of reactive and unreactive trajectories, the 4th reaction(p1=-5.1, p2=-10.1) is an example of how the TS can be crossed again even after formation of products. Leading to lower experimental reaction rates compared to the predicted values.
Effect of recrossing of TS is likely to be larger than that of quantum tunneling. Hence the overall effect is that the predicted rate constants using TST is an overestimation of the experimental rate constants.
Absolutely correct, well done!
F-H-H system
PES inspection
The reaction of FA + HB-HC -> FA-HB + HC is as shown in the PES below(left to right). As FAHB distance decreases, the potential energy decreases, indicating reaction in this direction is exothermic.
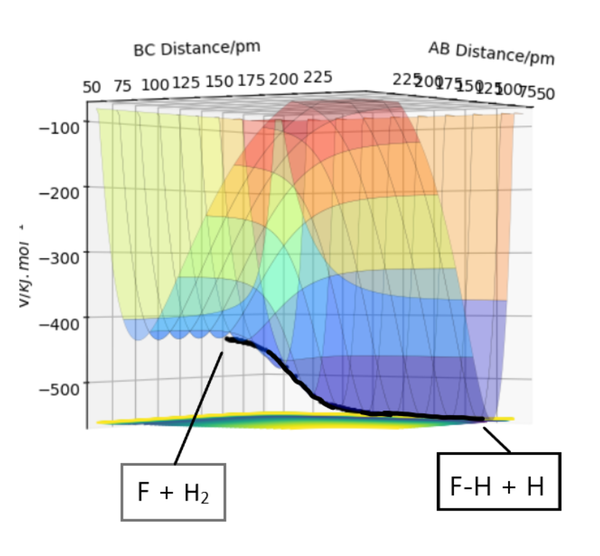
Whereas the reaction in the opposite direction(right to left): FA-HB + HC -> FA + HB-HC, shows an increase in energy, indicating the reaction is endothermic.
How bond strength affects energetics of reaction
| Bond | Bond energy (kJ mol-1)[2] |
|---|---|
| H-H | 436 |
| F-H | 569 |
As shown in the table above, the bond strength of H-H is weaker than F-H. This means that for the reaction of F + H2, energy released from forming the F-H bond is greater than the energy required to break the H-H bond. The reaction releases energy thus it is exothermic.
On the other hand, the reaction of FH + H is endothermic because energy required to break the F-H bond is greater than the energy released from the cleavage of the H-H bond. Overall, energy is required for the reaction to proceed successfully.
Transition state
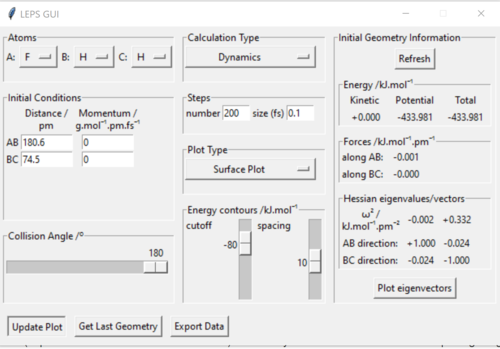
The approximate transition state was located with the help of Hammond's postulate. Below are the parameters, force, energy and Hessian eigenvalues for the transition state. The forces are close to or at zero, the Hessian eigenvalues have opposing signs which indicates this is a saddle point and the transition state. rAB=180.6pm and rBC=74.5pm.
A summary of the reaction showing the structure of the reactants, products and transition state is shown below:

Excellent!
Activation energy
The energies of the TS, reactants and products were calculated using an mep trajectory and shown in the figure below:

Good estimates and nice figure.
The approximate activation energy for the exothermic reaction(F + H2) is 1.118 kJ mol-1.
The approximate activation energy for the endothermic reaction(FH + H) is 126.564 kJ mol-1.
Reaction Dynamics
Mechanism of Energy release
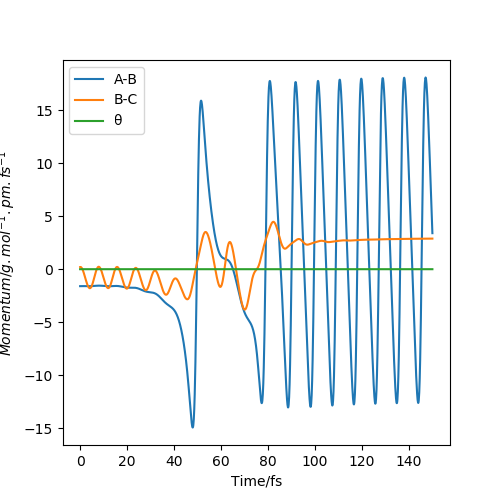
From the momenta graph above, we can see the oscillations of the product molecule is much larger than that of the reactant molecules. This implies that during the reaction, the decrease in potential energy releases energy in the form of kinetic energy, more specifically vibrational energy as shown by the large oscillations of product molecule after TS is crossed. This gain in vibrational energy can be experimentally measured using Infrared Chemiluminescence. The intensities of the IR absorption peaks can be used to calculate the relative populations of the product at each vibrational energy level. Products with more vibrational energy will populate higher energy levels, giving rise to overtones which has a smaller wavenumber compared to the fundamental peak. Over time, the overtones will become smaller while the fundamental peak becomes larger. This is because product molecules in the excited state release kinetic energy as heat and fall to the ground state, less product is at higher vibrational states.
This provides an alternative way to experimentally confirm the mechanism of energy release. The heat released, converted from kinetic energy can be measured using calorimetry. The increase in temperature due to kinetic energy is measured and used to calculate the amount of kinetic energy released. However, we are unable to differentiate between vibrational kinetic energy and translational kinetic energy using this method. Therefor, infrared chemiluminescence is preferred over calorimetry.
Absolutely correct.
Polanyi's Empirical Rules
For exothermic reactions with early TS, more translational energy over vibrational energy tends to lead to more effective reactions. This can be illustrated by the cases studied using the reaction of FA + HB-HC. Whereas for endothermic reactions with late TS, more vibrational energy over translational energy usually leads to more effective reactions and is shown by the cases studied for reaction of FA-HB + HC.[3] For both cases, there must be enough kinetic energy(vibrational and translational) to overcome the activation barrier for reaction to proceed.
Exothermic FA + HB-HC: For positions rAB=190pm and rBC=74pm,


The momenta along AB represents translational energy of F, whereas momenta along BC represents vibrational energy of H2. In Plot 1, momenta along BC is larger, which means more vibrational energy over translational energy was used to drive the reaction, but it did not succeed. On the other hand, in Plot 2, momenta of AB is larger which means more translational energy instead of vibrational energy was used to drive the reaction. The reaction was successful as seen from the reactive trajectory. This is in line with Polanyi's Empirical rules, where an exothermic reaction with early TS is more effectively driven by translational energy.
Endothermic FA-HB + HC: For positions rAB=92pm and rBC=225pm,

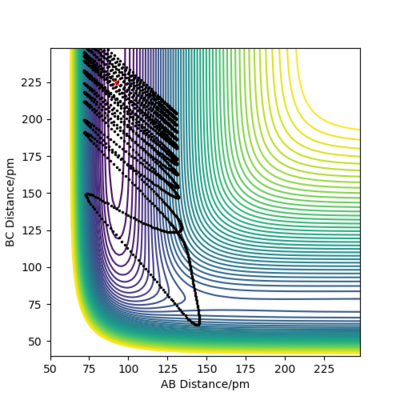
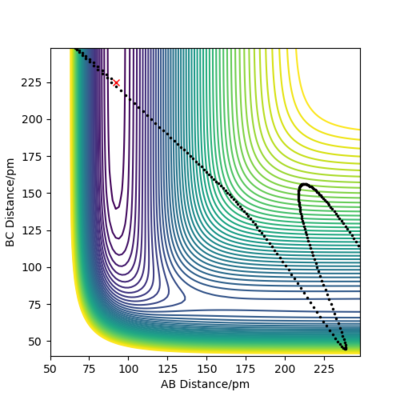
Good examples for the most part. Good attempt with the final figure, but what you've really done is just 'blasted through' the barrier rather than crossing it as your trajectory doesnt go anywhere near the TS! It is a tricky trajecotyr to get right though.
The momenta along AB represents vibrational energy of F-H, while the momenta along BC represents the translational energy of the lone H atom. For Plot 3, momenta along BC is quite high, which means the system has a lot of translational energy which is ineffective in driving the reaction, resulting in an unreactive trajectory. For Plot 4, momenta along BC is reduced whereas momenta along AB increases, which raises the amount of vibrational energy compared to translational energy. However, there is still not enough vibrational energy to yield a reactive trajectory. Lastly, in Plot 5, momenta along AB is large enough to effectively drive the reaction and produce a reactive trajectory. This is consistent with Polanyi's empirical rules which states endothermic reactions with late TS are more effectively driven by vibrational energy.
References
- ↑ J. I. Steinfeld, J. S. Francisco, W. L. Hase, in Chemical Kinetic and Dynamics, Prentice-Hall, 2nd ed., 1998, ch. 10, pp. 287-321.
- ↑ Chemistry LibreTexts, https://chem.libretexts.org/Courses/Oregon_Institute_of_Technology/OIT%3A_CHE_202_-_General_Chemistry_II/Unit_5%3A_Molecular_Shape/5.1%3A_Bond_Strength, (accessed May 2020).
- ↑ K. J. Laidler, in Chemical Kinetics, Harper-Collins, 3rd ed, 1951, ch.12, pp. 460-471.

