MRD:01556808
EXERCISE 1: H + H2 system
Dynamics from the transition state region
Transition states are specific geometries along the reaction coordinate. Their structure cannot be isolated, but it can be predicted using certain computational techniques. The transition state is mathematically defined as the point where:
V=potential energy, ri=interatomic coordinate
To ensure the point is the transition state, the second derivative of the orthogonal vectors (q1 and q2) in each direction from the transition state are taken and they should have opposite signs.
and [1]
Great, well defined and explained. Rs6817 (talk) 16:55, 27 May 2020 (BST)
The transition state can be identified by starting trajectories (with no initial momentum) near where the transition state is located, to locate the saddle point. This is the highest energy point on the lowest energy reaction path. From there, the transition state is found by changing the geometry and determining whether it travels towards the reactants or products, until reaching a geometry where the net force is zero (as force equals the negative derivative of volume with respect to the reaction coordinates). At this point, there is no movement towards the reactants or products. A transition state is different from a local minimum point, because if you do not change the geometry at the transition point, the transition state will remain unchanged in this geometry.
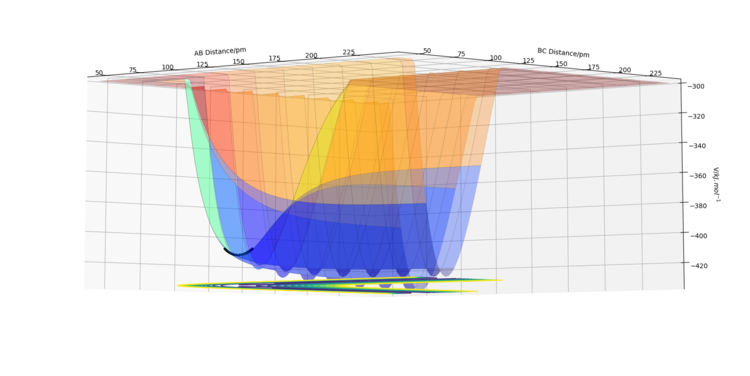
Trajectories from r1 = r2: locating the transition state
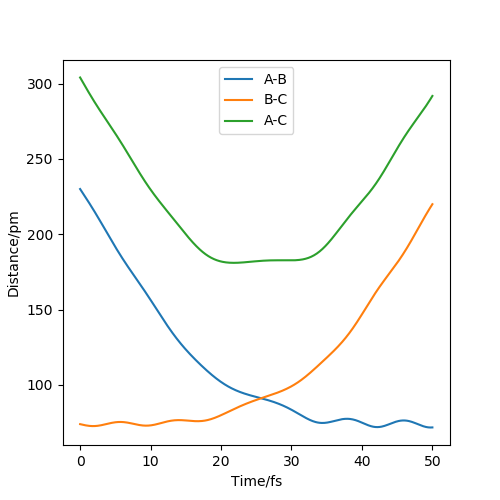
For the reaction H + H2 -> H2 + H, the transition state is symmetric as the reactants and products have the same structures. This means that to find the transition state, the geometry where the distance AB = BC must be found. A distance vs time plot (figure 2) was produced to find a rough estimate of this position, which was around 85 pm. Then, to find the accurate geometry, different values around this length were tried until a distance where the forces along AB and BC are 0.000 kJ mol-1 pm-1. This occurred when AB = BC = 90.775 pm. As the forces are zero, this means the derivative of potential energy with respect to distance is also zero, therefore this is the transition point.
Great explanation Rs6817 (talk) 16:55, 27 May 2020 (BST)
The Reaction path
The reaction path (also know as the Minimum Energy Path, MEP) is a type of trajectory, which represents infinitely slow motion.
Trajectories from r1 = rts+δ, r2 = rts
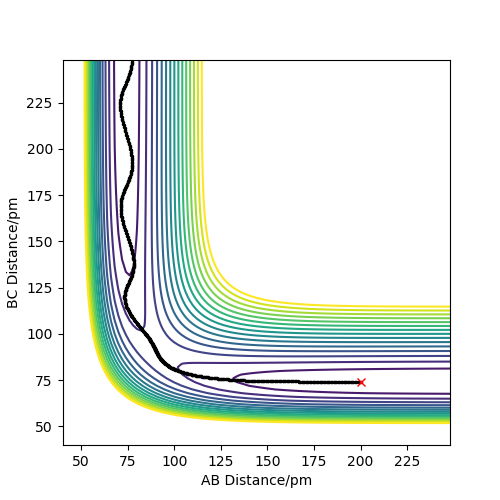
In this section, the contour plots of the dynamic trajectory and the MEP are compared in conditions slightly displaced from the transition state: r1 = rts+1 pm, r2 = rts and the momenta p1 = p2 = 0 g.mol-1.pm.fs-1. As the distance between BC is slightly greater than the AB distance, the AB product will form.
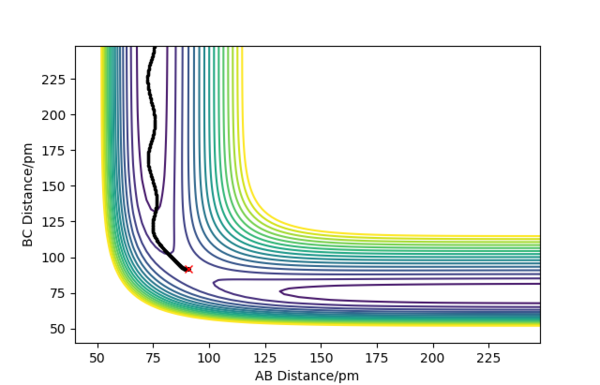
Figure 3 shows the dynamic contour plot. The trajectory begins at a point slightly displaced towards AB, then move towards AB geometry, showing oscillations between the two atoms.
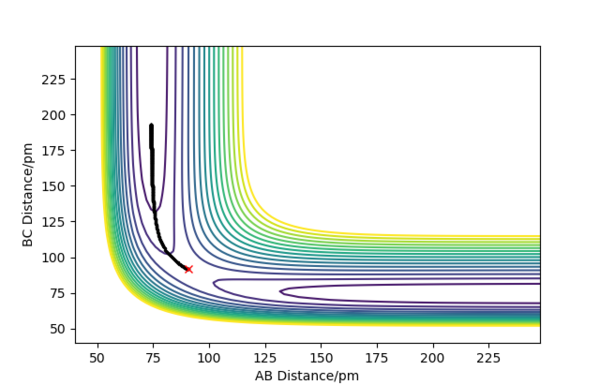
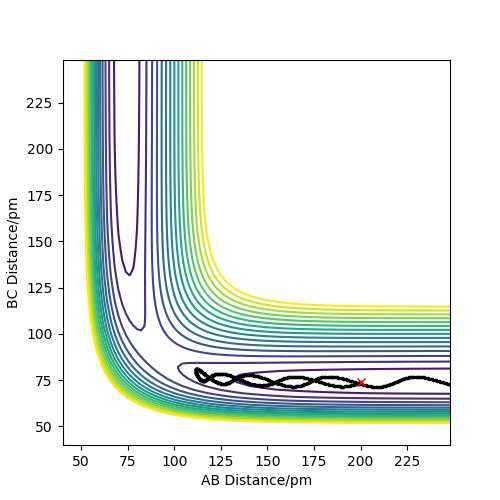
Figure 4 shows the MEP contour plot. The plot doesn't show oscillations between the AB atoms because at each time step the momenta and velocities of the species are set to 0.

Figure 5 shows the MEP momenta vs time. The momentum is constant at 0 g.mol-1.pm.fs-1 because it is reset to zero at each measured interval.
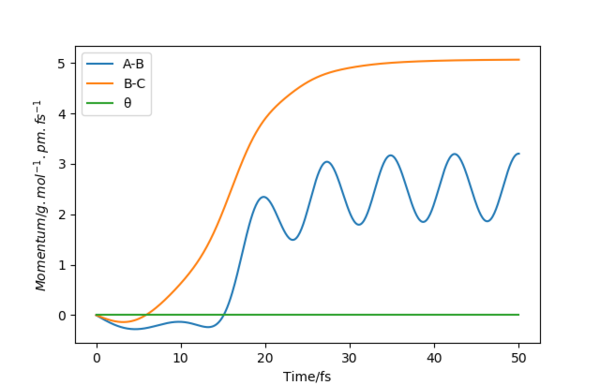
Figure 6 shows the dynamic momenta vs time. It shows the formation of the AB product, with an oscillating momentum between 2-3 g.mol-1.pm.fs-1 and the atom C which has momentum that plateaus around 5 g.mol-1.pm.fs-1.
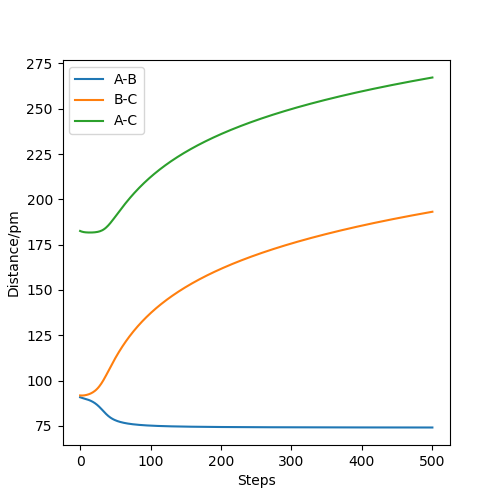
Figure 7 shows the MEP distance vs time. It shows the distance between AB decreasing to a constant value around 75 pm as they form a bond, and the distances between AC and BC increasing.
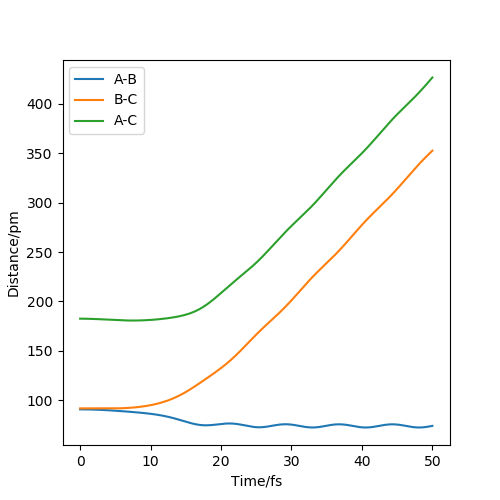
Figure 8 shows the dynamic distance vs time. The key difference from the MEP plot is that this plot shows oscillations between A and B, as their inter-nuclear distance changes slightly as they oscillate.


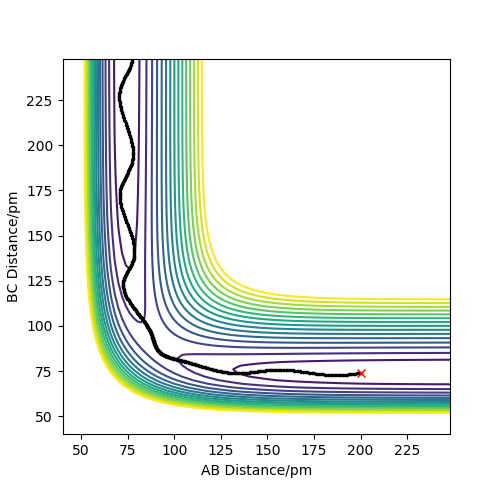
Figures 9 and 10 represent the distance vs time for the dynamic and MEP calculation types, where r1 = rts and r2 = rts + 1 pm. The difference here is that the transition state geometry is slightly displaced in the other direction, making the BC distance shorter than AB distance, therefore the former product forms.
There are too many graphs here which makes your point of comparing the MEP and trajectory confusing. Your main aim is to compare the diferent types of calculains and the impact this would have on the calcultion. What do the oscillations correspond to? Rs6817 (talk) 16:55, 27 May 2020 (BST)
Reactive and Unreactive Trajectories
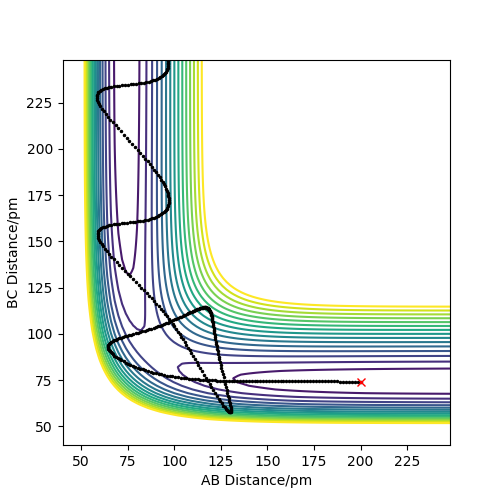
The following parameters were set to give the results in table 1:
r1/rBC= 74 pm, r2/rAB = 200 pm, p1 = pBC, p2 = pAB
From the table, it can be concluded that for the reaction to occur successfully, the reactants require sufficient energy to overcome the activation energy barrier, and the products must have insufficient energy to overcome this barrier. The total energy can be increased by increasing the momenta of the reactants.
Your conclusion requires some more detail. Barrier recorssing occurs here but why? What does this say about the reactions vibrational and translational energies? Rs6817 (talk) 16:55, 27 May 2020 (BST)
Transition State Theory
This theory predicts the rate constant for bimolecular reactions. The theoretical values will differ from experimental data because the theory makes several assumptions. For example, transition state theory incorrectly predicts that the 4th reaction in table 1 would successfully form the products as they have enough energy to overcome the activation energy barrier. This is because the theory predicts that all crossings of the transition state will form the product, so it doesn't account for the reversibility of the reaction and that the products may be energetic enough to reform the reactants. This would result in the theoretical value for the rate constant to be an overestimate of the experimental value. It also uses the Born-Oppenheimer[2] theory, which is a quantum mechanical simplification of the system, that separates the motions of nuclei and electrons to treat them independently. The theory represents the atoms using classical mechanics rather than quantum mechanics, therefore tunneling effects are neglected. Tunneling causes the experimental rate constant to increase, leading to the theoretical value being an underestimate. However, the effects of tunneling are greater on atoms with higher masses, therefore for the H-H-H model, these effects are negligible.
Great, well defined and explained. Rs6817 (talk) 16:55, 27 May 2020 (BST)
EXERCISE 2: F - H - H system
PES inspection
Exothermic reactions are those which release energy into the surroundings (ie. energy used to break bonds - energy released when bonds form = negative). Endothermic reactions are those which take in energy from the surroundings (ie. energy used to break bonds - energy released when bonds form = positive).
H-F bond enthalpy: +568.6 kj.mol-1 [3]
H-H bond enthalpy: +436.0 kj.mol-1
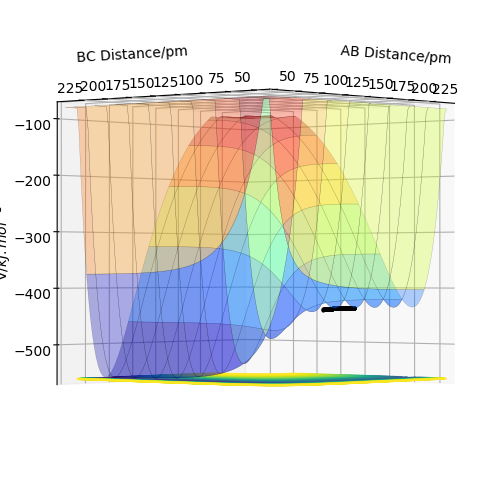
In the following reactions: A=Fluorine, B=Hydrogen, C= Hydrogen
Reaction 1: F + H2 -> HF + H
Enthalpy change = -132.6 kj.mol-1 (exothermic)
In figure 11, it shows that the saddle point where AB are far apart (ie. the reactants) has higher energy than the saddle point where BC are far apart (ie. the products). This shows that the reaction is exothermic.
Reaction 2: H + HF -> H2 + F
Enthalpy change = +132.6 kj.mol-1 (endothermic)
This reaction is the reverse of the previous reaction, therefore it is endothermic.
The transition state energy is -433.981 kj.mol-1 and it occurs when AB=181 pm, BC=74.5 pm and initial momenta=0 g.mol-1.pm.fs-1. It was located by finding the positions where the AB and BC forces are 0.
Activation Energy
The activation energies of each reaction is calculated by subtracting the potential energy of the reactants from the potential energy of the transition state. The initial energies of the reactants were calculated by setting the distance of the atom to being 600 pm away from the diatomic molecule, so it is too far away to interact with the molecule. The distance between the atoms in the molecule was found by changing its value until the forces between the atoms was zero. The inter-nuclear distance for H2=74 pm and the inter-nuclear distance for HF=92 pm.
Activation energy for reaction 1:
F + H2 -> HF + H
-433.981 - (-435.100) = +1.119 kj.mol-1
This means that a small energy input is required for this reaction to occur.
Activation energy for reaction 2:
H + HF -> H2 + F
-433.981 - (-560.700) = +126.719 kj.mol-1
This means that a much larger energy input is required for this reaction to occur.
Good ok. You could have included a graph here to illustrate your method (i.e. an energy time graph). Rs6817 (talk) 16:55, 27 May 2020 (BST)
Reaction Dynamics
F + H2 -> HF + H
A=Fluorine, B=Hydrogen, C=Hydrogen
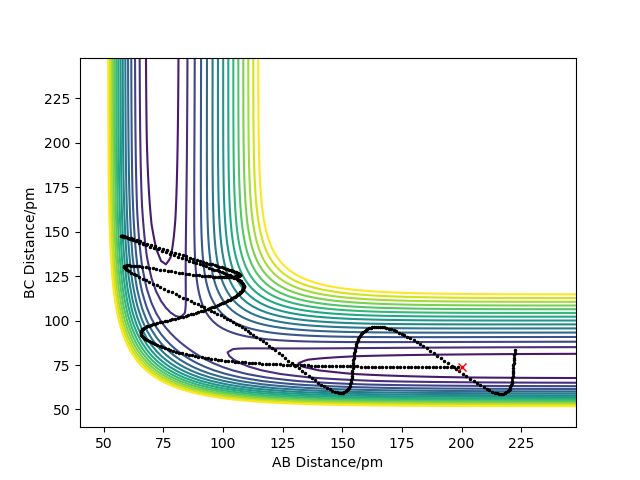
The following parameters were set for this reaction: initial H-H distance=88 pm, initial H-F distance=150 pm and initial momenta=0.
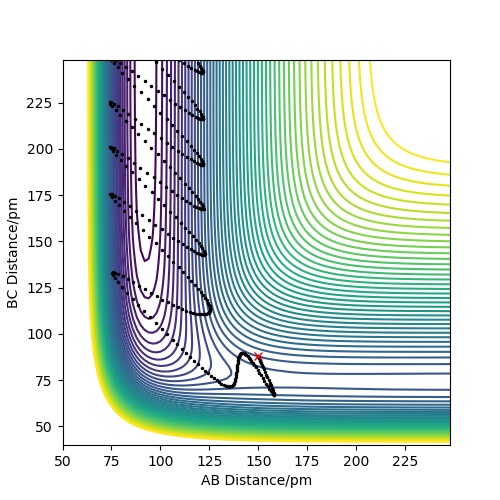
The reaction produced the contour plot in figure 12, showing that the reaction formed the products without reforming the reactants. The products still have a large amount of energy, shown by their large oscillations through the low energy contours into the higher energy ones.
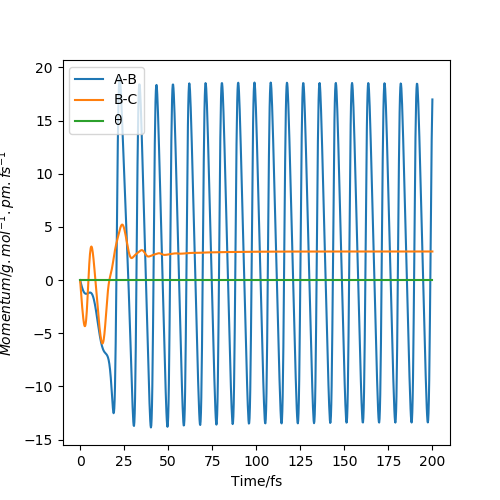
The momenta vs time plot (figure 13) shows the initial momenta to be 0. The momenta of each species increases as their potential energy turns into kinetic energy. It shows that the reaction has gone to completion, and the reactants did not reform, as a rhythmic A-B oscillation (H-F) forms, while the B-C momentum is constant, as the two hydrogen atoms are no longer bonded.

The energy vs time plot (figure 14) shows conservation of energy in the reaction, as the total energy line stays constant (-421.026 kj.mol-1). Before the reaction occured, the potential energy was higher than it was after the reaction, and the kinetic energy was lower than it was after the reaction. This shows that some energy was transferred from potential energy to kinetic energy, which gets released as heat. Therefore, it shows that the reaction is exothermic.
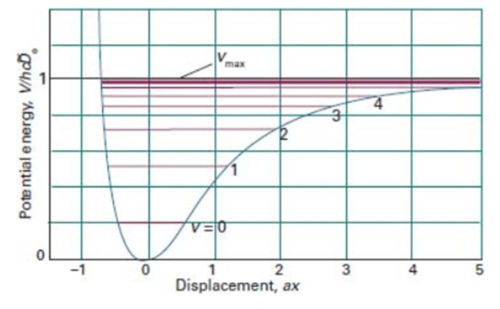
One way to measure the amount of energy released in an exothermic reaction is through calorimetry. However, this method can lead to underestimates of the energy released, due to heat loss to the environment, which isn't transferred to the substance being heated. Another technique which can measure the vibrational energy in a reaction is through infrared spectroscopy. For a reaction with high vibrational energy, there will be transitions in higher energy levels. For example, based on the anharmonic oscillator in figure 15, if the state v=1 is populated with electrons which then are promoted to the v=2 state, vibrational overtones will be produced on the spectrum. These absorptions are of higher energy and therefore of a higher wavenumber than the main absorption caused by v0 to v1 transitions. This allows molecules of high vibrational energy to be identified. A specific type of spectroscopy which determines vibrational modes within molecules is Raman spectroscopy. For this type of spectroscopy to work, there must be a change in dipole moment within the molecule when it vibrates[5]. This occurs in HF due to the high electronegativity of fluorine compared to hydrogen creating a dipole in the molecule. This spectroscopy would not work for the reverse reaction, where H2 is formed because there is no difference in electronegativities between the atoms and therefore no overall dipole moment.
Great answer good use of references. Rs6817 (talk) 16:55, 27 May 2020 (BST)
Energy Types
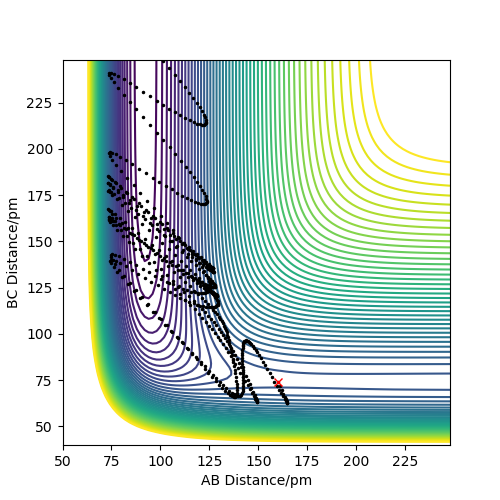
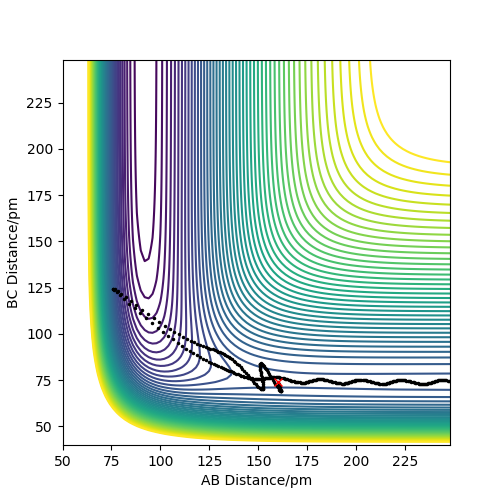
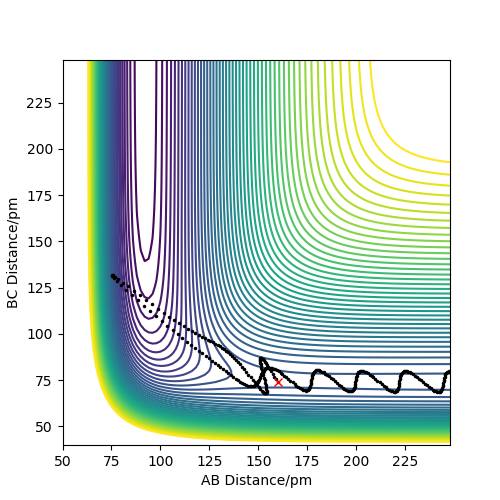
The effect of different modes of energy on the reaction between F + H2 was determined by changing the AB and BC momenta and the results are shown in table 2.
A=fluorine, B=hydrogen, C=hydrogen, rAB=160 pm and rBC=74 pm.
In these reactions, the hydrogen atoms are bonded together and F exists as an atom, therefore pHH/pBC represents vibrational energy and pHF/pAB represents translational energy (as the species are moving towards each other). Polyani's rules state that high vibrational energy is more likely to promote a late transition state (ie. one that reflects the products) and high translational energy is more likely to promote an early transition state (ie. one that reflects the reactants)[6]
Using these rules to explain the results in the table:
Polyani's rules can be linked to Hammond's postulate, which states that early transition states will reflect the reactants (for exothermic reactions) and late transition states will reflect the products (for endothermic reactions)[7]. By combining the theories, they indicate that the exothermic reaction between H2 + F is more effective in conditions with high translational energy.
This rule correctly predicts the outcomes of 5 out of 6 reactions in the table, based on whether the translational or vibrational energy is greater. For example, reactions 5 and 6 have very similar energy values, however, the trajectory and products are very different, based on the fact that reaction 6 has much larger translational energy compared to vibrational energy. This caused it to form the products.
However, the first example in the table has a higher vibrational energy and still forms the products, which indicates that there are other factors to consider to determine the outcome of the reactions. This reaction has higher total energy than any of the others in the table, which indicates a balance needs to be found between the types of energies and their contribution to total energy.
Good exploration for this question. Could have made slightly clearer on the dependency of exo or endothermicity but otherwise well done. Rs6817 (talk) 16:55, 27 May 2020 (BST)
References
- ↑ J. I. Steinfeld, J. S. Francisco, W. L. Hase Chemical Kinetic and Dynamics 2nd ed., Prentice-Hall, 1998, ch. 10, pp. 287-289
- ↑ J. I. Steinfeld, J. S. Francisco, W. L. Hase Chemical Kinetic and Dynamics 2nd ed., Prentice-Hall, 1998, ch. 10, pp. 289-290
- ↑ Properties of Atoms, Radicals and Bonds, https://labs.chem.ucsb.edu/zakarian/armen/11---bonddissociationenergy.pdf (accessed May 2020)
- ↑ P. W. Atkins, Atkins' Physical Chemistry, 2018, ch. 11, pp. 445
- ↑ P. W. Atkins, Atkins' Physical Chemistry, 2018, ch. 11, pp. 450
- ↑ Z. Zhang, Y. Zhou,† and D. H. Zhang, J. Phys. Chem. Lett. 2012, 3, 23, 3416-3419
- ↑ G. Hammond, J. Am. Chem. Soc. 1955, 77, 2, 334-338

