MRD:01552413
Overall your report shows you understand the topic at hand. Great discussions provided throughout. I would advise you break up each sections answer into subheadings making it easier to follow the report, giving you a hyperlinked contents for navigation. Mys18 (talk) 23:32, 24 June 2020 (BST)
On a potential energy surface diagram, how is the transition state mathematically defined? How can the transition state be identified, and how can it be distinguished from a local minimum of the potential energy surface?
The transition state is defined as the maximum point on the minimum energy path linking reactants and the products hence can be mathematically defined as ∂V(ri)/∂ri=0 which represents that the gradient of the potential is zero. It can be identified by starting a trajectory near the transition state and see whether they roll towards the reactants or products. This can be done several times with slightly varying trajectories in order to accurately identify the transition state. The transition state can be distinguished from the local minimum of the potential energy surface by taking the second derivative and checking whether ∂2V(ri)/∂r2i > 0 or ∂2V(ri)/∂r2i < 0 . ∂2V(ri)/∂r2i > 0 corresponds to the local minimum whereas ∂2V(ri)/∂r2i < 0 corresponds to the maximum ( transition state).
Fantastic. Your last point is not wrong wrt. local minimum. TS is a maximum along a minimum energy pathway. On a PES it can be seen a TS is a saddle point...see how the second derivative at this point differs from a local minimum in all directions. There you will have your answer in differentiating between the two. Mys18 (talk) 23:13, 24 June 2020 (BST)
Report your best estimate of the transition state position (rts) and explain your reasoning illustrating it with a “Internuclear Distances vs Time” plot for a relevant trajectory.

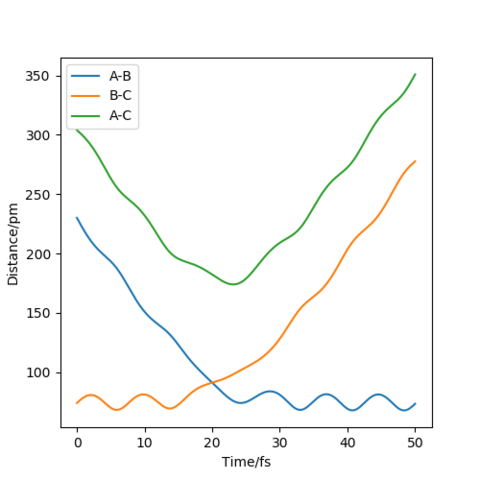
Since the H + H2 surface is symmetric, the transition state corresponds to where r1=r2 and hence Figure 2 shows the intersection point at 20 fs with a distance of 90.8 pm. Hence AB=BC= 90.8 pm. Figure 3 shows this point (saddle point) is at the diagonal intersect further providing evidence the transition state is this distance and also the force of the bonds is 0 kJ/mol/pm.
Nice job! Mys18 (talk) 23:13, 24 June 2020 (BST)
Comment on how the mep and the trajectory you just calculated differ
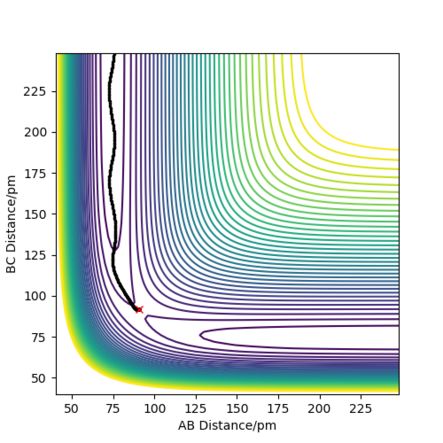
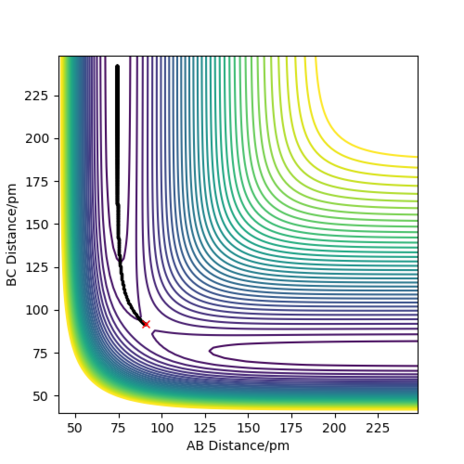
The trajectories, was found using r1 = rts+δ, r2 = rts where δ = 1 hence r1 = 91.8 pm and r2 = 90.8 pm and p1 = p2 = 0 g.mol-1.pm.fs-1 . Figure 4 shows a mep plot which doesn't provide a realistic account of the motion of atoms during a reaction as the vibration of the atoms aren't taken into account. However, Figure 5 showing the dynamic plot does include the atomic vibrations hence provides a more realistic account of the motion of atoms.
Exemplary! Mys18 (talk) 23:20, 24 June 2020 (BST)
Complete the table above by adding the total energy, whether the trajectory is reactive or unreactive, and provide a plot of the trajectory and a small description for what happens along the trajectory. What can you conclude from the table?
Given the results you have obtained, how will Transition State Theory predictions for reaction rate values compare with experimental values?
The transition state theory (TST) states that a molecular collision that leads to reaction must pass through an intermediate state known as the transition state essentially where A-B is partially formed and B-C is partially broken as discussed previously. It assumes once a transition state has been achieved the transition state structure does not collapse back to the reactants. However this does not fit with experimental data as shown in Figure 9 the transition state collapses back to the reactants. Therefore TST overestimates the rate of this bimolecular reaction, since it assumes all reactions go to completion, but experimentally this violates the assumption. Furthermore, the TST is also based on the assumption that atomic nuclei behave according to the classic mechanics, hence it ignores Quantum Tunnelling which leads to the underestimation of the TST, but since this is a small effect as compared to barrier recrossing, the TST is mainly an overestimate of rate. The TST also fails for some reactions at high temperatures due to the more complex motions of molecules or at very low temperatures due to the quantum tunneling.
Great discussion. I would recommend referencing these assumptions. Mys18 (talk) 23:24, 24 June 2020 (BST)
By inspecting the potential energy surfaces, classify the F + H2 and H + HF reactions according to their energetics (endothermic or exothermic). How does this relate to the bond strength of the chemical species involved? Locate the approximate position of the transition state.and the value of Activation energy

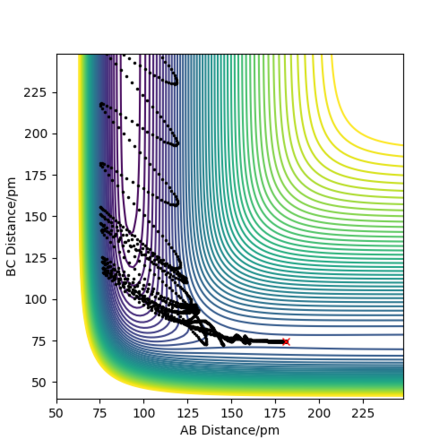
This reaction is exothermic as H-F is stronger than H-H. Even though H-H has stronger covalent character than H-F as the overlap of the 1s orbitals is greater than the overlap of 1s and 2p orbitals of H-F, the H-F molecule is polar due to the very electronegative fluorine atom, hence it has a greater ionic character so forms stronger bonds. H-H is non-polar and hence has no ionic character. The transition state was found by changing the distances of H-H and H-F till the force = 0 kJ/mol/pm. This occurred at HF= 181.1 pm and HH= 74.5 pm. This provides evidence of an early transition sate hence an exothermic process occurs. From this, the activation energy was obtained from the mep plot of energy vs time as shown in Figure 10 and so the activation energy = 121.76 kJ/mol
Good. You could search the literature for experimental bond energies for H2 and HF to support your bonding discussion. Mys18 (talk) 23:27, 24 June 2020 (BST)
| p= -6.1 | p=-4.1 | p=-2.1 | p=0 |
|---|---|---|---|
 |
 |
 |
 |
| p=2.1 | p=4.1 | p=6.1 |
|---|---|---|
 |
 |
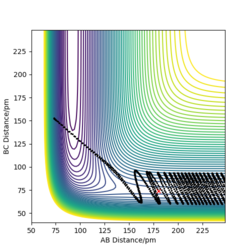 |
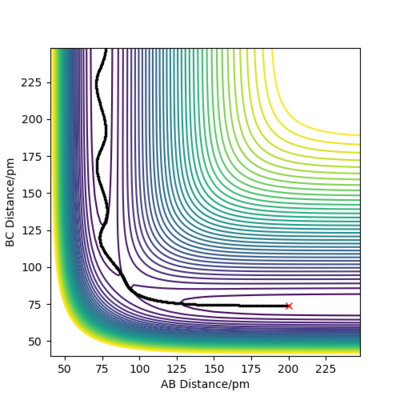
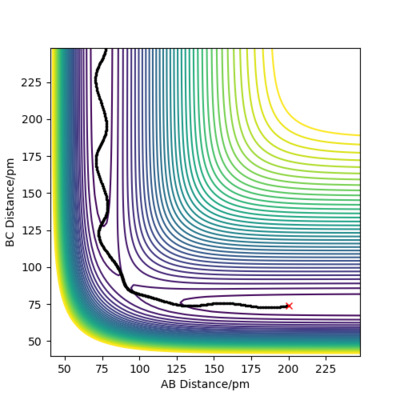
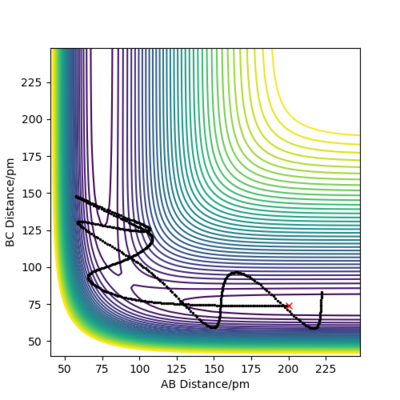
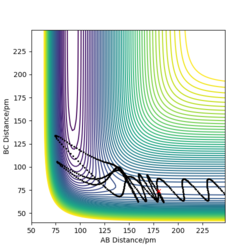
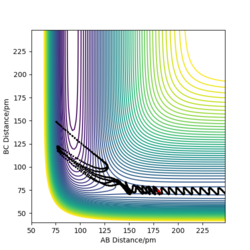
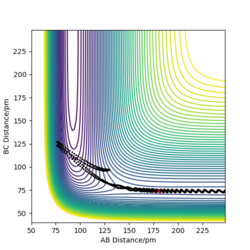
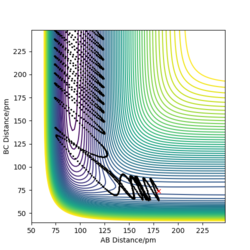
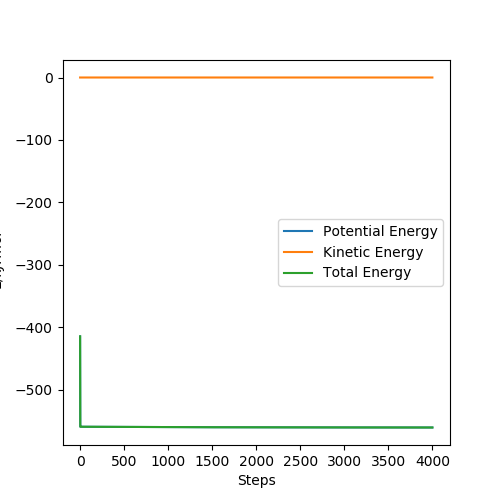
The table above shows the contour diagrams at changing momentums of H-H. When p=-4.1, p=2.1, and p=4.1 the reaction proceeds to the products (reactive trajectories)whereas for p=-6.1, p= -2.1 p=0 and p=6.1 after reaching the transition state, it reverts back to the reactants hence these are unreactive trajectories. After reaching the TS for the reactive trajectories there is greater vibrational energy as the H-F bond is stronger than the H-H bond and hence the force constant will be higher therefore the vibrational energy will be larger. This further shows the difference between experimental results and the transition state theory as when the transition state has reached, the product (H-F) doesn't always form as it reverts back to the reactants.
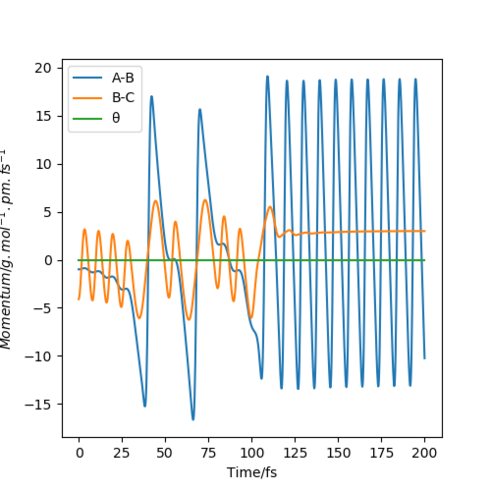
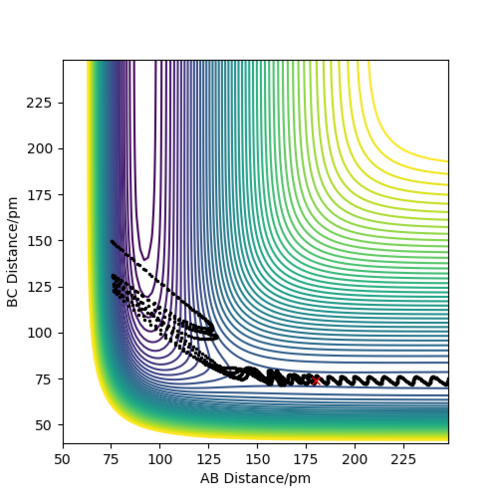
The mechanism of energy release can be interpreted, in terms of vibrational energy and translational energy as shown in Figure 13. At t = 0 fs H-F has no vibrational energy whereas H-H does, as shown by the oscillations on the graph. As the reaction proceeds H-F vibrates more and H-H vibrates less and eventually converges at p=3.12 g.mol-1.pm.fs-1 as no oscillations occur hence the energy is purely translational. H-F has greater oscillations than H-H as the H-F bond is stronger and so the force constant is greater so vibrational energy will be greater. For greater accuracy, IR spectroscopy can be used to confirm this as H-F is has a dipole moment so it is IR active, unlike H2 which is IR inactive hence transition between the energy levels is forbidden. Since H-F molecules can be excited, overtones are produced which suggests vibrational energy is present in the product.
How would you measure thermal changes experimentally? You can even check out 'chemiluminescence' which may be useful in monitoring the emission of infrared radiation from the sample. Mys18 (talk) 23:29, 24 June 2020 (BST)
HF + H
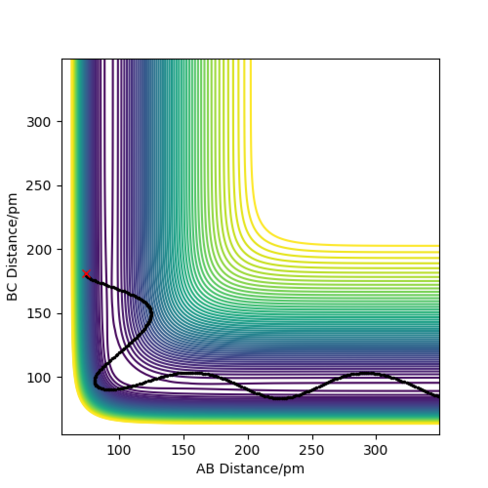
the bond distances found for the reactive trajectory was rHF = 74.49 pm and rHH= 181 pm with p = -3 and -5.1 repectively.
This reaction will be endothermic as the reactant H-F is lower in energy than the product H-H since H-F is a stronger bond than H-H as discussed previously. Via Hammond's postulate, the reactants are lower in energy compared to the products, hence a late transition state is observed. The transition state is located as previously discussed, was H-H = 74.12 pm and HF = 181.5 pm. The activation energy = 145.7 kJ/mol as shown in Figure 14.
Discuss how the distribution of energy between different modes (translation and vibration) affect the efficiency of the reaction, and how this is influenced by the position of the transition state.
Te effect of translational and vibrational energies on the reaction efficiency and position of the TS can be explained by Polanyi's empirical rules. For an exothermic F + H2 reaction, the reaction barrier is usually located in the entrance valley of the reaction, that is, an early barrier. According to Polanyi's rules, reactant translational energy is then more effective than vibration to surmount the barrier to reaction, thus, accelerating the reaction rate. For an endothermic, H + HF, process a late transition barrier occurs, and hence the vibrational energy is more effective than translation to surmount the reaction barrier, thus, accelerating the reaction rate. 1
Great understanding of Polanyi's rule. how does relate to your trajectories studied? Mys18 (talk) 23:30, 24 June 2020 (BST)
References
- Yeston, J. (2012). Stretching the Polanyi Rules. Science, 338(6113), pp.1397–1397.
- Schramm, V.L. (2007). Enzymatic Transition State Theory and Transition State Analogue Design. Journal of Biological Chemistry, 282(39), pp.28297–28300.
- Levine, R.D. (1990). The steric factor in transition state theory and in collison theory. Chemical Physics Letters, 175(4), pp.331–337.

