MRD:01547559
Molecular Reaction Dynamics: Applications to triatomic systems- Poppy Tobolski
Exercise 1
NOTE- r1= BC distance, r2= AB distance, p1= BC momentum, p2= AB momentum. However, it doesn't matter because this is a symmetrical system.
Question 1: On a potential energy surface diagram, how is the transition state mathematically defined? How can the transition state be identified, and how can it be distinguished from a local minimum of the potential energy surface?
According to Hammond's postulate, the transition state resembles that of the reactants or products depending on which it is closer in energy to. In an exothermic reaction, the transition state is closer in energy to the reactants therefore, it resembles that of the reactants over the products. This is an early transition state. In an endothermic reaction the transition state is closer in energy to the products and so the transition state resembles that of the products. This is a late transition state.
TGood introduction - a reference for Hammonds postulate may help here Rs6817 (talk) 18:58, 4 June 2020 (BST)
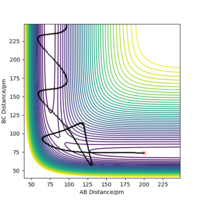
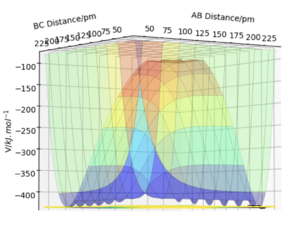
The transition state is mathematically defined as ∂V(ri)/∂ri=0, it's the point where the gradient equals zero. The transition state is at the local maximum within the well of minima, the saddle point. In the surface plot, there is a minimum path that connects the products to the reactants. The transition state can be identified as it is the maxima in this path, this is shown in figure 1.
At the transition state, the H atoms do not move because force is a derivative of the potential energy. Therefore, force is zero and so the atoms are stationary.
A second derivative will allow you to determine which direction the maxima and minima are in. Rs6817 (talk) 18:58, 4 June 2020 (BST)
Question 2: Report your best estimate of the transition state position (rts) and explain your reasoning illustrating it with a “Internuclear Distances vs Time” plot for a relevant trajectory.
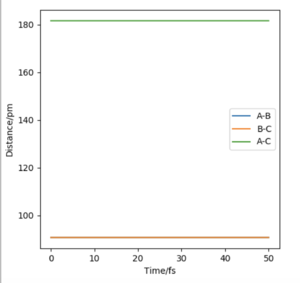
rAB= rBC=rts=90.77pm
When the distance between each of the H atoms equals this the force along the distances is very close to zero. Force is a derivative of the potential energy, and so when it equals zero it means the nuclei in the transition state are zero. It can be seen in figure 2 that the internuclear distance isn't changing with time when at the transition state, this is because the atoms are stationary.
Well described. Rs6817 (talk) 19:02, 4 June 2020 (BST)
Question 3: Comment on how the mep and the trajectory you just calculated differ.
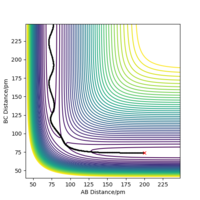
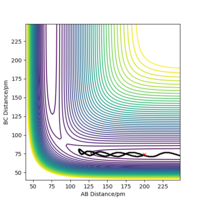
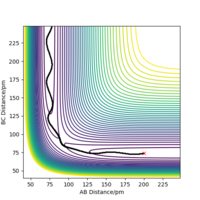
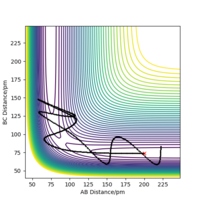
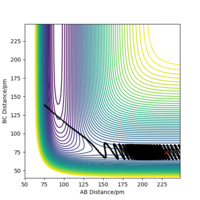
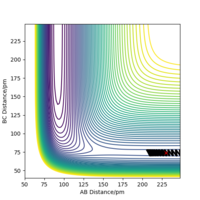
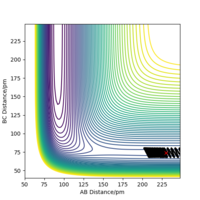
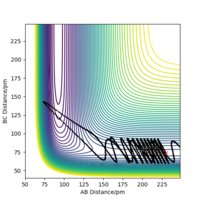
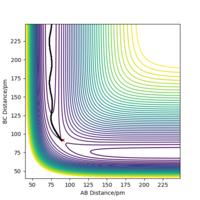
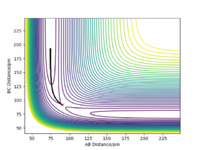
When the MEP calculation is used the path is straight, however, when the dynamic calculation is used the path becomes curved. This is because the molecule is oscillating, but in the MEP calculation this is being ignored. The velocity is zero in the MEP calculation, so the path follows the minima on the valley floor of the product. The MEP calculation is not as realistic as the dynamic calculation, this is because it doesn't take into account that the atoms have masses and in MEP calculation the molecules have uniform motion. Figures 3 and 4 show this on a contour plot.
I tihnk a little more information is required here on the differences between MEP and dynamics. Good description regardless. Rs6817 (talk) 19:04, 4 June 2020 (BST)
Look at the “Internuclear Distances vs Time” and “Momenta vs Time”. What would change if we used the initial conditions r1 = rts and r2 = rts+1 pm instead?
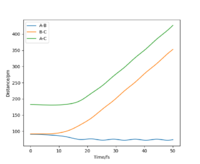
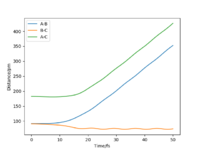
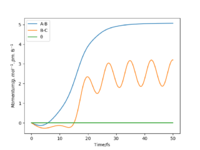
When looking at the internuclear distances vs time graph, when you swap r1 and r2 around, the graph follows the same trend except the lines for r1 and r2 change around. This is because now r1 decreases distance slightly as it becomes the H2 molecule with time and r2 increases distance with time as the H atom moves away. After about 15 seconds, the reaction has finished as r1 is just oscillating around the H-H bond distance and the other H atom has moved away fully. This is shown by figure 5 and 6. Again for the momenta vs time graph, when you change r1 and r2, the two lines in the graph follow the same trend but they are now swapped over. This is because now p2 increases over time and so the momentum of this H atom moving away increases faster and then plateaus once it has moved fully away and has no attraction to the molecule. For the H2 molecule the momenta oscillates. This is shown by figure 7 and 8.

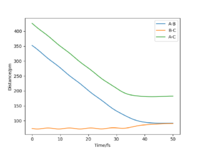
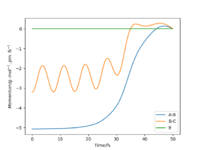
Setup a calculation where the initial positions correspond to the final positions of the trajectory you calculated above, the same final momenta values but with their signs reversed. What do you observe? To get the final positions the 'get last geometry' function was used. The final r1=74.04pm, r2=352.59pm, p1=-3.20g.mol-1.pm.fs-1 and p2=-5.08g.mol-1.pm.fs-1. Figures 9 and 10, show the internuclear distance vs time graph and the momenta vs time graph respectively. For the internuclear distance vs time graph the r1 distance increased to a maximum and the r2 distance decreased to a minimum over time. They increased and decreased to the distance at which the transition state is achieved so r1=r2=rts. For the momenta vs time graph, the p2 increased as the H atom approached the H2 molecule and then reached zero when the transition state was reached again. It continued to increase again as the r2 distance increased again. p1 also increased but in an oscillating fashion, it plateaued when momenta was zero for a bit, when in the transition state, and then over time increased again after the transition state had passed.
Question 4: Complete the table by adding the total energy, whether the trajectory is reactive or unreactive, and provide a plot of the trajectory and a small description for what happens along the trajectory. What can you conclude from the table?
A is the approach H atom and BC the H2 molecule
To conclude, in order for a reaction to occur there needs to be enough kinetic energy. Enough of this kinetic energy needs to be translational energy, if all the kinetic energy is vibrational energy of the reactants molecule then the reaction won't occur. Reaction 1 and 3 show that when p1 is higher the reaction will occur faster. Lastly, p1 and p2 need to both be large enough in order for them to collide and for a reaction to occur as shown by the 4th and 5th set of conditions.
Good descriptions in the table. Be careful with the descriptions with A / B / C etc as this can get a bit confusing. You have concluded the work well here. Rs6817 (talk) 19:09, 4 June 2020 (BST)
Question 5: Given the results you have obtained, how will Transition State Theory predictions for reaction rate values compare with experimental values?
Transition state theory assumes that if the reactants have enough energy the transition state will be reached and it will go on to form the products. However, even if there's enough kinetic energy, then it doesn't always mean a reaction will occur. This is shown by experimental values. The energy has to be spread correctly, for example as translational energy and not just vibrational energy of the molecule. Therefore, this will decrease the experimental rate because not all the kinetic energy is used as translational energy for the reaction.1
Transition state theory also assumes that once you go past the transition state and on to form the products that you cannot go back to form the reactants again. However, in experiment this is possible. Experiment 4 in the table above is an example of this, the reaction doesn't occur even though the transition state is reached. This also means the experimental rate is lower than predicted as not all the reactants will turn into products even if the transition state is reached.1
Good well answered. Rs6817 (talk) 19:13, 4 June 2020 (BST)
It also assumes that the reaction can be treated classically, but quantum effects do occur in experiment. For example quantum tunnelling, this increases the experimental rate compared to the prediction. 1
The transition state theory lastly assumes a quasi-equilibrium between the reactants and transition state.1 How much transition state you get is determined by how much reactant you have and so this determines how much product you will get. However, in experiment there may not be an equilibrium, and therefore, this would mean the experimental rate value would be higher than predicted.
The experiment in this case is representative of one particular momenta combination of atom and molecule. Rs6817 (talk) 19:13, 4 June 2020 (BST)
Exercise 2
Question 1/2: By inspecting the potential energy surfaces, classify the F + H2 and H + HF reactions according to their energetics (endothermic or exothermic). How does this relate to the bond strength of the chemical species involved? Locate the approximate position of the transition state.
A= F, B=H, C=H
F+H2. This reaction is exothermic, the energy of the reactants are higher than that of the products. This is an exothermic reaction because it forms stronger bonds in the products than those which are in the reactants, it forms HF which has a stronger bond than H2. More energy is released when the HF bond forms than is needed to break the H2 bond. This also means the transition state will be more similar to the reactants, it is an early transition state. Therefore, the transition state is near to when rHF=AB= 180.6pm and rHH=BC= 74.5pm. In figure 12, the minimum pathway on the right (BC) is for the reactant and the minimum pathway on the left (AB) is the product. Therefore, you can see the product energy is lower than the reactant energy and so it's exothermic. The enthalpy change for this reaction is -129 kJ.mol-1. Using the value of -4362 kJ.mol-1 for the H-H bond energy and -5653 kJ.mol-1 for the H-F bond energy.
Good referencing the figure here. Rs6817 (talk) 19:24, 4 June 2020 (BST)
HF+H. This reaction is endothermic, the energy of the reactants are lower than that of the products. HF has a stronger bond than H2, therefore, energy needs to be put into the reaction to break this bond and so the reaction is endothermic. More energy is needed to break the HF bond than is released when the H2 bond is formed. This means that the transition state will be more similar to the products, it is a late transition state. Therefore, the transition state is near when rHF=AB= 180.6pm and rHH=BC= 74.5pm. In figure 12, the minimum pathway on the right (BC) is for the product and the minimum pathway on the left is the reactant. Therefore, you can see the reactant energy is higher than the product energy and so it's endothermic.
The enthalpy change for this reaction is 129 kJ.mol-1. Using the value of -4362 kJ.mol-1 for the H-H bond energy and -5653 kJ.mol-1 for the H-F bond energy.
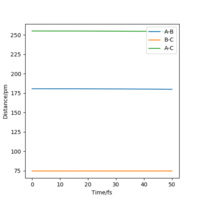
Both reactions have the same transition state as they are the same reactions just going in opposite directions. I found the transition by finding where the force equals zero and then checking using the internuclear distances vs time graph to see that the graph was zero. This can be seen in figure 11.
Make sure to name figures numerically as they are referenced in the text, here 11 follows from 12. Rs6817 (talk) 19:24, 4 June 2020 (BST)

Question 3: Report the activation energy for both reactions.
The activation energy can be determined by taking away the energy of the reactants from the transition state energy.
Using LEPS GUI and changing the distances of AB and BC, the energies for the H-F and H-H bonds can be determined. For the H-F bond energy I found to be -560.404 kJ.mol-1. This is similar to -5653 kJ.mol-1 which it says in literature. To find this energy, I set the AB distance as 91pm and the BC distance as 4000pm so that the H atom (C) is so far away it doesn't give any interaction on the HF bond. For the H-H bond energy I found it to be -435.057 kJ.mol-1, again this is close to the literature which was -4362 kJ.mol-1. To find this energy, I set the AB distance as 4000pm and the BC distance as 74.5pm.
Good description and compariing to literature. Rs6817 (talk) 19:24, 4 June 2020 (BST)
Activation energy of F+H2= -433.981--435.057=1.076 kJ.mol-1
Activation energy of HF + H= -433.981--560.404=126.423 kJ.mol-1
The activation energy can also be determined using an MEP calculation and slightly displacing the transition state towards the reactants, this is a more accurate method because in the above method we are assuming that moving the atoms far apart will give us pure reactants.
To determine activation energy of H2+F, the AB distance=182 pm and BC distance =74.5 pm. The number of steps was increased to 4000. There is a very small drop in the graph and so using the initial and final energies the activation energy can be determined. Figure 13 shows the energy vs time graph I used. Activation energy of F+H2= -433.981--434.144=0.163 kJ.mol-1
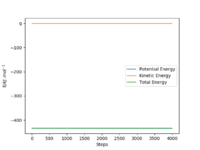
To determine activation energy of HF+H, the AB distance=180 pm and BC distance =74.5 pm. The number of steps was increased to 4000. There is a drop in the graph and so using the two horizontal lines the activation energy can be determined. Figure 14 shows the energy vs time graph I used. Activation energy of HF + H= -433.981--560.063= 126.082 kJ.mol-1
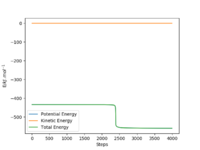
Overall both methods give very similar values for the activation energies of the reactions.
Very well done, great answer and good comparison. You have made it really clear how you determined the energies in both cases and the calculations are sound. Rs6817 (talk) 19:24, 4 June 2020 (BST)
Question 4: In light of the fact that energy is conserved, discuss the mechanism of release of the reaction energy. Explain how this could be confirmed experimentally.
Reaction conditions for a reactive trajectory of H2 + F are rHF= AB distance =180 pm, rHH= BC distance = 74 pm, pHF=AB momentum= -1.3 g.mol-1.pm.fs-1 and pHH= BC momentum= 0.3 g.mol-1.pm.fs-1. The number of steps is 3000.
The energy is conserved, therefore, the potential energy is converted to kinetic energy. This can be seen by the increase in oscillation in figure 15, once the transition state has been overcome and products starting to form. A large amount of the total energy goes to being vibrational energy of the product.1 The product molecule is oscillating lots therefore, can see that this is vibrational energy. Translational energy directs it to get over the potential energy barrier and then it can drop down and the energy becomes vibrational kinetic energy.
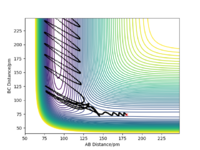
It can be confirmed experimentally as the reactants and products have different vibrational energy states, and so can be tested using IR spectroscopy. It can be checked by looking either at the emission or absorption of the molecules. For the reactants all the molecules are in the ground state, when it forms the products some of the molecules are excited, therefore, the some of the products are in the ground state and some in the first excited state. When looking at absorption, you can see for the reactants the molecules in the ground state will get excited to the first excited energy level. Therefore, there is only one transition and so there will be only one peak in the IR spectrum. For the products, two transitions can occur, the molecules in the ground state can be excited to the first excited energy level (fundamental transition), and the molecules that are already in the first excited state will be excited to the second excited state (this is an overtone). These two transitions absorb at two different wavelengths. The IR spectrum will now have the same peak as the reactants as well as a peak at a lower wavenumber. This second peak is at a lower wavenumber because the difference between the first and second state is smaller than the difference between the ground state and first excited state, this is due to the anharmonicity of the system. Overtime the intensity of this overtone will decrease and the intensity of the fundamental will increase as molecules fall back down to the ground state. For looking at emission, instead of the molecules being excited they will fall back to the ground state and so light is emitted. This time, the reactant IR will have no peaks as all molecules are already in the ground state. For the products, there will be one peak as the molecules in the first excited state drop back down to the ground state.
Chemiluminescence experiments can be run to study these reactions.1
Ok, I think you could have mentioned some other techniques away from IR Rs6817 (talk) 19:30, 4 June 2020 (BST)
Setup a calculation starting on the side of the reactants of F + H2, at the bottom of the well rHH = 74 pm, with a momentum pFH = -1.0 g.mol-1.pm.fs-1, and explore several values of pHH in the range -6.1 to 6.1 g.mol-1.pm.fs-1 (explore values also close to these limits). What do you observe?
The initial rHF distance= 230 pm. A=F B=H C=H
The trajectories show the incoming atom to the molecule, not vice versa. Rs6817 (talk) 19:30, 4 June 2020 (BST)
For the same initial position, increase slightly the momentum pFH = -1.6 g.mol-1.pm.fs-1, and considerably reduce the overall energy of the system by reducing the momentum pHH = 0.2 g.mol-1.pm.fs-1. What do you observe now?
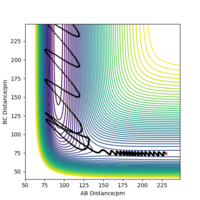
The reaction occurs. The vibrational energy of the products is much greater than that of the reactants, this can be seen in figure 16. This can be seen because the molecules in the product well oscillate more than the molecules in the reactant well. A lot of the potential energy has been converted to vibrational energy. The kinetic energy for this reaction is very low but, the amount of this that is vibrational is enough and in the correct direction in order for the reaction to occur. In this reaction the H2 molecule approaches F, the transition state is reached. H atom. (B) bounces between the F atom and H atom (C), eventually the H atom (C) moves away and the HF molecule forms.
Question 5: Discuss how the distribution of energy between different modes (translation and vibration) affect the efficiency of the reaction, and how this is influenced by the position of the transition state.
Polyani's rule is that vibrational energy is able to promote an endothermic reaction more efficiently than translational energy. This is because in an endothermic reaction it is a late transition state and so if translational energy is used to promote the reaction, then it will hit the potential energy barrier and bounce back, the products are higher in energy and so it can not be used to direct to them. Energy needs to be put in to get over the energy barrier. Using translational energy means the incoming atom will hit the molecule and just bounce back, it can't get over the energy barrier. This energy is not in the correct direction for a reaction to occur. If vibrational energy is used then the molecule will be oscillating in the correct direction for a reaction to take place and can pass over the energy barrier. Therefore, the vibrational energy is more efficient at promoting an endothermic reaction.
In an exothermic reaction, translational energy is more efficient than vibrational energy, it has an early transition state. This is because the energy is going down hill. The molecule can now move along the potential energy surface and once it gets to the transition state it can be guided around and move along in the correct direction to form the products. The translational energy directs the reactants to the products. In an exothermic reaction, the transition state is early and so the activation energy is much lower and so easier to get over the potential energy barrier, no energy needs to be put into the system. Therefore, it can just roll down using translational energy and so translational energy is more efficient for this reaction over vibrational energy. For an exothermic reaction, the energy is mainly changed from the translational energy to the vibrational energy of the products.1
Ok, am not sure if you are referring diretly to your table of results here. You have described Polanyis rules but have not grounded them within the F-H-H system. Rs6817 (talk) 19:36, 4 June 2020 (BST)
References
1. K. J. Laidler. Chemical Kinetics. 3rd edition. Harper Collins. 1987
2. Ch301.cm.utexas.edu. 2020. Bond Enthalpies. [online] Available at: <https://ch301.cm.utexas.edu/section2.php?target=thermo/thermochemistry/enthalpy-bonds.html> [Accessed 21 May 2020].
3. Chemistry LibreTexts. 2020. Bond Energies. [online] Available at:<https://chem.libretexts.org/Bookshelves/Physical_and_Theoretical_Chemistry_Textbook_Maps/Supplemental_Modules_(Physical_and_Theoretical_Chemistry)/Chemical_Bonding/Fundamentals_of_Chemical_Bonding/Bond_Energies> [Accessed 21 May 2020].

