MRD:01541238
The Molecular reaction dynamics computational lab report
Question 1. On a potential energy surface diagram, how is the transition state mathematically defined? How can the transition state be identified, and how can it be distinguished from a local minimum of the potential energy surface?
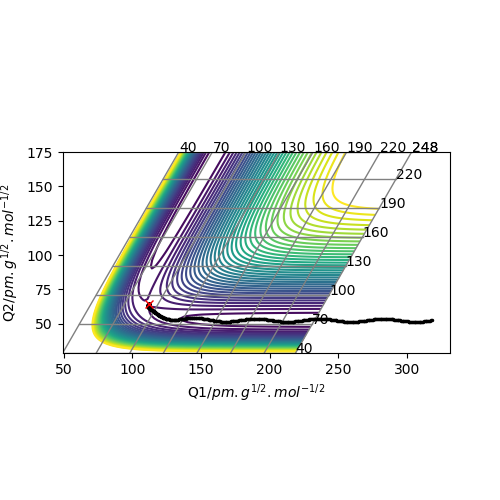
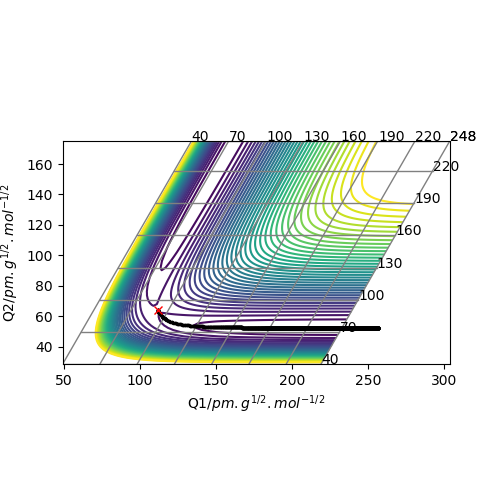
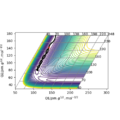
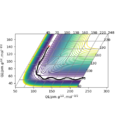
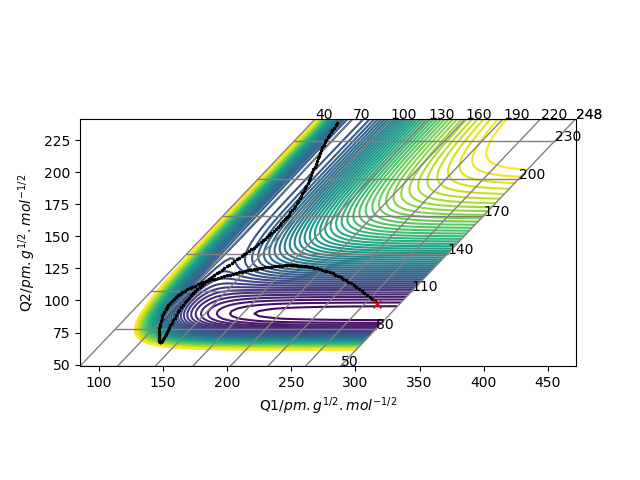
These two diagrams are the counter plot and skew plot from a three H atoms model. A H + H2 system.
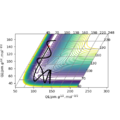
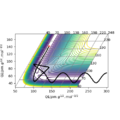
The transition state is the saddle point on the potential energy surface diagram (gallery 2). The black reaction trajectory line shows the minimum energy path of the reactants to the products.
When the trajectory line pass through the transition structure it shows a wavy line. And the transition state is defined as the maximum on the black trajectory minimum energy path.
Mathematically the transition state point has the special property that ∂V(ri)/∂ri=0 and the energy is higher than any other local minimum points on the minimum energy path.
And the transition state point is a critical point which can be identified by secondary derivative =0. The difference between local minimum is that they have a non zero second derivative number.
Ok but be careful with respect to what you mean by secondary derivative. You are looking for the secondary partial derivative of the reaction co ordinate with respect to the energy. Rs6817 (talk) 19:49, 4 June 2020 (BST)
Question 2. Report your best estimate of the transition state position (rts) and explain your reasoning illustrating it with a “Internuclear Distances vs Time” plot for a relevant trajectory.
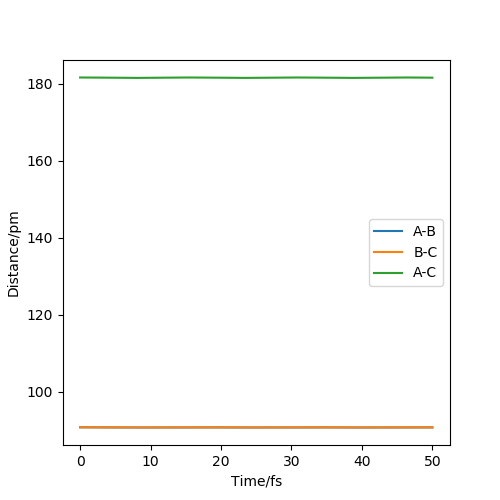
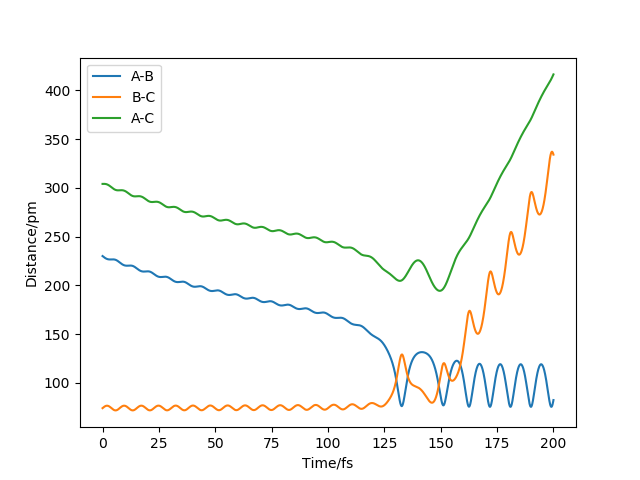
My best estimate of the transition state position r1 = r2 = 90.8 pm and p1 = p2 = 0.0 g.mol-1.pm.fs-1
According to the theory, when the structure is at transition structure, the trajectory point will only oscillate at on point.
The diagram above is the 'internuclear distance vs time' plot for my best estimation of the positions. As shown on the diagram, there is almost no oscillation of the bond distances between B-C and A-B which means
the structure is under a 'stable' state and this structure is called transition state structure.
Ok, what did you use to approximate this value or get closer to it? Rs6817 (talk) 19:53, 4 June 2020 (BST)
Question 3. Comment on how the mep and the trajectory you just calculated differ.
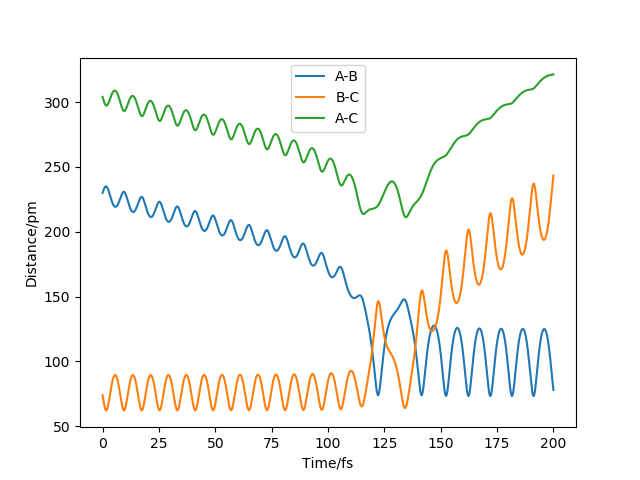
In my case, positions r1 = 91.8 pm, r2 = 90.8 pm and the momenta p1 = p2 = 0 g.mol-1.pm.fs-1 for the new trajectory calculated.
Compare with two diagrams, the MEP doesn't have the vibrations of the atoms during the process while the trajectory shows oscillation to the products. And other remains the same, both direct to the same product.
Ok, how do the calculation methods differ? The MEP resets the momentum to 0 with each step. Rs6817 (talk) 19:57, 4 June 2020 (BST)
Question 4. Complete the table below by adding the total energy, whether the trajectory is reactive or unreactive, and provide a plot of the trajectory and a small description for what happens along the trajectory. What can you conclude from the table?
For the initial positions r1 = 74 pm and r2 = 200 pm
| p1/ g.mol-1.pm.fs-1 | p2/ g.mol-1.pm.fs-1 | Etot/kJ mol-1 | Reactive? | Description of the dynamics | Illustration of the trajectory |
|---|---|---|---|---|---|
| -2.56 | -5.1 | -414.280 | reactive | Enough kinetic energy to overcome activation barrier. | |
| -3.1 | -4.1 | -420.077 | unreactive | Don't have enough energy to overcome the activation barrier, bounce
back to the more energy preferred state. | |
| -3.1 | -5.1 | -413.977 | reactive | Enough kinetic energy to overcome activation barrier. | |
| -5.1 | -10.1 | -357.277 | reactive | Enough kinetic energy to overcome activation barrier.
The energy is much higher than the previous ones. Cause the reaction reacts back and overcomes the transition states twice and back to the initial conditions. | |
| -5.1 | -10.6 | -349.477 | reactive | Enough kinetic energy to overcome activation barrier.
The energy is higher than the previous one. Cause the reaction reacts back and overcomes the transition states three times and complete the reaction. |
You could have described the trajectories with slightly more detail. Rs6817 (talk) 20:02, 4 June 2020 (BST)
The table above list some occasions for the different initial energies for the system. The table shows the energy is critically controlled in order to make the reaction complete.
The total energy can't be too low so that can't pass though the energy barrier or too high to bounce back even through the transition state point twice.
Ok, what energy prevents the stable formation of the products? Rs6817 (talk) 20:02, 4 June 2020 (BST)
Question 5. Given the results you have obtained, how will Transition State Theory predictions for reaction rate values compare with experimental values?
With compare with experimental values, the Transition State Theory predictions will be over-estimated. Transition State Theory assumes the transition state structure will not go back to the initial reactants since the transition
structure is formed. An equilibrium will form between the reactants and the transition states. However, in real life there is barrier recrossing cause the transition state structure goes back.
Be careful what you mean by 'real life', do you mean in reference the modelled system or an actual reaction? Rs6817 (talk) 20:04, 4 June 2020 (BST)
Moreover, the Transition State Theory is treated classically Quantum mechanical effect like tunnelling effect is ignored. In real situations, particles with lower kinetic energy might able to cross the high energy barrier caused
by tunnelling effect. Transition State Theory may overestimate the rate because it requires more energy to overcome the barrier.
You are correct that TST will overestimate the rate, but how do th results in the table relate to TST? Rs6817 (talk) 20:04, 4 June 2020 (BST)
Question 6. By inspecting the potential energy surfaces, classify the F + H2 and H + HF reactions according to their energetics (endothermic or exothermic). How does this relate to the bond strength of the chemical species involved?
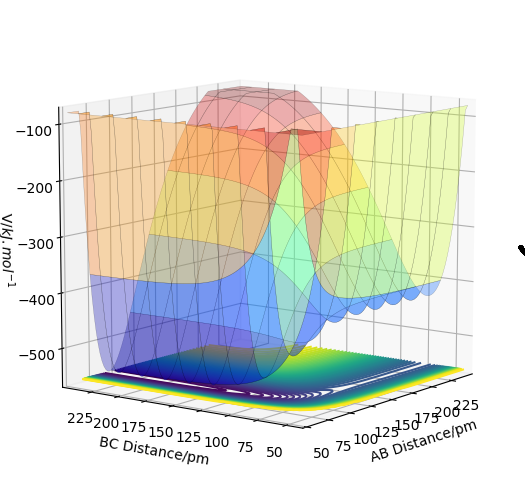
As shown in the diagram above, it is a potential energy surfaces for F + H2 system. The LHS is for HF energy level which is lower than H2 energy level on the RHS. Because the F-H bond is stronger than H-H bond for
F + H2 reaction is endothermic as stronger F-H bond formation required energy. Vice Versa, H + HF reaction is exothermic for strong H-F bond is broke.
I tihnk you may have misinterpeted the PES here. F + H2 is an exothermic reaction. Rs6817 (talk) 20:10, 4 June 2020 (BST)
Question 7. Locate the approximate position of the transition state.
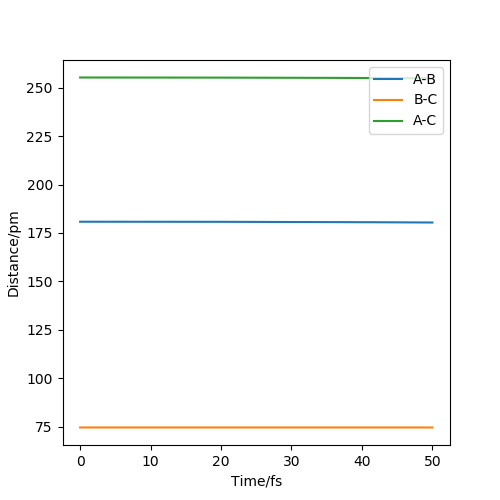
Diagram above is the 'internuclear distance vs time' for my estimated transition state structure.
My best estimated transition state positions are F-H = 180.8 pm and H-H = 74.5 pm when p1 = p2 = 0.0 g.mol-1.pm.fs-1
Ok, you need to make it clear how you calculated this or what you did to get closer to your answer. This answer is correct though, well done for including th einternuclear vs time. Rs6817 (talk) 20:12, 4 June 2020 (BST)
Question 8. Report the activation energy for both reactions.
For F + H2 reaction, the activation energy is the energy differences between reactant and transition state structure.
Ea=1.075 kJ/mol
For H + HF reaction,
Ea=126.682 kJ/mol
Similar to the previous comment, you need to make it clear how you determined the energy of the TS and reactant / product. You could have included an energy vs time plot to show this. Rs6817 (talk) 20:14, 4 June 2020 (BST)
Question 9. In light of the fact that energy is conserved, discuss the mechanism of release of the reaction energy. Explain how this could be confirmed experimentally.
For the F + H2 reaction. It is an exothermic reaction as the strong F-H bond formed. The potential energy will transfer to kinetic energy in order to complete the reaction.
This contradicts your last statement. Be careful with your classification. Rs6817 (talk) 20:21, 4 June 2020 (BST)
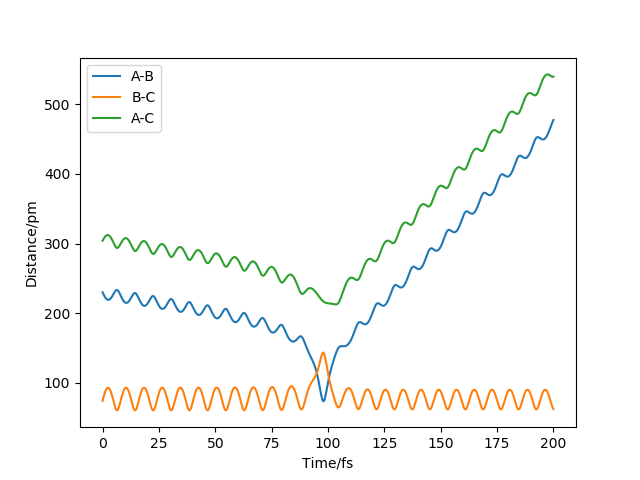
On diagram 1, the set is F-H = 230 pm and H-H = 74 pm when p1 = -1.0 p2 = 6 g.mol-1.pm.fs-1. It shows that F-H bond is formed then break apart. Potential energy is transferred to kinetic energy that cause the recrossing
barrier and go back to initial structure as the kinetic energy is too large.
What does diagram 1 refer to? Rs6817 (talk) 20:21, 4 June 2020 (BST)
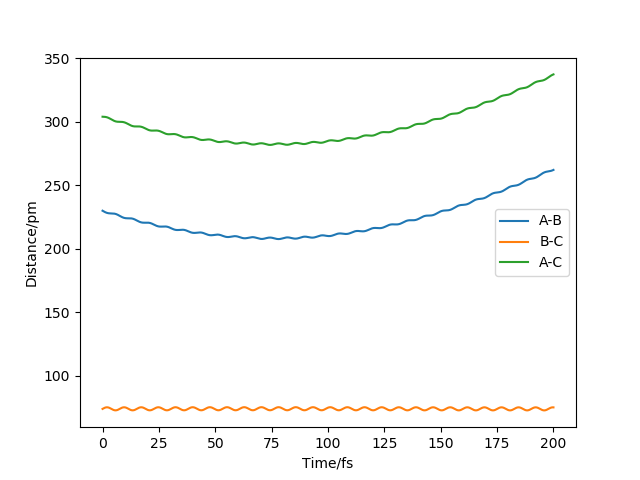
On diagram 2, the set is F-H = 230 pm and H-H = 74 pm when p1 = -1.0 p2 = 0 g.mol-1.pm.fs-1. The diagram clearly shows 0.526 kJ kinetic energy is transferred which is lower than Activation energy and the reaction can't
happen. F-H bond not formed.
On diagram 3, the set is F-H = 230 pm and H-H = 74 pm when p1 = -1.0 p2 = -6 g.mol-1.pm.fs-1. F-H bond is formed after several formation and breakage. A significant amount of potential energy transfer into kinetic energy
cause the oscillation for the middle H atom during the reaction.
On diagram 4, the set is F-H = 230 pm and H-H = 74 pm when p1 = -1.6 p2 = 0.2 g.mol-1.pm.fs-1. Kinetic energy is 1.707 kJ/mol overcomes the activation barrier and from the F-H bond.
On the reverse reaction H + HF, the initial set is H-H = 230 pm and H-F = 100 pm when p1 = -20 p2 = -1 g.mol-1.pm.fs-1. This diagram is one possible reactive trajectory for the reaction to complete. H atom carries 380.526 kJ/mol
to collide with H-F molecule and form new H-H bond.
In conclusion, the kinetic energy can be expressed as temperature. As the potential energy is transferred into kinetic energy, temperature will raise as the result of kinetic energy increases. Monitoring the temperature can help us
to confirm this mechanism processes.
You are correct but by what mechanism does the temperature raise and what temperature is raising? Calorimetry allows us to detect temperature, perhaps you could hve explained one of these methods. Rs6817 (talk) 20:21, 4 June 2020 (BST)
Question 10. Discuss how the distribution of energy between different modes (translation and vibration) affect the efficiency of the reaction, and how this is influenced by the position of the transition state.
Translational energy is due to the change in positions and states while vibrational energy is due to the change in structure of molecules. In fact, the translation energy is more effective in promoting reactions for system with early
barrier, whereas vibrational energy is more effective for reactions with late barrier. The position of the transition state is at the top of the activation energy barrier curve on a energy-process diagram. As a result, if the transition state
structure is similar to reactant (early barrier) translational energy is more effective. Vice Versa, if the transition state structure is more similar to the product (late barrier) vibrational energy is more effective. Moreover, symmetric
structure always have higher reaction rate and reactivity than unsymmetric structure.
How does an exo/endothermic reaction relate to Hammonds postulate and Polanyis rules? You may have been able to further explore this question with reference to the system you were studying which shows exo and endothermicity depending on the reaction direction. Rs6817 (talk) 20:25, 4 June 2020 (BST)
Your report may have been imrpoved with references, such as one to Polanyis rules. Rs6817 (talk) 20:25, 4 June 2020 (BST)


