MRD:01535442
Molecular Reaction Dynamics: Applications to Triatomic systems
In this report, we will be investigating the reaction dynamics of two triatomic systems, H-H-H and F-H-H. This includes investigation of their transition states, reaction coordinates and potential energy surfaces, and how these affect the outcome of chemical reactions.
Exercise 1: H + H2 System
On a potential energy surface diagram, how is the transition state mathematically defined?
∂V(ri)/∂ri=0 defines the point in the potential enrgy surface diagram where to gradient is zero, being defined as the maximum on the minimum energy curve.
How can the transition state be identified, and how can it be distinguished from a local minimum of the potential energy surface?
The transitions state can be identified by mapping trajectories near the supposed transition state, and observe whether the line goes towards the products or reactants. It can be distinguished from a local minimum by looking at the second derivative, which will be positive when the function is a local minimum, and negative if it is a maximum point.The second derivative at the TS is positive in one direction and negative in an orthogonal one, a local minimum has this as negative in all directions. Pu12 (talk) 01:07, 27 June 2020 (BST)
Report your best estimate of the transition state position (rts) and explain your reasoning illustrating it with a “Internuclear Distances vs Time” plot for a relevant trajectory
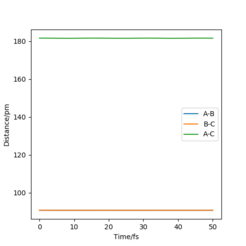
The best estimate for rts (the transition state position) is 90.9 pm. If you take a look at the internuclear distance vs time graph (Figure 1), it shows that across time, there is no oscillatory behaviour in the triatomic system that alters the distance from the rts, therefore 90.9 pm is the closest estimate for this position. Note that distance A-B and B-C are the same, so line A-B in the graph is behind line B-C.
Comment on how the mep and the trajectory you just calculated differ
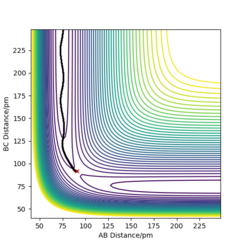
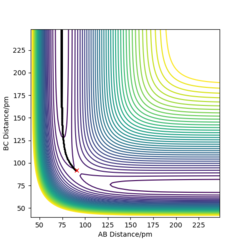
The minimum energy path or mep takes a path through the potential surface where it does not move up or down the contour, rather it takes the the path of lowest energy througout (see Figure 2). The trajectory calculated by dynamics (Figure 3) follows the same overall path as the mep, though it's much more wavy. This is due to the vibration of the diatomic molecule. Conservation of energy is present in both as the dynamic trajectory oscillates between the same energy contours. good. Pu12 (talk) 01:07, 27 June 2020 (BST)
Complete the table below by adding the total energy, whether the trajectory is reactive or unreactive, and provide a plot of the trajectory and a small description for what happens along the trajectory.
What can you conclude from the table?
In summary, the main influence on whether a trajectory will lead to a reaction is that the momentum p2 must be larger than p1, and around double the magnitude of p1. The higher that values of momentum, the higher the kinetic energy in the system and the higher the total energy becomes. But crucially, higher energy does not guaranty reactivity. João (talk) 19:23, 4 July 2020 (BST)
Given the results you have obtained, how will Transition State Theory predictions for reaction rate values compare with experimental values?
Transition state thoery predictions will likely overestimate the predictions for rate, as it assumes all of the reaction goes to completion due to boltzmann distribution (all molecules have enough kinetic energy). Yet, it doesn't consider barrier recrossing, where the bond in the product forms, but they may reverse if they have a high enough vibrational energyThis can happen due to excessive translational energy to - Polanyi's rules. Pu12 (talk) 01:07, 27 June 2020 (BST) . There is also the case that transition state theory treats energy classically, so ignores tunneling effects that could lower estimates. This effects is generally small, and is only really prevalent at low temperatures.[1]
Exercise 2: F - H - H System
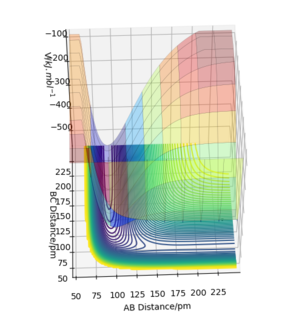
By inspecting the potential energy surfaces, classify the F + H2 and H + HF reactions according to their energetics (endothermic or exothermic). How does this relate to the bond strength of the chemical species involved?
F + H2
The reaction is exothermic, as the structure H-F is much more lower in energy, and there is noticable drop in the surface at the H-F product channel (Figure 4). The product formed, H-F, as bond energy of 565 kJ mol-1.[2] This is higher than the bond energy of H-H, thus the products will be lower in energy than the reactants.
H + HF
This reaction is endothermic, as H-H is much higher in energy than H-F, and there surface of the potential curve is higher in the H-H product channel (Figure 4). The product formed, H-H, as a bond energy of 432 kJ mol-1.[2] This is lower than the bond energy of H-F, thus the products should be higher in energy than the reactants. Good, but figure 5 would be more helpful if it was roateted so you can see the depth of the channels.Pu12 (talk) 01:07, 27 June 2020 (BST)

Locate the approximate position of the transition state
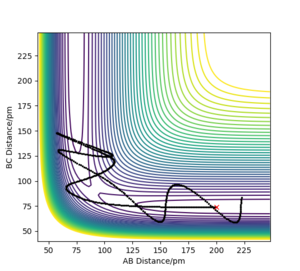
The transition state positions is approximately at distance H - H = 74 pm and F - H = 181.4 pm. Initially, Hammond's Postulate was recalled, which states that the transition state of a reaction resembles the species more higher in energy, in this case either the product or the reactant. As we are observing the F + H2 system, it is exothermic and and will resemble H2, the reactants. The bond length of H-H is reported to be 74 pm, so this was kept the same, as well as keeping the momentums at 0, to find the position (see Figure 6 for depiction).
Report the activation energy for both reactions
The activation energy for the F + H2 system is 1.032 kJ mol-1, and the for the H + HF system, the activation energy is -126.684 kJ mol-1. These were found by finding the difference between the potential energy of the transition state and the reactant, using both systems (F + H2 and H + HF) so the mep could be pathed (only to reactants).
Reaction Dynamics
In light of the fact that energy is conserved, discuss the mechanism of release of the reaction energy and explain how this could be confirmed experimentally
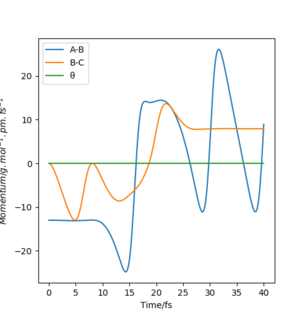
The reactive trajectory in this example is set by F - H = 230 pm, and H - H = 74 pm, with respective momentums being -13 and 0. In Figure 6, the momentum vs time graph of this system is displayed, where A-B = F - H, and B-C = H - H. Initially, F - H has translational energy which enables it to move, and H - H has vibrational energy and is oscillating. Then, once the collision occurs, the momentums become postive, as the newly formed products move away. Now, F - H bond has vibrational energy, and it oscillatory behaviour is large, and the H - H momentum steadies as H moves away with translational energy. This can be confirmed by analysis of chemiluminescence and possibly IRUnlikely that there will be light released, Ir would be used to measure changes in vibration and calorimetry can measure changes in translational energy. Pu12 (talk) 01:07, 27 June 2020 (BST) .
Discuss how the distribution of energy between different modes (translation and vibration) affect the efficiency of the reaction, and how this is influenced by the position of the transition state
The distributions of energy is influenced by the strength of both translational modes and vibrational modes. The biggest component to the favourability of the modes is the position of the transition state in the potential energy surface. If a reaction has a late transition state (occurs in product channel), then high translationalOther way around, vibrational for late TS. Pu12 (talk) 01:07, 27 June 2020 (BST)
energy trajectories will lead to succussful reactions. Yet, if a reaction has an early transition state (occurs in reactant channel), will favour vibration excitation of the molecule leading to a reactive trajectory.[3]
Biliography
- ↑ Steinfeld, Jeffrey I, (1999) Chemical kinetics and dynamics, Prentice-Hall, p. 287-321
- ↑ 2.0 2.1 Huheey, pps. A-21 to A-34; T.L. Cottrell, "The Strengths of Chemical Bonds," 2nd ed., Butterworths, London, 1958
- ↑ Steinfeld, Jeffrey I, (1999) Chemical kinetics and dynamics, Prentice-Hall, p. 272-274


