MRD:01533336yg8818
Molecular Reaction Dynamics Lab Report
H and H2 System
The transition state of a reaction is defined as a point on the minimum energy path between reactants and products where the derivatives in all orthogonal directions are zero. Mathematically, the transition state, or saddle point, is recognised by computing the function's Hessian matrix at that point. If the Hessian matrix is indefinite, the point must be a saddle point. The saddle point can be distinguished from an energy minimum point, as ∂2V/ ∂r1 > 0 and ∂2V/ ∂r2 > 0 in both orthogonal directions of a minimum point, indicating a stable region of reactants or products.
Answer unclear, what derivatives? Show partial derivatives as an aid to your answers which is at the saddle point when equal to zero. Also, second partial derivative missing r squared but distinction between local minimum and saddle point is good Sf3014 (talk) 18:45, 18 May 2020 (BST)
The reaction studied here is one in which a hydrogen atom collides with a hydrogen molecule to form a new hydrogen molecule plus a hydrogen atom. This is one of the simplest systems to study, as the bimolecular collision contains only three protons and three electrons. r1 denotes the distance between atom 1 and atom 2 and r2 is the distance between atom 2 and atom 3.
The transition state of the reaction between a single hydrogen atom, H, with diatomic hydrogen, H2, must occur when the interatomic distances are equal. This is because the reaction is neither exothermic or endothermic in nature. The transition state must not be late nor early, but directly equidistant between reactants and products. As a result, r1 must be equal to r2 and their momenta zero as well. With no oscillation, the gradient, force and acceleration of the particles must also be zero at the transition state.
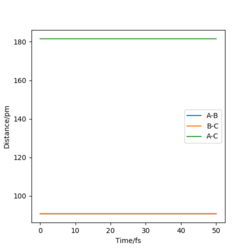
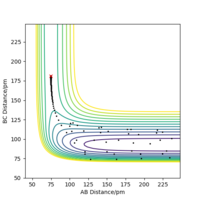
When r1 = r2 = 90.775 pm, the above conditions are met and the transition state is observed. This is visible as a single point on the surface plot and as straight lines with no oscillations on the Interatomic Distances vs Time plot, as shown in Figure 1 (left).
Very good description. Sub heading would be great Sf3014 (talk) 18:52, 18 May 2020 (BST)
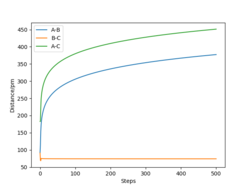
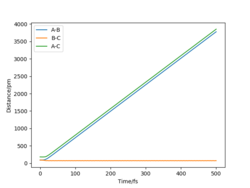
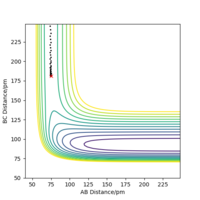
Now that the transition state has been located, the reaction path, which is the Minimum Energy Path (MEP), can be determined. This is a trajectory that corresponds to infinitely slow motion of the particles and can be found by slightly altering the value of one of the interatomic distances. Here, r1 is set equal to 91.775 pm, just 1 pm higher than used for finding the transition state. This trajectory is modelled in Figure 2 (right).
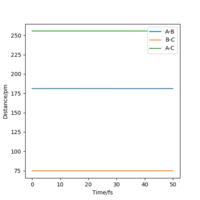
The MEP doesn't account for mass and inertial motion of the atoms. While this provides a useful simplification, the model does not accurately reflect how the particles move during the reaction. This can be resolved by maintaining the current parameters, but using a dynamic calculation type for the interatomic distances vs. time plot. This is displayed in Figure 3 (right). Altering the distance for r2 instead of r1 would yield the same results.
Answer unclear, what evidence shows that the mep calculation "doesn't account for mass and inertial"? You needed to use the appropriate graphs and explain through your observations. Also, missing sub-headings which makes it difficult to navigate. Sf3014 (talk) 19:09, 18 May 2020 (BST)
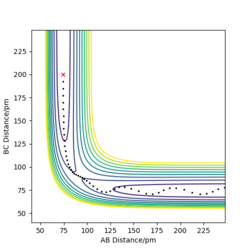
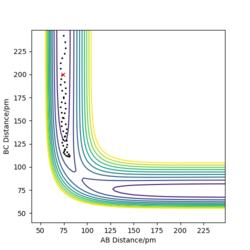
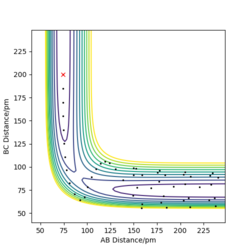
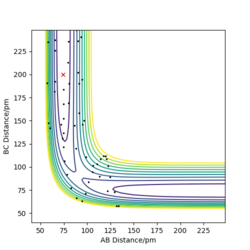
Trajectories with initial conditions in the range r1 = 74 pm, r2 = 200 pm, with -3.1 < p1/ g.mol-1.pm.fs-1 < -1.6 and p2 = -5.1 g.mol-1.pm.fs-1 have shown to be reactive in the above calculations. Here, higher values of momenta have been trialled, while keeping the position values the same, in determining whether the species will still be reactive and the appearance of the trajectory. The results are displayed in Table 1 below.
It can be inferred from Table 1 that an increase in potential (and hence kinetic energy), for either distance, results in molecules with greater oscillation. If the potential energy is too low, transition state won't be reached. If the kinetic energy component is too large, oscillations can interfere with the reaction, resulting in a return to reactants even after the saddle point has been crested. A balance found between the two is essential for reaction to occur.
Good description and conclusion. Minor mistake on final reaction which does not proceed according to contour plot but description supports it. Conclusion can benefit from referring to reactions in table Sf3014 (talk) 19:21, 18 May 2020 (BST)
These calculations can be compared to values predicted by transition state theory. Transition state theory complies with several key assumptionsː
- The energy of the particles in the reaction follows the Boltzmann distribution
- The reactants are in constant equilibrium with the transition state structure
- Effects of quantum tunnelling are negligible[1]
- Motion along the reaction coordinate can be separated from other motions and treated classically at the transition state
- Once the transition state has been achieved, the reactants will not reform
This final assumption has shown to be untrue in some circumstances, as in the last example studied (Table 1). Transition state theory does not account for barrier recrossing which is observed frequently in experiment. This could result in transition state theory predicting reactions to have a faster rate than experiment, as a slower rate would be observed with barrier recrossing.
Ignoring effects of quantum tunnelling (as mention above) assumes that the reaction will not take place unless sufficient activation energy is reached to overcome the transition state. However, according to quantum mechanics, particles can still tunnel across the barrier, if the barrier is of finite energy. In experiment, molecules will react sometimes, even if they do not collide with enough energy to scale the transition state barrier. This is an important feature for reactions with small activation energies (tunnelling probability decreases with increasing barrier height) and should not be ignored. Transition state theory will therefore predict that some reactions won't occur, while they may occur successfully in experiment.
In its calculation of reaction rate, transition state theory is limited for reactions occurring at high temperatures.[2] The theory assumes that the system will traverse the lowest energy saddle point on the potential energy surface, which is not always true for systems at high temperatures. At high temperatures, molecules will populate higher energy modes and transitions states will be crosses that are far from the lowest energy saddle point. This can even be observed in this very collision of H with H2 when the experiment is conducted at increased temperatures.
A combination of all of these factors results in transition state theory falling short, in some cases, in its prediction of reaction rate.
Very detailed description and link to table. Sf3014 (talk) 20:46, 18 May 2020 (BST)
F - H - H System
Inspection of the potential energy surfaces for the reactions of F with H - H and H with F - H can be used to classify their energetics; determining if they are exothermic or endothermic reactions. Exothermic reactions have 'early' transition states, as the structure of the transition state closely resembles that of the reactants. Endothermic reactions have 'late' transition states, as the structure of the transition state closely resembles that of the products. This is based on Hammond's Postulate [3] which asserts that if two states (eg. a transition state and an intermediate) occur consecutively in a reaction and have nearly the same energy, their interconversion will only involve a small reorganisation of molecular structure.
The reaction of F with H - H has an early transition state (Figure 4) rendering it an exothermic reaction; the transition state close in position to the reactant bond lengths. Meanwhile, when H collides with F - H, a late transition state is observed (Figure 5) indicating an endothermic reaction where the saddle point lies close to the product bond lengths. This can be explained by the bond strength of H - F, which takes a value[4] of 565 KJ mol-1. This is much greater than the bond energy[5] of H - H which is 432 KJ mol-1. More energy is required to break the H - F bond than is released in forming the H - H bond.
Very good use of external sources (note: references should be at the end of the information, ie after bond energy) but referring to figure 4 doesn't show where the transition state lies if it isn't highlighted in the image. So, your description for a specific direction being exo- or endo-thermic is not clear Sf3014 (talk) 20:56, 18 May 2020 (BST)
The transition state is found when H - F = 181.000 pm and H - H =74.489 pm, with momenta set to zero for both. The Internuclear Distance vs Time graph (Figure 6) illustrates this well, as a straight line on the plot with no oscillations, characteristic of a transition state.
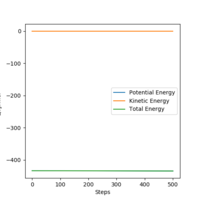
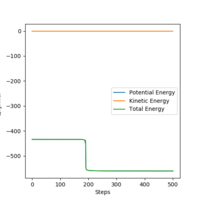
The Minimum Point Energy (MEP) from the H-H-F transition state can be used to plot a graph of Energy vs Time. Calculation of the activation energy can be performed from this by subtraction of the total energy of the products from the reactants (difference between the maximum energy of the saddle point and the minimum energy of the products). For the formation of HF from H2 and F, the activation energy is - 433.979 - - 434.716 = + 0.737 KJ mol-1.This is illustrated in Figure 7, while this slight drop in potential energy is highlighted in Figure 8. The activation energy for the formation of H2 from HF and H is - 433.200 - - 556.513 = + 123.313 KJ mol-1, as shown in Figure 9. This is all consistent with the bond strengths of H - F and H - H mentioned above.
Good, very clear description for calculating activation energy Sf3014 (talk) 21:15, 18 May 2020 (BST)
When reaction conditions are set, such that A = H, B = H and C = H, with rAB = 80 pm, rBC = 200 pm, pAB = 1 g.mol-1.pm.fs-1, pBC = -1.5 g.mol-1.pm.fs-1 a successful reaction is observed for the formation of HF (Figure 10). Figure 11 displays the Momenta vs Time plot which shows a vast increase in the magnitude of the vibration of the H - F bond, compared to the initial H2 molecule. This increase in kinetic energy would be categorised by a large increase in temperature in experiment.
Good observation but more details needed in your explanation, ie by concluded this paragraph in terms of conservation of energy. Also, how can this increase in temperature be measured experimentally? Sf3014 (talk) 21:30, 18 May 2020 (BST)
 |
 |
Vibrational and translational kinetic energy of a reaction can be linked using Polyani's Rules[6]. These rules declare that a reaction with an early transition state will be favoured by lower vibrational motion in the promotion of a successful reaction. Conversely, if a reaction has a late transition sate, vibrational energy is more efficient in achieving a successful reaction. For the formation of HF from H2 and F, little vibrational energy and only a slight amount of translational energy of the H2 molecule is required as a result of the exothermic reaction's early transition state. Equally, in the reverse endothermic reaction to form H2 from HF and H, high vibrational energy is necessary due to the late transition state of the reaction.
Good. More description could be given from the use of examples Sf3014 (talk) 21:30, 18 May 2020 (BST)
References
Template loop detected: Template:Reflist
- ↑ Eyring, H. (1935). "The Activated Complex in Chemical Reactions". J. Chem. Phys. 3 (2): 107–115. Bibcode:1935JChPh...3..107E. doi:10.1063/1.1749604.
- ↑ Pineda, J. R.; Schwartz, S. D. (2006). "Protein dynamics and catalysis: The problems of transition state theory and the subtlety of dynamic control". Phil. Trans. R. Soc. B. 361 (1472): 1433–1438. doi:10.1098/rstb.2006.1877. PMC 1647311. PMID 16873129.
- ↑ Fox MA, Whiteshell JK (2004). Organic Chemistry. Sudbury, Massachusetts: Jones and Bartlett Publisher s. pp. 355–357. ISBN 978-0-7637-2197-8.
- ↑ http://www.wiredchemist.com/chemistry/data/bond_energies_lengths.html
- ↑ http://www.wiredchemist.com/chemistry/data/bond_energies_lengths.html
- ↑ J. Phys. Chem. Lett. 2012, 3, 23, 3416-3419 Publication Date:November 6, 2012 https://doi.org/10.1021/jz301649w Copyright © 2012 American Chemical Society

