MRD:01533249
General comment - Well done with this wiki, I see you have understood well and used appropriate examples and references to support your responses to the questions. See my comments about MEP calculation although I think this was discussed in the lab script also. A really well written report overall. Mak214 (talk) 09:30, 22 May 2020 (BST)
Excersise 1 H + H2 system
Transition State
On a potential energy surface diagram, how is the transition state mathematically defined? How can the transition state be identified, and how can it be distinguished from a local minimum of the potential energy surface?
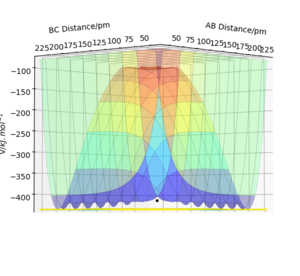
The transition state is the saddle point on the potential energy surface plot.[1] It is the maximum energy point on the reaction pathway but on the path orthogonal to the reaction pathway it is a minimum. It is mathematically defined as the point at which dV/dr = 0, (the gradient is zero), with a negative second derivative in direction of the reaction pathway an positive second derivative orthogonal in direction to the reaction pathway. It can be therefor distinguished from local minima by looking at the second derivatives. If the geometry of the transition state was made, where each component had zero momentum, it would remain at that point and not roll down to the reactant or product valley.
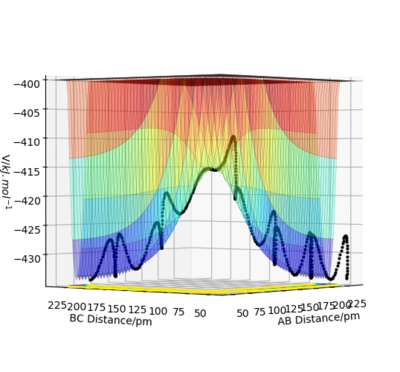
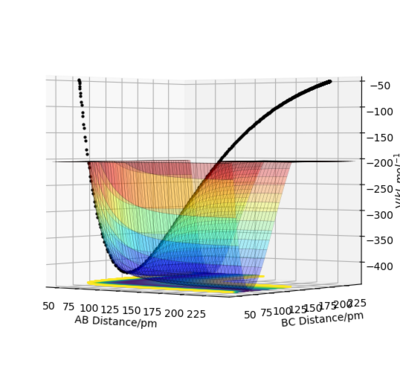
Great! These images make your explanation really clear. Thanks. Mak214 (talk) 09:06, 22 May 2020 (BST)
Report your best estimate of the transition state position (rts) and explain your reasoning illustrating it with a “Internuclear Distances vs Time” plot for a relevant trajectory.
In this set up, HA + HB-HC the system is symmetrical and therefore the distance between the atoms at the transition state is the same for both atoms rAB=rBC. The transition state can be found by looking for the point at which the forces along both the HA-HB and HB-HC bonds is = 0 kJ.mol-1.pm-1. On a surface plot, it the energy maximum on the minimum energy path of the reaction.
It can also be identified as the positions at which there is no change in distance over time. The Internuclear Distances vs Time plots would therefore have 2 straight lines each with a gradient of zero.
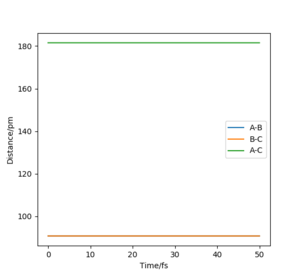
The transition state position was found by the trial and error technique, changing the r values between a range of 80 and 100 pm, whilst rAB=rBC and the momentum of each molecule was 0.0 g.mol-1.pm.fs-1. rts was found to be 90.777 pm. The range of r values to test was chosen by visualising approximately where the rts was on a contour plot,
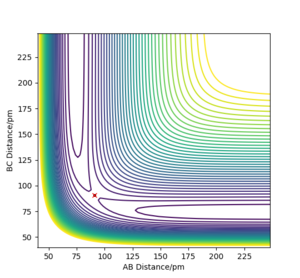
Good. Mak214 (talk) 09:06, 22 May 2020 (BST)
MEP and Dynamic Trajectories
Comment on how the mep and the trajectory you just calculated differ.
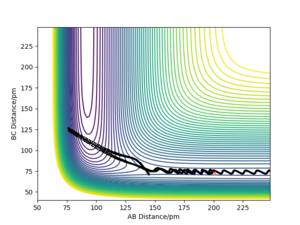
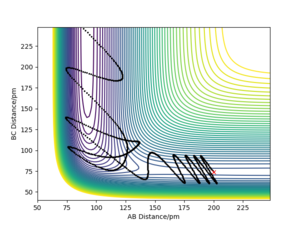
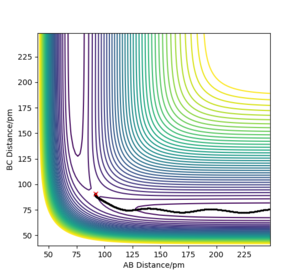
With the new initial conditions the system is displaced from the transition state with rAB=rts + 1 pm and rBC= rts. This means that the length of the rBC is now longer hence the transition state was overcome and the reaction 'rolls' to the products, as the length of the rAB increases, as seen in the contour plot. The MEP calculation contour plot shows the increase of rAB in a straight line, opposed to the dynamic calculation contour plot which shows it as an oscillating line. The oscillating line is the vibrations of the HB-HC bond due to the release of energy as the bond forms. Good. Mak214 (talk) 09:15, 22 May 2020 (BST)
The fact that the MEP calculation doesn't see the HB-HC bond as vibrating, suggests the energy released from the formation of the bond is not conserved. This can also be viewed clearly in the Distances vs Time plots, in the MEP plot the B-C (orange) line is flat whereas in the Dynamic plot the B-C (orange) line is oscillating.
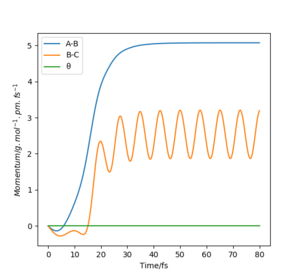
The trajectories can also be looked at through a Momentum vs Time plot; although the initial conditions start with no momentum, they are just off set of the transition state, an energy maximum, and their end trajectory is the energy minimum (the products in this case) therefore they start with a degree of potential energy and this must be lost and turned into kinetic energy (momentum). This is followed in the dynamic calculations plot however the MEP calculations plot do not conserve energy hence there is a no change in momentum observed. Because MEP resets the momentum to 0 at every step taken! The only thing governing where the MEP trajectory will go to next is the gradient of the potential energy surface at the current point. It travels to the nearest minimum only. Mak214 (talk) 09:11, 22 May 2020 (BST)
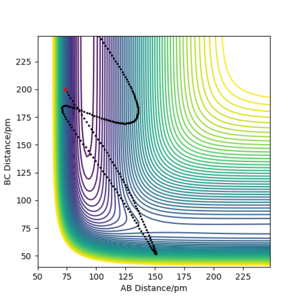
If the final geometry of contour plot system is used with the momentum signs reversed on a dynamic calculation the trajectory ends back at the starting position just offset of the rts. Does it? Did you show evidence of this? Mak214 (talk) 09:15, 22 May 2020 (BST)
However if this same calculation is done in MEP calculation the trajectory continues in the same direction.
| MEP | Dynamic | |
| Contour | 
|
|
| Distance vs Time | 
|

|
| Momentum vs Time | 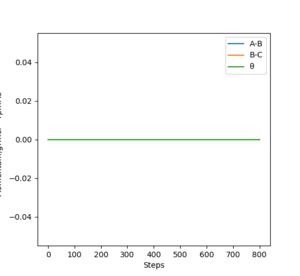
|
|
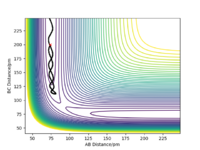
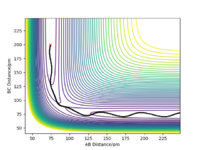
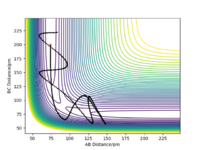
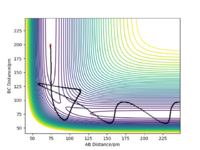
Complete the table above by adding the total energy, whether the trajectory is reactive or unreactive, and provide a plot of the trajectory and a small description for what happens along the trajectory. What can you conclude from the table?
The conclusion is that the sufficient momentum is required to reach the energy barrier of the transition state however and excess of momentum can result in the product having to much energy and the bond dissociating and the reactants forming again as in Case 4. Great, well done. Mak214 (talk) 09:16, 22 May 2020 (BST)
Transition State Theory
Given the results you have obtained, how will Transition State Theory predictions for reaction rate values compare with experimental values?
The Transition state theory is that in order for reactants to turn into products they must first pass through a higher energy state form. One of the assumptions of transition state theory is that once reactants have passed the transition state and the product has been formed they cannot revert back to the reactants.[2] This rule is not followed in Case 4 (above), where the products are formed however they then reform the reactants. This would therefore result in an overestimate in the rate of the reaction of the as the product would be expected to form whereas in reality they are not. Great answer. Mak214 (talk) 09:19, 22 May 2020 (BST) Another assumption is transition state theory is a classical theory [2] and all the molecules behave in such way. Hence such effects such as quantum tunnelling are ignored, this would result in an understatement of the rates, however the effect is so small it isn't seen ...in this particular case. Mak214 (talk) 09:19, 22 May 2020 (BST) .
Well done.. Mak214 (talk) 09:19, 22 May 2020 (BST)
Exercise 2: F-H-H system
PES inspection
By inspecting the potential energy surfaces, classify the F + H2 and H + HF reactions according to their energetics (endothermic or exothermic). How does this relate to the bond strength of the chemical species involved?
The F+H2 reaction will be exothermic and the H+HF reaction will be endothermic. When looking at the surface plot it is clear that the H-F bond is at a lower energy compared to the H-H bond. The H-F bond is lower in energy as it has a stringer bond. The strength of the bond is due to the large difference in electronegativity of the atoms. Good Mak214 (talk) 09:23, 22 May 2020 (BST)
Locate the approximate position of the transition state.
The approximate position of the transition state is rHF = 181 pm and rHH is 74.5 pm. (both momentums are set to zero).This was a point at which no reaction or movement occurs on the surface plot. It can be confirmed by looking at the Internuclear Distances vs Time plot, where the gradients of the lines is zero as the transition state is stable. Yes, well done. Mak214 (talk) 09:23, 22 May 2020 (BST)
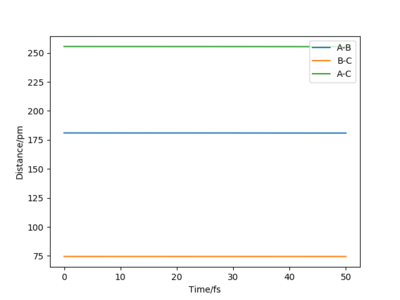
Activation energy
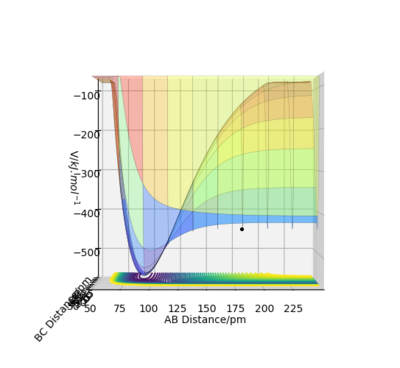
The activation energy can calculated by looking at the Energy vs Time plot of a position offset of the transition state.
The activation energy required for the H+HF reaction is 126.17 kJ.mol-1, values taken from figure 1 below. The positions are n this case rHF = 165 pm and rHH is 80 pm. This is a large activation energy as the reaction is endothermic and energy is required to reach the transition state. The transition state is closer in structure to the products in this case
Activation energy = -432.61 - (-558.78)
The activation energy required for the H2 + F reaction is 2.41 kJ.mol-1 the values is taken from figure 2 below. The positions in this case rHF = 90 pm and rHH is 165 pm. This is small activation energy as the reaction is exothermic and little energy is required to make the reaction start. The transition state is close in structure to the reactants in this case.
Activation energy = -433.64 - (-436.05)

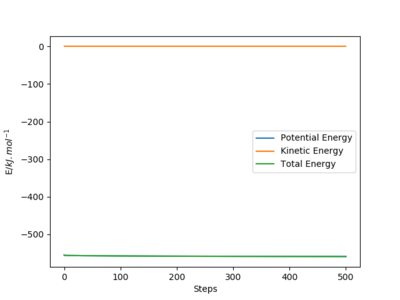
Nicely exemplified. Mak214 (talk) 09:23, 22 May 2020 (BST)
Reaction Dynamics
In light of the fact that energy is conserved, discuss the mechanism of release of the reaction energy. Explain how this could be confirmed experimentally.
The initial geometry required for a trajectory is rFH = 175 pm and rHH is 80 pm, and the momentums are pFH=-0.5 g.mol-1.pm.fs-1 and pHH=0.0 g.mol-1.pm.fs-1. The energy released from the formation of the low energy H-F bond is conserved in the vibrating (K.E. energy) of the H-F bond, this can be seen in a Momentum vs Time plot, where after the reaction there is an oscillating motion in the change of momentum of F-H bond (blue line).
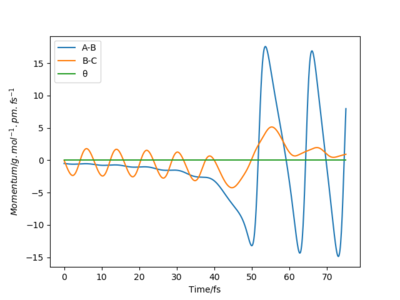
The amount if energy released can be calculated experimentally using 'Bomb Calorimetry', this tests for a change in temperature produced by the release in energy. [3] However this experiment cannot distinguish between the translational and vibrational energy produced. The vibrational energy can be monitored experimentally using chemiluminescence where the rotational and vibrational population distribution can be seen by analyse of Infrared chemiluminescence intensity.[4] Very nice answer, thank you. Mak214 (talk) 09:27, 22 May 2020 (BST)
Reactive and unreactive trajectories
Polanyi's rule states that the vibrational excitation in the products is enhanced by early release of the reaction energy in the reactants valley of the potential energy surface.[5] It therefore suggests that the reactions with a transition state closer to the reactants will be promoted by translational excitation of the products. Reactions with the transition state closer to the products will be promoted best by vibrational excitation of the reactants. This can be joined with Hammonds postulant, that exothermic reactions the transition state is closer to the reactants and in endothermic reactions the transition state is closer to the products.[6] Together we can tell that in order to promote exothermic reactions translation excitation of the products will promote the reaction. In order to promote endothermic reactions vibrational excitation of the reactants should promote this reaction. Well explained, thank you. Mak214 (talk) 09:27, 22 May 2020 (BST)
H2 + F
HF + H
References
- ↑ Atkins, P. and De Paula, J., 2014. Atkins' Physical Chemistry. 10th ed. Oxford: Oxford University Press, p.71.
- ↑ 2.0 2.1 Brouard, M., 1998. Reaction Dynamics. [S.l.]: Oxford University Press, p.49.
- ↑ Atkins, P. and De Paula, J., 2014. Atkins' Physical Chemistry. 10th ed. Oxford: Oxford University Press, p.71.
- ↑ Karabulut, E. and Sidir, İ., 2018. The analysis of HF molecule by means of infrared transitions in H + F2 collinear scattering on two different potential energy surfaces. Chemical Physics Letters, 709, pp.103-109.
- ↑ Brouard, M., 1998. Reaction Dynamics. [S.l.]: Oxford University Press, p.37..
- ↑ Scala, A., 2004. Free Radical Halogenation, Selectivity, and Thermodynamics: The Polanyi Principle and Hammond's Postulate. Journal of Chemical Education, 81(11), p.1661.


