MRD:01533219
Overall great report! Each section has been discussed demonstrating great understanding. Mys18 (talk) 00:01, 25 June 2020 (BST)
Molecular Reaction Dynamics
H + H2 System
Dynamics from the transition state region
1. On a potential energy surface diagram, how is the transition state mathematically defined? How can the transition state be identified, and how can it be distinguished from a local minimum of the potential energy surface?
Mathematically, a transition state is a maximum point on the plot i.e. the first derivative of energy with the respect to position is zero and the second derivative is negative. Because it's second derivative is negative it can be distinguished from a local minimum as the local minimum will have a positive second derivative.
Fuller answers may help make this part clearer. TS is a maximum along a minimum energy pathway. True, you can use second derivatives to distinguish between the two. Local minimum will always be a positive value in all directions. However a TS can be identified as a saddle point on a PES (check it out!) so that means its second derivative will indeed be negative BUT also positive - your task now is to research how this is possible (hint...all to do with directions). Mys18 (talk) 23:39, 24 June 2020 (BST)
2. Report your best estimate of the transition state position (rts) and explain your reasoning illustrating it with a “Internuclear Distances vs Time” plot for a relevant trajectory.
Transition state occurs when r1=r2. Due to the nature of the transition state explained above, if one starts a trajectory at the transition state, with both momentums being equal to zero (p1=p2=0), it will remain there and never fall off. There is also no vibrational motion. Using Internuclear Distance vs Time plot (figure 1) it was estimated that rts is about 90.8 pm.
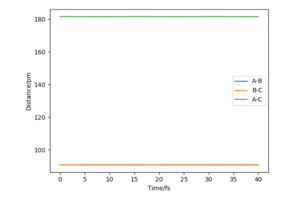
Great figure. Mys18 (talk) 23:45, 24 June 2020 (BST)
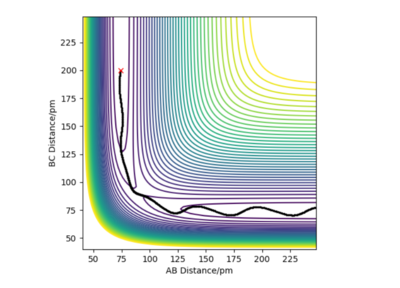
3. Comment on how the mep and the trajectory you just calculated differ. Reaction path when r1=rts+1 and r2=rts can be plotted using two ways: MEP or Dynamic Method. In the calculation of the MEP velocities are reset to zero each step which results in a shorter path compared to dynamic method. Also unlike MEP, the dynamic method takes into the account the oscillations of the molecule.

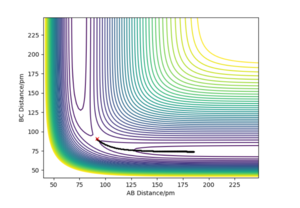
And we see that perfectly in your figure where it is more 'wavy' for dynamic than MEP. Mys18 (talk) 23:45, 24 June 2020 (BST)
Reactive and unreactive trajectories
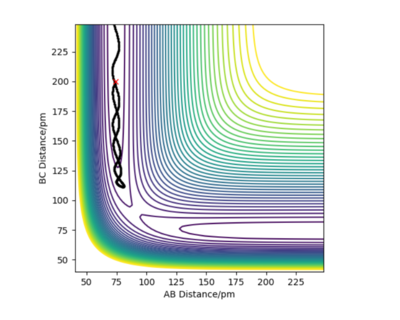
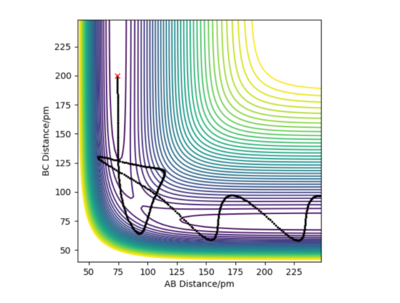
For the initial positions r1 = 74 pm and r2 = 200 pm, trajectories with the following momenta were run.
From this table we can conclude that it is not enough for the system to just have enough energy to cross the energy barrier, due to the possibility of barrier recrossing. Vibrational modes must also be considered.
Simple but perfectly said! Mys18 (talk) 23:48, 24 June 2020 (BST)
1. Given the results you have obtained, how will Transition State Theory predictions for reaction rate values compare with experimental values?
Main assumption of TST is that once the transition state is crossed, reactants cannot reform1. However from reaction 4 in the table above we can see that it is experimentally possible. This would lead to the overestimation of the reaction rate by TST compared to the actual reaction rate.
Perfect. What are the other TST assumptions? One we can discuss here is also how TST creates energy classically... how does that imact this? Mys18 (talk) 23:51, 24 June 2020 (BST)
F-H-H System
PES inspection
1. By inspecting the potential energy surfaces, classify the F + H2 and H + HF reactions according to their energetics (endothermic or exothermic). How does this relate to the bond strength of the chemical species involved?
F+H2 is an exothermic reaction while H + HF is an endothermic reaction. This can be seen in figure 4. This shows that the H-F bond is lower in energy and therefore stronger than the H-H bond.
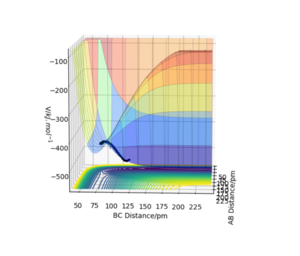
You can support yourself by referring bond energy values for H2 and HF. Mys18 (talk) 23:52, 24 June 2020 (BST)
2. Locate the approximate position of the transition state.
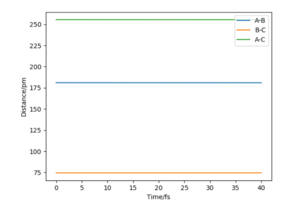
Hammond's postulate states that the transition state resembles either reactants or the products, whichever it is closer in energy2. Because F+H2 is an exothermic, transition state will be closer in energy to F+H2 (reactants) and therefore resemble it, meaning that the distances should be similar to the ones present in F+H2 system. By trial and error and setting momentums to zero, the approximate position of the transition state was found to be at rFH=181 pm and rHH=74.5 pm. This can be confirmed by the Internuclear Distances vs Time plot on which there are no oscillations of the lines.
3. Report the activation energy for both reactions.
The energy of the transition state = -433.981 kJ/mol
F+H2
rHF was set to 1000 pm and rHH was set to 74.5 pm. The energy of this state is -435.057 kJ/mol. Therefore the activation energy is: -433.981 + 435.057 = 1.076 kJ/mol This is a relatively small activation energy which is expected as this reaction is exothermic so the transition state is similar energetically to the starting material.
H + HF
rHF was set to 91 pm and rHH was now set to 1000 pm. The energy of this state is -560.404 kJ/mol. Therefore the activation energy is: -433.981 + 560.404 = 126.43 kJ/mol This higher than for F+H2 reaction as expected as H + HF endothermic and the transition state will resemble products energetically rather than the reactants.
Looks like what I'd expect. Good units. Mys18 (talk) 23:55, 24 June 2020 (BST)
Reaction Dynamics
1. In light of the fact that energy is conserved, discuss the mechanism of release of the reaction energy. Explain how this could be confirmed experimentally.
Initial parameters:
rFH = 170 pm, pFH=-0.5 g.mol-1.pm.fs-1
rHH = 75 pm, pFH=0 g.mol-1.pm.fs-1
From the figure 6 it can be seen that the total energy is conserved while kinetic and potential energies are constantly interchanging. From this figure, it can also be seen that H-F bond has greater oscillations than the H-H bond. Therefore it can be suggested that the energy released (exothermic reaction) is used to make H-F bond oscillate. To confirm this experimentally IR spectroscopy can be employed to measure the difference in the vibrational energy of the reactants compared to the products.
How would you measure thermal changes experimentally? You can even check out 'chemiluminescence' which may be useful in monitoring the emission of infrared radiation from the sample. Mys18 (talk) 23:58, 24 June 2020 (BST)

2. Discuss how the distribution of energy between different modes (translation and vibration) affect the efficiency of the reaction, and how this is influenced by the position of the transition state.
Polanyi's empirical rules3 lead to the fact that the initial states with high translational energy promote reactions with an early transition state (exothermic) while the initial states with high vibrational energy promote reactions with late transition state (endothermic). Therefore it is more efficient for H + HF to have higher vibrational energy rather than the translational energy and for F + H2 it is better to have higher translational energy.
References
1. Atkins, P., De Paula, J. and Keeler, J., n.d. Atkins' Physical Chemistry. 11th ed. New York: Oxford University Press, p.792.
2. Clayden, J., 2004. Organic Chemistry. 2nd ed. New York: Oxford University Press, p.989.
3. Guo, H. and Liu, K., 2016. Control of chemical reactivity by transition-state and beyond. Chemical Science, 7(7), pp.3992-4003.


