MRD:01532430mrd
MRD:01532430
4/5 - Excepting a couple of small points (see the comments) this is a good report, well done.
EXERCISE 1: H + H2 system
Q. On a potential energy surface diagram, how is the transition state mathematically defined? How can the transition state be identified, and how can it be distinguished from a local minimum of the potential energy surface?
A.
i) How is the transition state mathematically defined?
At the transition state the kinetic energy is 0 as it has all been converted to potential energy and the gradient of the potential is 0. Therefore it can mathematically defined using the first partial derivative: ∂V(ri)/∂ri=0.
ii) How can the transition state be identified?
The transition state is also the minimum energy point reactants must reach in order for products to form, this naturally forms a maximum point when graphed. In this case the transition point is represented at the plane on the saddle point which gives the maximum point.
iii) How can it be distinguished from a local minimum of the potential energy surface?
As mentioned above the Transition state can be identified using the first partial derivative of potential energy. Also mentioned above is that the transition state is a maximum, so using the second derivative we can distiniguish it from the minimum point. The maximum point would give a negative value, while the minimum point will give a positive value.
Almost. Remember that with a saddle point, it is a minimum along one set of co-ordinates and a maximum along another set. A rigorous definition of the TS requires this behaviour to be accounted for.
Q. Report your best estimate of the transition state position (rts) and explain your reasoning illustrating it with a “Internuclear Distances vs Time” plot for a relevant trajectory.
A. Knowing that the surface of H + H2, the transition state should be at a point where r1 = r2. As well as this the momentum is 0 as the atoms are also stationary at this point, therefore p1=p2=0 g.mol-1.pm.fs-1.
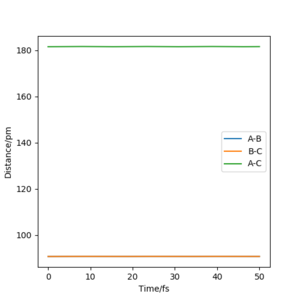
Trial and error in a region between 0.74 pm and 1.00 pm was used initially. This was decided as the standard equilibrium bond distance for H2 is 0.74 so it can be assumed the value for the transition state is larger. This was continued until a horizontal line was obtained in the Internuclear Distances vs Time, figure 1. This indicated no change in distance and therefore stationary atoms and therefore the transition state. This was obtained at 90.750 pm.
Correct estimate for the TS, well done.
Q. Comment on how the mep and the trajectory you just calculated differ.
A.Setting up the trajectories. For this section the trajectory was changed so the positions are r1 = rts+1 pm, r2 = rts.
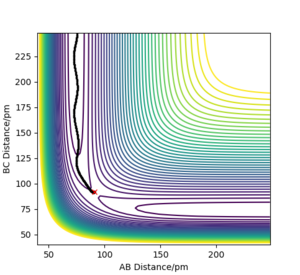
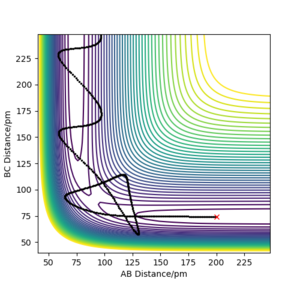
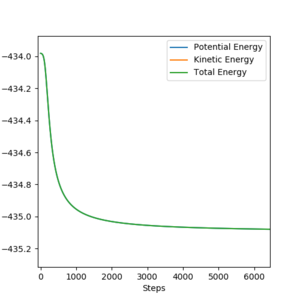
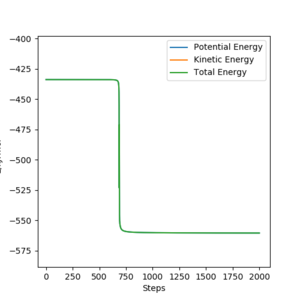
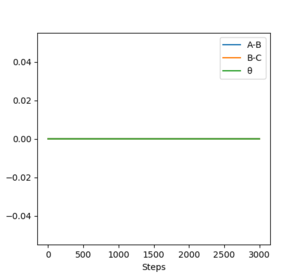
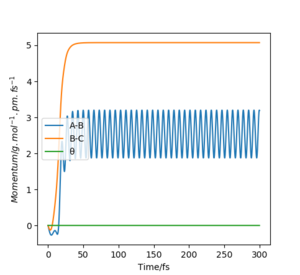
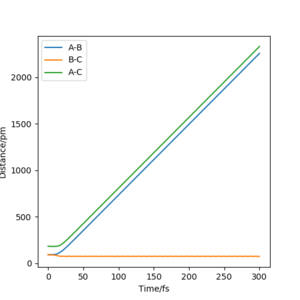
So with R1 = 91.750 and R0 = 90.750, the reaction has come through the other side of the transition state and now the reaction is proceeding downhill from the maximum point. Momenta was kept at 0. Plots had their calculation types differed to MEP (steps = 3000) (figures 2) and dynamic (figures 3), these were then compared.
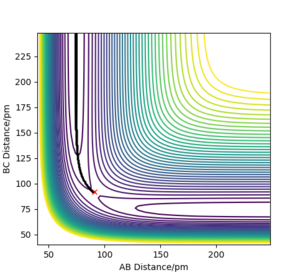
Comparing figures 2.2 and 3.2 . The dynamic figure 3.2 shows minor oscillations while the MEP figure 2.2 shows a flat line and no oscillations for B-C. This indicates in the dynamic figure there is vibrational motion, while in MEP there is only transitional motion and only vibration motion, this can
be explained using evidence from figures 2.3 and 3.3.
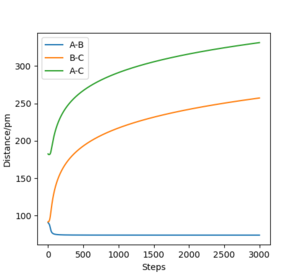
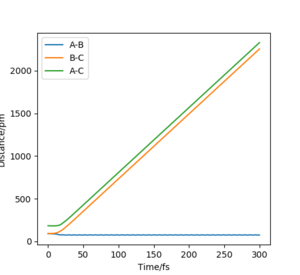
Comparing 2.3 and 3.3, the MEP
plot (figure 2.3) the horizontal line shows there is no momentum. Yet in the
dynamic plot (figure 3.3) there is an oscillation of momentum. Despite the atoms
not being given initial momenta the conversion of potential energy to kinetic
energy for the dynamic plot results in the movement of the atoms and therefore,
momentum. This occurs due to the atoms starting at a downhill position. As
indicated earlier MEP doesn't involve any conversion to KE and so with every
step momenta is still 0, resulting in the horizontal line
A sensible discussion of the differences, well done.
Q. How does Internuclear Distances vs Time and Momenta vs Time change with r1 = rts and r2 = rts+1
A.
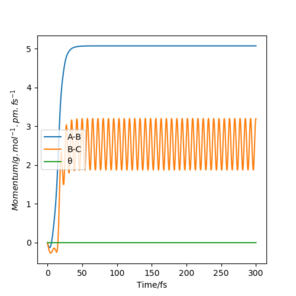
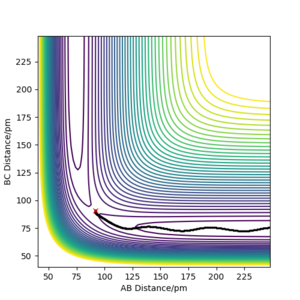
Reversing the distances, so R1 = 90.750, R2 = 91.750 produced these plots. Plot 4.1 gave a contour plot almost identical to plot 3.1 but reflected in the x=y line, this shows the direction of attack is symmetrical and now reversed under these conditions. Plot 4.2 is also very similar to plot 3.2 with the exception that the variables, A-B and B-C have been swapped, this occurs due to the symmetric and opposite direction of attack for the reaction. The same thing occurs when comparing figures 4.3 and 3.3.
Reactive and unreactive trajectories
Q. Complete the table above by adding the total energy, whether the trajectory is reactive or unreactive, and provide a plot of the trajectory and a small description for what happens along the trajectory. What can you conclude from the table?
A.
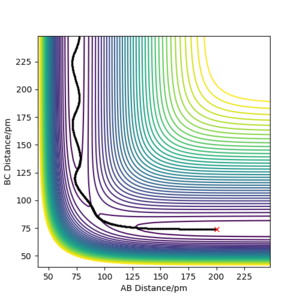
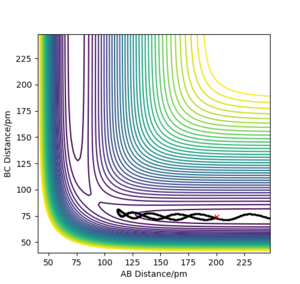
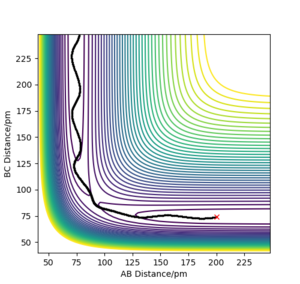
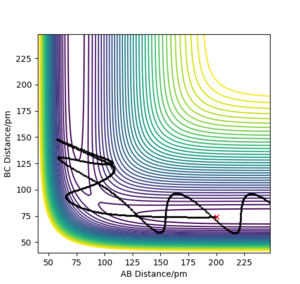
From this table, the conclusions reached are that there must be sufficient kinetic energy to overcome the activation energy for the reaction to be successful, plot 2 shows this. On the other hand, plot 4 shows that even with high momentum and sufficient KE the reaction will potentially not be successful due to the reactants reforming. Therefore, the kinetic energy must be higher then the activation energy to pass the transition state but not too high of a KE, as this can result in a vibrational energy too high resulting in reactants reforming.
Transition State Theory
Q. Given the results you have obtained, how will Transition State Theory predictions for reaction rate values compare with experimental values?
A. A key factor in the transition state theory is that once the reactants have passed the transition state and activation barrier the reaction is irreversible. This doesn't coincide with the results from the table above, plots 4 and 5, indicating the transition state theory isn't accurate. This repeated crossover of the transition state indicates the prediction of theory are higher then experimental values. [1]
Good description of the limitations of TS theory. What other assumptions does TS theory make that don't hold up?
EXERCISE 2: F - H - H system
PES inspection
Q. By inspecting the potential energy surfaces, classify the F + H2 and H + HF reactions according to their energetics (endothermic or exothermic). How does this relate to the bond strength of the chemical species involved?
A surface plot was used to investigate the energetics of the F + H2 --> HF + H reaction. Figure 10 shows this. A=F, B=H, C=H.
The energy of the reactants is on the left and is clearly higher then the energy of the products on the right. This indicates a release of energy, therefore, making the reaction exothermic. This evidence relates to the bond strength by showing the product H-F is more stable and therefore its bond strength is higher then the reactant, H2. This coincides with literature values. HH has a lower bond enthalpy then HF, ( 436 KJmol-1 and 564 KJmol-1 respectively. [2]

Q. Locate the approximate position of the transition state.
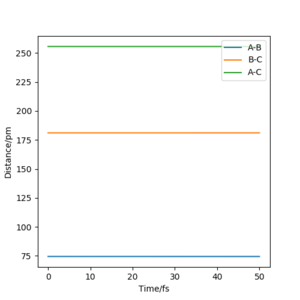
A. Locating the position of the transition state requires a similar strategy to exercise 1. Momentum was set to p1=p2=0 and RF-Hb = 181.1 pm and RHb-Hc = 74.5 pm. The bond distance of the hydrogen atom was determined using the knowledge gained in exercise 1 that the equilibrium bond length is 0.74. HF bond distance was determined using estimation and trial and error. The transition state of this reaction was satisfied when the Internuclear Bond Distance vs Time plot produced horizontal lines, figure 11. As mentioned in exercise 1, this result in this plot indicates the atoms having no vibrational motion and of course, no change in intermolecular distance.#
Q. Report the activation energy for both reactions.
A. The table illustrates the trajectories chosen to investigate the activation energy of both reactions and the results obtained.
Sensible estimates for Ea in both directions, well done.
Reaction Dynamics
Q. In light of the fact that energy is conserved, discuss the mechanism of release of the reaction energy.
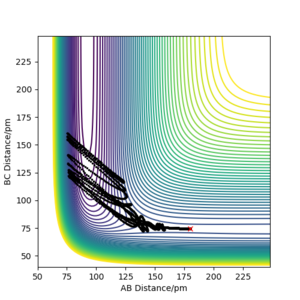
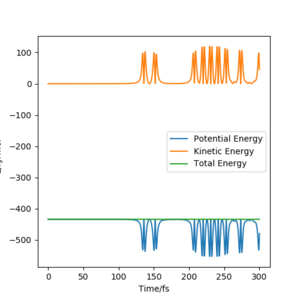
A. The trajectory of the following plots are AB - 180.1 and BC - 74.5, and were viewed dynamically at 3000 steps and 0.1 fs.
Figure 14.1 shows the reaction going beyond the transition state and the reaction being successful. Figure 14.2 shows that energy is conserved, by the green horizontal constant energy line. Figure 14.3 shows the oscillation of the reactant, products and their high vibrational energy. An animation would also show the reaction being complete.

Q. Explain how this could be confirmed experimentally.
Infrared chemiluminescence can be used to determine the mechanism by measuring the populations of vibrational states of products. [3]
How though? Give some detail.
Q. Discuss how the distribution of energy between different modes (translation and vibration) affect the efficiency of the reaction, and how this is influenced by the position of the transition state.
A. Hammonds Postulate states that exothermic reactions have an early transition state that resembles the reactants more then the products, while endothermic reactions have a late transition state resembling the products.[4] While Polanyi adds to this, stating for exothermic reactions with these late transition states, high transitonal, low vibrational energies produce the most efficient reactions.[5] Figure 15 shows the F + H2 -> HF + H reaction being unsuccessful, and this can be attributed to the high momentum, and therefore high vibrational energy. Figure 16 however shows a reaction with lower momentum and yet the reaction is successful unlike figure 15. This coincides with the assumption of Hammonds Postulate and Polanyi.
| PAB | PBC | Reaction Successful? | Contour Plot of Reaction |
|---|---|---|---|
| -1 | -2 | No | 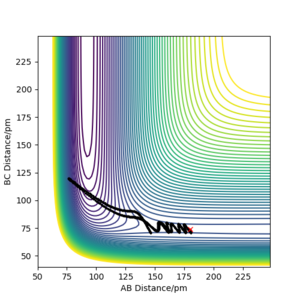 |
| -1 | -0.5 | Yes | 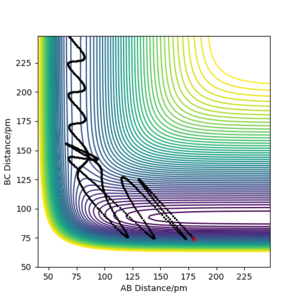 |
On the other hand the reaction H + HF -> H2 + F is endothermic. So according to hammond postulate and polanyi, there will be a late transition state and this favours the reactants having a high vibrational energy. This is indicated in figures 17 where the reaciton is unsuccessful with a low momentum and yet is successful with a high momentum in figure 18.
| PAB | PBC | Reaction Successful | Contour Plot of Reaction |
|---|---|---|---|
| -10 | -1 | No | 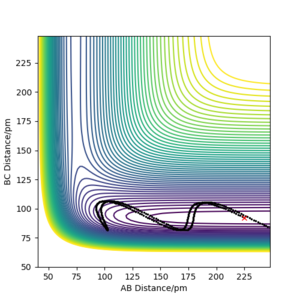 |
| -20 | -1 | Yes | 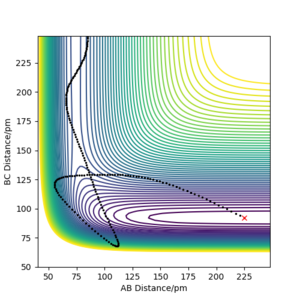 |
Good!
- ↑ Steinfeld, Jeffrey I., Francisco, Joseph S, and Hase, William L. Chemical Kinetics and Dynamics. 2nd ed. Upper Saddle River: Prentice-Hall, 1989. Print.
- ↑ Blanksby S. J., Ellison G. B. (April 2003). "Bond dissociation energies of organic molecules". Accounts of Chemical Research. 36 (4): 255–63.
- ↑ Atkins P. and de Paula J. Physical Chemistry (8th ed., W.H.Freeman 2006) p.886 ISBN 0-7167-8759-8
- ↑ George S. Hammond 1955 77 (2), 334-338 DOI: 10.1021/ja01607a027
- ↑ Zhang Z, Zhou Y, Zhang DH, Czakó G, Bowman JM. Theoretical Study of the Validity of the Polanyi Rules for the Late-Barrier Cl + CHD3 Reaction. J Phys Chem Lett. 2012;3(23):3416‐3419. doi:10.1021/jz301649w

