MRD:01531254
Molecular Reaction Dynamics Lab
The objectives of this exercise are to study the reactivity of triatomic systems, where an atom and a diatomic molecule collide, through calculating Molecular Dynamics trajectories.
Exercise 1: H + H2 system
Dynamics from the transition state region
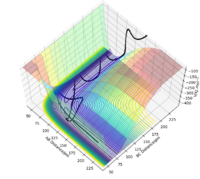
On a potential energy surface diagram, how is the transition state mathematically defined? How can the transition state be identified, and how can it be distinguished from a local minimum of the potential energy surface?
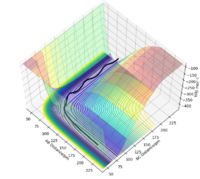
The transition state is defined as the maximum on the minimum energy path linking reactants and the products. The transition point can be identified on a potential energy surface as being at a saddle point, where the reactive trajectory is at its highest point and the gradient of the potential energy surface is zero. Saddle points have a local maximum in one direction and a local minimum in the other. They can be mathematically defined using their gradient: the partial derivative of the gradient, fx, equals zero, indicating that the gradient is zero at this point. Furthermore, saddle points are distinguished from local minima in that the result of the second partial derivative test, fxxfyy-fxy2, is larger than zero. [1]
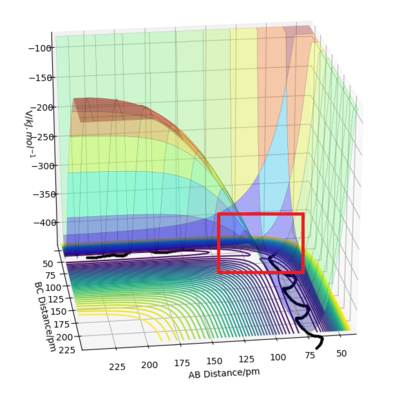
Good description. Details on you image (ie highlighted region) or refering to image in your description would be a great addition. Also, when referencing, try to reference the primary source or close to the primary source. Khan academy is not a good reference. Sf3014 (talk) 12:08, 18 May 2020 (BST)
Trajectories from r1 = r2: locating the transition state
Report your best estimate of the transition state position (rts) and explain your reasoning illustrating it with a “Internuclear Distances vs Time” plot for a relevant trajectory.
Since the H + H2 surface is symmetric, the transition state must have r1 = r2. In trajectories from r1 = r2 the trajectory oscillates on the ridge; this can be used to locate the transition state geometry.
When testing different initial conditions with r1 = r2, and p1 = p2 = 0.0 g.mol-1.pm.fs-1, it can be seen that the system undergoes a periodic symmetric vibration.

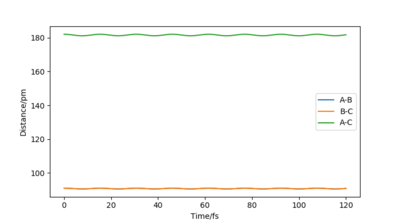
For example, the Internuclear Distances vs Time plot for r1 = r2 = 100 pm , p1 = p2 = 0.0 g.mol-1.pm.fs-1 is shown below ,and clear oscillation can be seen.
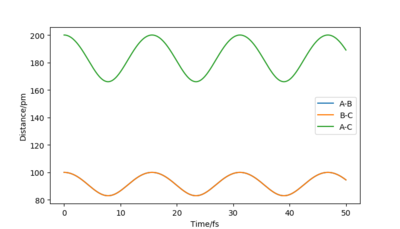
However, when r1 = r2 is set to 91, the vibration is very minimal. This is a good estimate for the transition state because when a trajectory starts at the transition state, with no initial momentum, it stays there forever.
Description easy to follow, but units missing for transition state position. Also, the position can be more accurate Sf3014 (talk) 13:05, 18 May 2020 (BST)
Calculating the reaction path and trajectories from r1 = rts+δ, r2 = rts
Comment on how the mep and the trajectory differ.
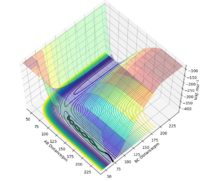
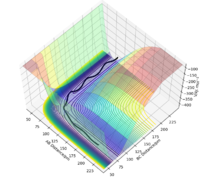
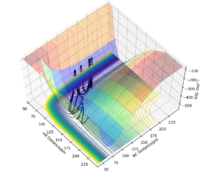
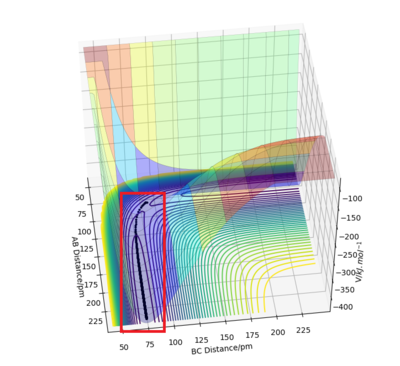
The minimum energy path (or mep) is a very special trajectory that corresponds to infinitely slow motion. This can be tested with initial conditions r1 = rts + 1 and r1 = rts, and p1 = p2 = 0.0 g.mol-1.pm.fs-1 and the calculation type as 'MEP'. With r1 set at 92 and r2 set at 91, it can be seen that the trajectory simply follows the valley floor to H1 + H2 - H3. Good, but refer to highlighted region on image in your description. Also why does the trajectory "follow the valley floor"? Sf3014 (talk) 12:37, 18 May 2020 (BST)
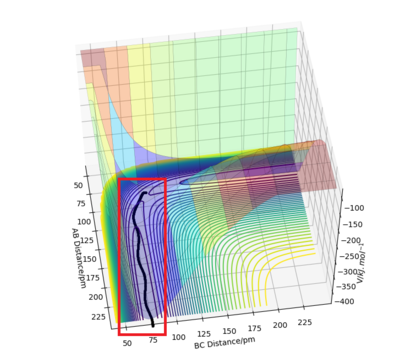
However, mep doesn't provide a realistic account of the motion of atoms during a reaction because it doesn't account for the mass of the atoms. When the same reaction is repeated with the calculation type as 'Dynamics' rather than 'MEP', the inertial motion of the atoms is indicated by the oscillation of the BC distance caused by the masses interacting. Yes, the mep calculation approximates for no vibrational energy. However, your conclusion is not clear because the oscillations are also proportional to bond strength. Sf3014 (talk) 12:37, 18 May 2020 (BST)
Reactive and unreactive trajectories
Complete the table by adding the total energy, whether the trajectory is reactive or unreactive, and provide a plot of the trajectory and a small description for what happens along the trajectory. What can you conclude from the table?

Initial positions r1 = 74 pm and r2 = 200 pm:
Good layout and descriptions. What can you conclude from this table? Sf3014 (talk) 13:06, 18 May 2020 (BST)
Transition State Theory
Given the results you have obtained, how will Transition State Theory predictions for reaction rate values compare with experimental values?
A powerful theory to rationalise and calculate the rate of chemical reactions based on the properties of the reactants and the transitions state structure is Transition State Theory. It predicts that the rate constant for a generic bimolecular reaction is:
A crucial assumption of Transition State Theory in estimating Rcl is that all trajectories with a kinetic energy along the reaction coordinate greater than the activation energy will be reactive. By further assuming that the kinetic energy along the reaction coordinate follows the Boltzmann distribution, one obtain the conventional Transition State Theory rate constant expression:
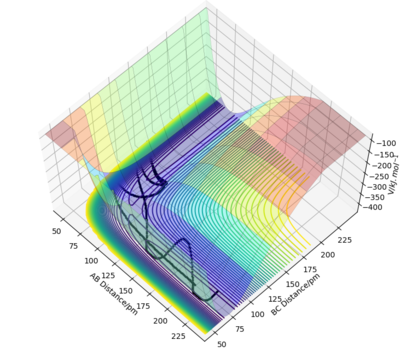
In Transition State Theory motion is treated by classical mechanics, and it is assumed that this motion always leads to products without recrossings of the saddle point. This is incorrect as quantum mechanical tunneling allows barrier crossing to take place when the total energy is less than the potential energy at the top of the barrier.[2] Barrier recrossing is seento occur in the calculated experiment values, for example:
Good description and use of reference. Missing in description, how does TST effect the rate of reaction compared to experimental values? Sf3014 (talk) 13:20, 18 May 2020 (BST)
Also, when using equations, variables should be defined Sf3014 (talk) 13:23, 18 May 2020 (BST)
Exercise 2: F - H - H system
PES inspection: F + H2
By inspecting the potential energy surfaces, classify the F + H2 and H + HF reactions according to their energetics (endothermic or exothermic). How does this relate to the bond strength of the chemical species involved? Locate the approximate position of the transition state. Report the activation energy for both reactions.

F + H2 is an exothermic reaction as characterised by the fact that the transition state occurs early in the reaction coordinate on its potential energy surface, i.e. it is an attractive surface.[3] This relates to the bond strengths involved as a relatively weak H-H bond is broken while a strong H-F bond is formed; bond making is an exothermic process, so the formation of a bond with high bond enthalpy makes the overall reaction exothermic.[3]
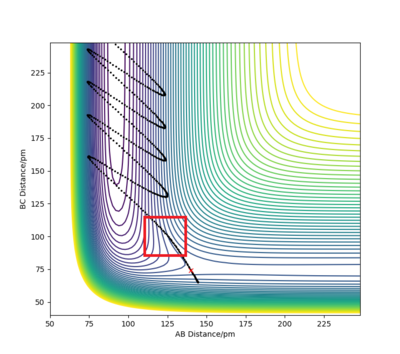
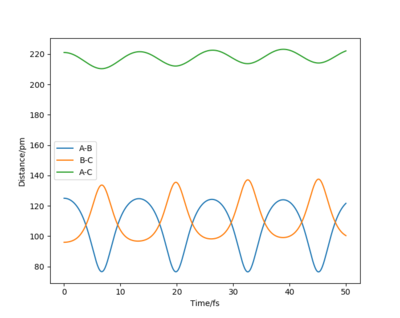
The approximate position of the transition state is where the F---H gap is 125 pm and the H---H gap is 96 pm. This is reflected in the Internuclear Distances vs Time plot where this position is set at this position with p1 = p2 = 0.0 g.mol-1.pm.fs-1; the system undergoes a periodic symmetric vibration but does not move from the spot. This structure is consistent with Hammond's postulate, where the transition state in an exothermic reaction is close in structure to the reactants.[4]
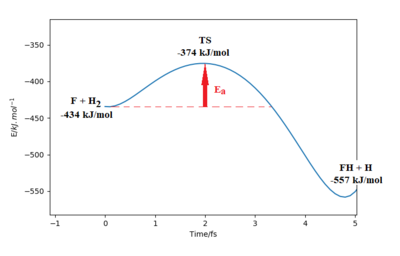
Part of the Energy vs Time plot is shown from the reaction, depicting the potential energy of the products, transition states and reactants. From this the activation energy can be calculated to be 59 kJ/mol for this reaction. note:the activation energy is a bit too high Sf3014 (talk) 21:45, 18 May 2020 (BST)
PES inspection: H + HF
By inspecting the potential energy surfaces, classify the F + H2 and H + HF reactions according to their energetics (endothermic or exothermic). How does this relate to the bond strength of the chemical species involved? Locate the approximate position of the transition state. Report the activation energy for both reactions.

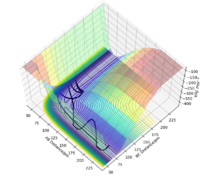
H + HF is an endothermic reaction as characterised by the fact that the transition state occurs late in the reaction coordinate on its potential energy surface, i.e. it is an repulsive surface.[3] This relates to the bond strengths involved as a strong H-F bond is broken while a weaker H-H bond is formed; bond breaking is an endothermic process, so the breakage of a bond with high bond enthalpy makes the overall reaction endothermic.[3] Good but show energies of reactions using an image of the potential energy surfaces and refer to it in your descriptions for H + HF and F + HH. Also, you can back up your information on H-F and H-H bond energies using their bond energies Sf3014 (talk) 13:36, 18 May 2020 (BST)
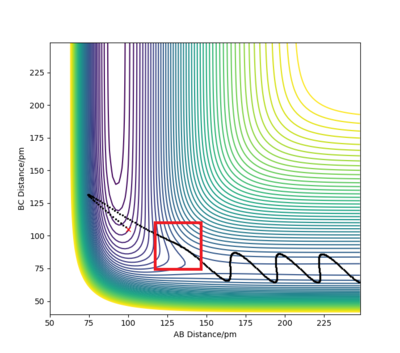
The approximate position of the transition state is where the F---H gap is 125 pm and the H---H gap is 96 pm. This is reflected in the Internuclear Distances vs Time plot where this position is set at this position with p1 = p2 = 0.0 g.mol-1.pm.fs-1; the system undergoes a periodic symmetric vibration but does not move from the spot. This structure is consistent with Hammond's postulate, where the transition state in an endothermic reaction is close in structure to the products.[4]

Part of the Energy vs Time plot is shown from the reaction, depicting the potential energy of the products, transition states and reactants. From this the activation energy can be calculated to be 160 kJ/mol for this reaction.
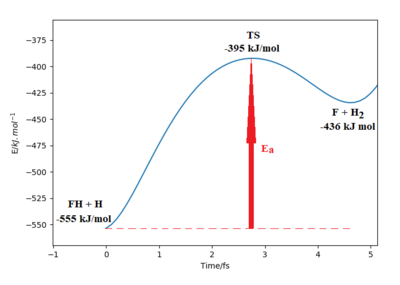
Good descriptions on finding TS. Need to refer to highlighted region on image. Also, more description needed on the activation energy value, how was the activation energy calculated? Sf3014 (talk) 13:43, 18 May 2020 (BST)
Reaction dynamics: F + H2
In light of the fact that energy is conserved, discuss the mechanism of release of the reaction energy. Explain how this could be confirmed experimentally.
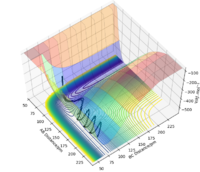
One set of initial conditions that results in a reactive trajectory for F + H2 is r1 = 140 pm, r2 = 74 pm, p1 = 0 g.mol-1.pm.fs-1 and p2 = -5 g.mol-1.pm.fs-1. By considering the animation and Momenta vs Time plot, the mechanism can be examined. As H2 approaches F the momentum of its bond increases; after the transition state, where H1 bonds with F and the other H moves away from the new product, the H-F bond oscillates.
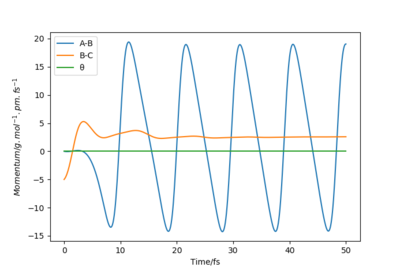
The hydrogen molecule could be polaried by the electronegative fluoride and form a bond in the transition state via an SN2 mechanism. It could be possible to determine the order of the reaction experimentally, which should correspond to a SN2 rate law involving the concentrations of both the species in the reaction. Description is unclear as to how energy is conserved. No mention of energy transfer and how the total energy remains constant. You need to refer to your images. Also answer is incomplete, how can you confirm the conservation of energy experimentally? provide experiment and description Sf3014 (talk) 13:56, 18 May 2020 (BST)
Reaction dynamics: Polanyi
Discuss how the distribution of energy between different modes (translation and vibration) affect the efficiency of the reaction, and how this is influenced by the position of the transition state.
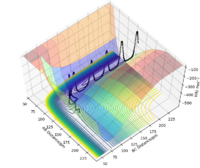
Polanyi's empirical rules explain and predict the effect of translational and vibrational energy in driving reactions. They state that for reactions with an early transition state / reactant-like transition state, translational energy is most effective in driving the reaction; for reactions with a late transition state / product-like transition state, vibrational energy is most effective in driving the reaction.[5] These rules can be demonstated through different case studies: F + H2 falls into the first category, so is most affected by translational energy, and H + HF falls into the second category, so is most affected by vibrational energy. Consider the following examples:
Good but more how does the energies (vibrational and translational) relate to the initial conditions of momenta? Sf3014 (talk) 14:08, 18 May 2020 (BST)
References
- ↑ https://www.khanacademy.org/math/multivariable-calculus/applications-of-multivariable-derivatives/optimizing-multivariable-functions/a/maximums-minimums-and-saddle-points
- ↑ N. E. Henriksen and F. Y. Hansen Theories of Molecular Reaction Dynamics 2nd ed., OUP, 2019
- ↑ 3.0 3.1 3.2 3.3 Atkins, de Paula, Keeler: Physical Chemistry, 11th Edition
- ↑ 4.0 4.1 Clayden, Greeves, Warren: Organic Chemistry, 2nd Edition
- ↑ Guo, Liu: Control of chemical reactivity by transition-state and beyond

