MRD:01524831.molecularreactiondynamics
Exercise 1: H + H2 system

On a potential energy surface diagram, how is the transition state mathematically defined? How can the transition state be identified, and how can it be distinguished from a local minimum of the potential energy surface?
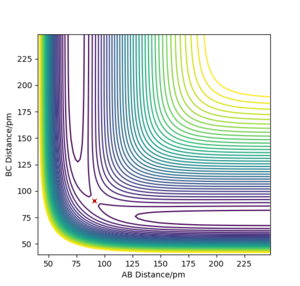
On a potential energy surface diagram , the transition state is mathematically defined as the saddle point.[1] The saddle point is a stationary point on the plot, where along the reaction path it is a maxima and perpendicular to the reaction path the saddle point is perceived to be a minima. The transition point can be identified in this simple example when the distances between the 3 hydrogen atoms are of equal distance. As shown in figure 1, the reaction path is oscillating at the saddle point. This depicts the vibrational freedom of the system at the transition state. A saddle point is mathematically found as shown below.
D = fxx.fyy - fxy2
If D > 0, fxx < 0 , local minima.
If D< 0 , then it is a saddle point.
What are fxx. fyy and fxy in this context? João (talk) 10:51, 14 June 2020 (BST)
Report your best estimate of the transition state position (rts) and explain your reasoning illustrating it with a “Internuclear Distances vs Time” plot for a relevant trajectory.
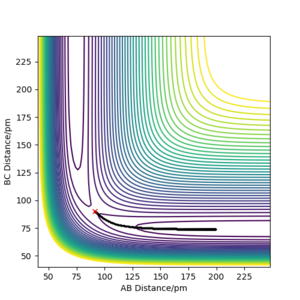
The estimated rts is found to be around 91 pm. The transition state in this H + H2 system is defined to be the position where internuclear distances are equal, and where it is at a potential energy maxima in relation to the reaction path trajectory. From figure 1 it is evident that there are vibrations within the system, depicted by the oscillations on the ridge. The transition state position was found by determining at which position the internuclear distance was equal and constant, and where the potential energy was a maximum how so? João (talk) 10:51, 14 June 2020 (BST) , and thus the stable point of the transition state.[1] The saddle point was found as shown in figure 2. Good. Pu12 (talk) 20:45, 11 June 2020 (BST)
Comment on how the mep and the trajectory you just calculated differ.
When calculating under mep the reaction path is depicted different to when the calculation type is set to dynamics. What is absent in the map calculation is the motion of the atoms. The vibrational motion of the three hydrogen atoms are not depicted as shown in figure 3. The initial condition is set so that the distance between AB is rts and the distance between BC deviates from rts by 1 pm, resulting in the reaction pathway following through the trajectory of minimum energy, and advances towards the HA + HB-HC product. The flat BC line indicates the fact that the mep calculation does not consider vibrational motion of atoms, and solely is helps depict the favoured trajectory when slightly displacing said atoms away from the transition state, as it chooses the minimum energy path. This could be useful to understand energy diagrams and help calculate activation energies.
Good. Pu12 (talk) 20:45, 11 June 2020 (BST)
Look at the “Internuclear Distances vs Time” and “Momenta vs Time”. What would change if we used the initial conditions r1 = rts and r2 = rts+1 pm instead?
The change of initial conditions to those above will change final product from HA + HB-HC to HA-HB + HC as it is the HB-HC bond distance that deviates away from the rts. As a result the internuclear distances vs time plot will now show AB to be constant over time. Momentum remains unchanged as initial momentum is 0 for both scenarios.
Setup a calculation where the initial positions correspond to the final positions of the trajectory you calculated above, the same final momenta values but with their signs reversed.
The 'Get last geometry' option was selected, and the momenta were then reversed under the dynamic calculation type. The plot remains unchanged but with reversed directions as expected. The reason for this is because the initial argument resulted in a trajectory towards a larger BC distance. Using the momenta of this trajectory but reversing the sign simply results in the hydrogen and hydrogen molecule to start in the final position, but now approach each other due to the negative momentum value.
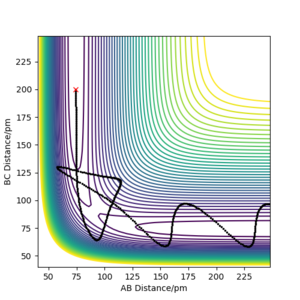
Complete the table above by adding the total energy, whether the trajectory is reactive or unreactive, and provide a plot of the trajectory and a small description for what happens along the trajectory. What can you conclude from the table?
| p1/ g.mol-1.pm.fs-1 | p2/ g.mol-1.pm.fs-1 | Etot/kJ.mol-1 | Reactive? | Description of the dynamics | Illustration of the trajectory |
|---|---|---|---|---|---|
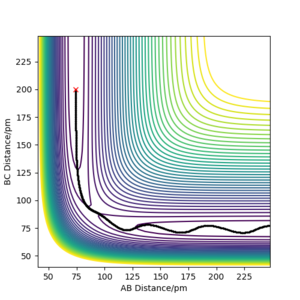
| -2.56 | -5.1 | -414.280 | Yes | Hydrogen atoms AB and C approach
eachother. Notably, the vibrational motion present after the transition state is not present before. Good. Pu12 (talk) 20:45, 11 June 2020 (BST) |
|
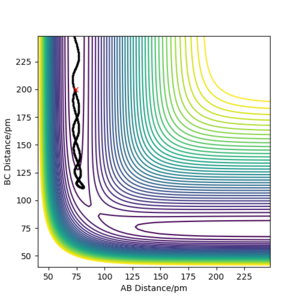
| -3.1 | -4.1 | -420.077 | No |
Hydrogen atoms AB approaches C, however before approaching the saddle point to AB swiftly moves away from C |
|
| -3.1 | -5.1 | -413.977 | Yes | Hydrogen atom C approaches AB with a large
amount of momentum, resulting in a new BC Hydrogen molecule forming, releasing the A hydrogen atom in the reaction. |

|
| -5.1 | -10.1 | -357.277 | No | Hydrogen atoms AB and C approach each other very
quickly. Upon impact, large internuclear distance and velocities are depicted, showing the B atom being tugged by both A and C. In the end, B forms a molecule AB and moves away from C. |

|
| -5.1 | -10.6 | -349.477 | Yes | Upon impact, the B atom is tugged between the two atoms A and
C, and is finally bonded to to atom C. A then moves away from BC. |
|
The table above shows that a reaction isn't only reliant on the amount of kinetic energy in the system. As shown in the table above, there are instances where kinetic energy is higher than the activation energy, however no reaction takes place. One therefore needs to consider that successful collisions are not only reliant on the system having enough energy to break and reform bonds.
Given the results you have obtained, how will Transition State Theory predictions for reaction rate values compare with experimental values?
Transition State Theory has a fundamental assumption which will result in its predictions being different to experimental values. The assumption that all trajectories possessing enough kinetic energy to circumvent the activation barrier will be reactive will result in a larger Rcl and thus a larger rate prediction than the experimental outcome. As seen in the table above, not all collisions are reactive even if there is sufficient kinetic energy - the case of barrier recrossing perfectly illustrates this.
Exercise 2
By inspecting the potential energy surfaces, classify the F + H2 and H + HF reactions according to their energetics (endothermic or exothermic). How does this relate to the bond strength of the chemical species involved?
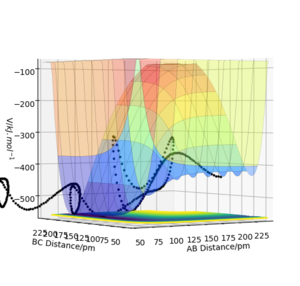
The reaction is exothermic as shown in figure 4, there is a decrease in potential energy when passing the transition state and forming the new HF bond. This relates to bond-strength. H-H has a bond strength of 432 kJ/mol whilst H-F has a bond strength of 565 kJ/mol.[2] As HF is a polar bond as a result of the very electronegative F, there is an ionic element to the bond, resulting in a much greater attraction between the two atoms, thus releasing a lot of energy on formation. As the energy released is greater than that absorbed, the reaction is exothermic as depicted in the trajectory shown in figure 4.[3] There is an energy well adjacent to the transition state, indicating the difference in energy between the reactant and product.[4]

Figure 5 on the other hand shows an endothermic reaction, illustrated by the increase in potential energy along the trajectory, indicating that the energy absorbed to break the stronger H-F bond is greater than the energy released when forming the weaker H-H bond. Good. Pu12 (talk) 20:45, 11 June 2020 (BST)


Locate the approximate position of the transition state
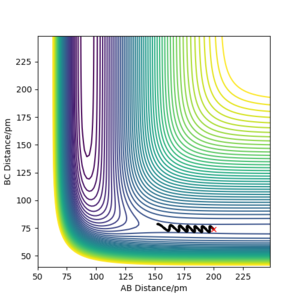
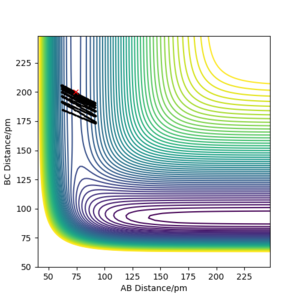
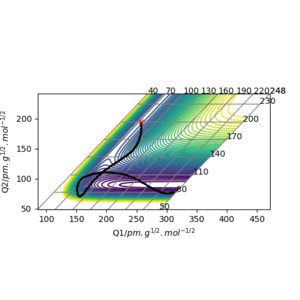
The transition state position was calculated to be when the H-F bond was 181.8 pm, and the H-H bond was 73.1 pm as shown in figure 5. Analoguos to the calculation when approximating the transition state position of the H + H2 system, in the F + H2 reaction, simulations were tested in order to acquire a constant bond length, at the maximum potential energy, and where the trajectory remained stable. As the F + H2 reaction was exothermic, adopting Hammonds postulate, the assumption was made that the reaction had an early transition state thus the region near the reactants was analysed. The mep calculation was used to remove the vibrational noise as it made it difficult to read the plots. As HF + H is a late transition state, resembling its product F + H2, it will have the same transition state positions. To confirm the transition state position, under mep calculations, incremental increases to the transition state bond length were made to make sure the trajectory rolled over the transition state to either the reactant or products.
Report the activation energy for both reactions.
In order to find the activation energy for HF + H, the bond distance of H-F transition state was first decreased by 1 pm. This then resulted in the energy falling to form the products H-F and H. The difference in this energy as shown in figure 7 was used to calculate the activation energy of the H-F + H endothermic reaction. The activation energy was estimated to be 120 kJ/mol. For the exothermic F + H2 reaction, the activation energy was calculated by trying to shift the trajectory towards to the reactants. This was done by thus increasing the F-H distance, forming the F + H2 reactant. The difference in this energy was very small as shown in figure 8 and was used to calculate the activation energy for the F + H2 reaction to be around 1.2 kJ/mol. Good. Pu12 (talk) 20:45, 11 June 2020 (BST)
In light of the fact that energy is conserved, discuss the mechanism of release of the reaction energy. Explain how this could be confirmed experimentally.
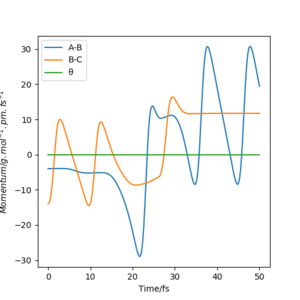
Figure 8 illustrates the transition between translational and vibrational energy in the F + H2 reaction. Initially, the H-H bond (B-C) is vibrationally excited shown by the oscillation, whilst the H-F(A-B) bond isn't as is indicated by the absence of an oscillation. The H-F bond is at the vibrational ground state . After the collision we see a transition. The H-F bond now is vibrationally excited illustrated by the oscillation in the momenta vs time plot, and the H-H bonds loses this vibrationally energy and now only has translational energy due to the breaking of the bond, depicted by the plateau after 30s. Experimentally IR could be used to see the progress of the reaction. Only molecules with a dipole are IR active, thus after the formation of a H-F bond, IR absorption absent in the reactant will start to appear with overtones suggesting higher vibrational energies reached.
Discuss how the distribution of energy between different modes (translation and vibration) affect the efficiency of the reaction, and how this is influenced by the position of the transition state.
Below, various examples of both reactions are used to illustrate Polanyl's rules.[5] Reactions with late transition states are more efficient when the initial trajectory possesses vibrational energy whereas reactions with early transition states are more efficient when the initial trajectory possesses translational energy. The following examples illustrate these rules.
Setup a calculation starting on the side of the reactants of F + H2, at the bottom of the well rHH = 74 pm, with a momentum pFH = -1.0 g.mol-1.pm.fs-1, and explore several values of pHH in the range -6.1 to 6.1 g.mol-1.pm.fs-1 (explore values also close to these limits). What do you observe?
When using the parameters above and setting the F-H value to 200 pm, at lower momentum values vibrational frequencies were obversed. The reactions did not therefore take place, satisfying Polyanyi's rules, where possessing translational energy is more efficient when there is an early barrier rather than vibrational energy. Even at higher momentum extremes shown in figure 9, the reaction does not go to completion, indicating even though a lot of energy is being put into the system, surpassing the activation energy , it is not an efficient reaction as there is not enough translational energy present, satisfying the rules.
For the same initial position, increase slightly the momentum pFH = -1.6 g.mol-1.pm.fs-1, and considerably reduce the overall energy of the system by reducing the momentum pHH = 0.2 g.mol-1.pm.fs-1. What do you observe now?
Figure 10 shows that, even at lower momentum values, resulting in lower vibrational energies the reaction still does not proceed to completion, as there is not enough translational energy in the reaction, further satisfying Polyanyi's rules.
Focus on the reverse reaction, H + HF.
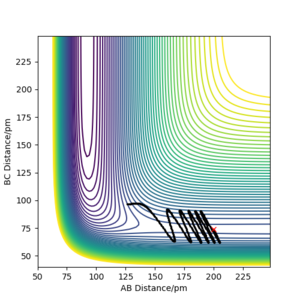
This reaction has a late transition state, thus according to Polanyi's rules, a vibrational energy trajectory is more efficient. This was tested firstly by using a low H-F vibrational energy and a high H translational energy as shown in figure 11. As predicted the reaction did not proceed to completion as there was not enough vibrational energy in the reaction. Figure 12 shows an example where the reaction has a larger vibrational energy, and therefore is more efficient, resulting in a successful reaction, satisfying Polanyi's rules. All questions answered and correctly - good report. Pu12 (talk) 20:45, 11 June 2020 (BST)
References
- ↑ 1.0 1.1 Steinfeld, Jeffrey I, Chemical kinetics and dynamics, Prentice Hall, 1999, ch. 10, pp. 287-321.
- ↑ Wired Chemist,http://www.wiredchemist.com/chemistry/data/bond_energies_lengths.html, (accessed May 2020).
- ↑ Laidler, Keith J, Chemical kinetics, HarperCollins, 1989, ch. 12.3, pp. 460-471.
- ↑ Niels E. Henriksen and Flemming Y. Hansen, Theories of Molecular Reaction Dynamics: The Microscopic Foundation of Chemical Kinetics, Oxford University Press, Oxford, United Kingdom ; New York, NY, 2019, ch. 3, pp. 39-54
- ↑ Steinfeld, Jeffrey I, Chemical kinetics and dynamics, Prentice Hall, 1999, ch. 9, pp. 272-274.
