MRD:01524183
Molecular Reaction Dynamics: Applications to Triatomic systems
by Anjli Suchak
From start to end your report has been joy to mark. It was simple and clear to follow with thorough discussions throughout. Additionally, no errors in your work and great to see you referencing. Keep up the fantastic work, you're doing a great job! Mys18 (talk) 10:59, 26 June 2020 (BST)
Introduction
The main aims of this experiment were to study the reactivity of triatomic systems, involving the collision of an atom and a diatomic molecule, by calculating Molecular Dynamic trajectories. The systems studied were the symmetric H-H-H system and the non-symmetric F-H-H system.
It has been rare to see an introduction, good job for this. Mys18 (talk) 10:37, 26 June 2020 (BST)
Exercise 1: The H + H2 system
The original H2 diatomic is defined as BC with the A H atom colliding to form the AB H2 diatomic molecule.
On a potential energy surface diagram, how is the transition state mathematically defined? How can the transition state be identified, and how can it be distinguished from a local minimum of the potential energy surface?
On a potential energy surface diagram, the transition state (TS) is mathematically defined as the point at which the gradient of the potential with respect to the internal coordinates is zero (∂V(ri)/∂ri=0). This is because the transition state is the local maximum on the minimum energy paths between the reactants and products. There would be no movement of the H atoms at the TS since the force is a derivative of the potential energy and at the TS this is zero therefore the transition state is a stationary point. However, minima are also stationary points. The TS can be distinguished from a local minimum of the potential energy surface by taking the second differential of the potential function. By doing so, the nature of the stationary point can be determined: if the second differential is greater than zero, the point is a local minimum and if it is less than zero, the point is a local maximum (the TS).
This is good, the TS is a maximum on the lowest energy pathway... the second derivative would indeed give a negative value, but to truly check it is a TS which you highlighted as being a first order saddle point the second derivative will be negative, and the orthogonal direction to that will give a positive value as well. Then you know it is the TS. Check out what a saddle point is, it may help make sense of why we see a positive and negative. Mys18 (talk) 10:41, 26 June 2020 (BST)
Using the GUI simulation, the TS was identified by trial and error. At the TS the distance AB and BC must be equal (rAB = rBC), as the H + H2 surface is symmetric. Therefore the TS lies somewhere along the diagonal line where AB and BC are equal. As the TS is approached, the size of the forces along AB and BC decreases to zero and so the point at which these forces are close to zero is the TS of the potential energy surface. This maximum point can be distinguished from a local minimum by analysing the omega squared values under the Hessian eigenvalues/vectors. A TS is a maximum in one direction and a minimum in the other direction; it is a saddle point. Therefore at the TS, the omega squared would be positive in one direction and negative in the other direction.
I now see you have discussed the point above here :) Mys18 (talk) 10:42, 26 June 2020 (BST)
Report your best estimate of the transition state position (rts) and explain your reasoning illustrating it with a “Internuclear Distances vs Time” plot for a relevant trajectory.
The transition state position (rts) was found to be 90.8 pm to 1 d.p.
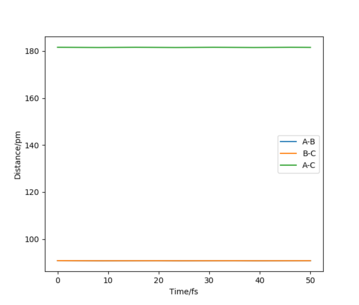
This value gave forces of +0.001 kJ.mol-1.pm-1 along AB and BC which are approx. zero. Also, the omega hessian eigenvalues had opposite signs which verified that this point was the TS.
At the TS, the internuclear distances between AB and BC are the same and so the distance between AC is approximately double the AB (BC) distance. This is shown in the plot of "Internuclear distances vs Time" (Figure 2), as two straight lines of constant distances of AB and BC at 90.8 pm and AC at approximately 181.6 pm. This is because at the TS the H atoms are stationary, with one H atom (the B atom in this case) being approximately halfway between the A and C H atoms.
Perfect Mys18 (talk) 10:43, 26 June 2020 (BST)
Comment on how the mep and the trajectory you just calculated differ.
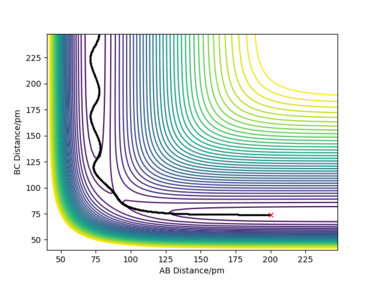
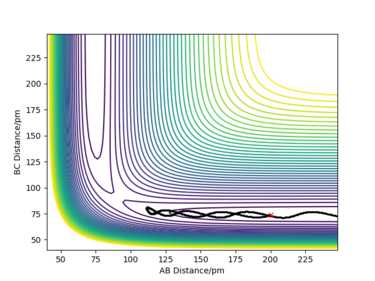
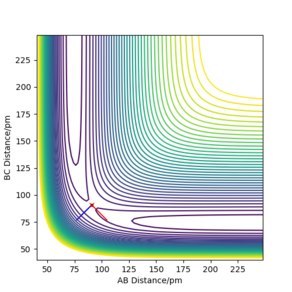
The minimum energy path (mep) is the lowest energy path from reactant to product; it is a special trajectory that correlates to infinitely slow motion. The mep was calculated by setting the initial conditions as rBC = 91.8 pm (1 pm displaced from the TS position) and rAB = 90.8 pm (the TS position). The number of steps was also increased to 2500 in order to obtain a complete mep. This calculation was repeated with the calculation type set to 'Dynamics'.
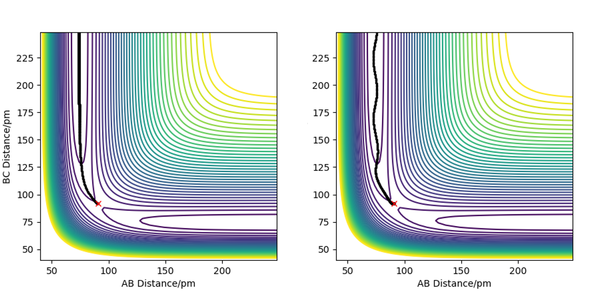
As shown in the plots above, the mep is a smooth trajectory (left) which indicates that the BC molecule is not vibrating as the system is not oscillating between energy contours. This is because the mep doesn't provide a realistic view of the motion of atoms during a reaction; it assumes the atoms are moving at an infinitely slow speed. However, there would be vibration occurring between B and C as they are moving further away from each other. This is shown by the wavy trajectory produced from the dynamic calculation (right).
Excellent! You have addressed all points I would look for. Mys18 (talk) 10:44, 26 June 2020 (BST)
Complete the table by adding the total energy, whether the trajectory is reactive or unreactive, and provide a plot of the trajectory and a small description for what happens along the trajectory. What can you conclude from the table?
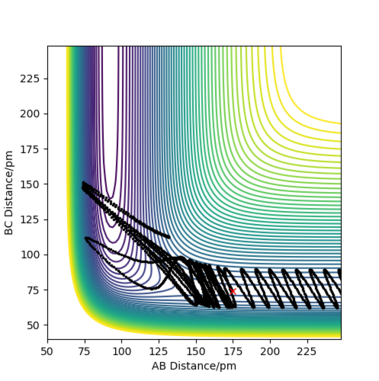
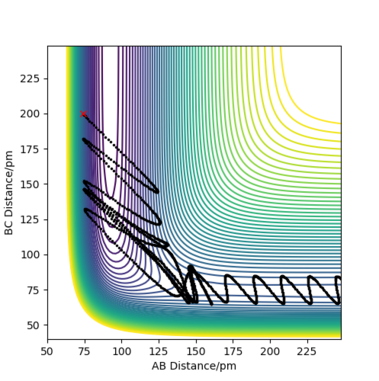
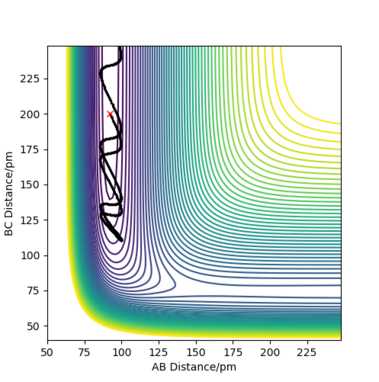
For the initial positions rBC = 74 pm and rAB = 200 pm, trajectories were run for five different momenta combinations (p1 is pBC and p2 is pAB).
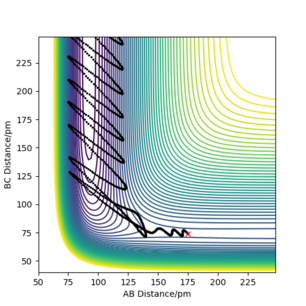
From the table, it can be concluded that not all trajectories starting with the same positions but with higher values of momenta would be reactive. For example, increasing the value of momenta to -5.1 g.mol-1.pm.fs-1 for p1 and -10.1 g.mol-1.pm.fs-1 for p2 still gives an unreactive trajectory. Also, low values of momenta can be reactive as is the first momenta combination (Figure 5). This is because vibrational energy also needs to be taken into account, not only the kinetic energy. The degree of vibrational and translational energy is determined by analysing the trajectory line shape: a more wavy line would mean more vibrational energy whereas a more smooth line corresponds to more translational energy.
Good. Mys18 (talk) 10:45, 26 June 2020 (BST)
Given the results you have obtained, how will Transition State Theory predictions for reaction rate values compare with experimental values?
The TS theory is a theory used to determine absolute reaction rates based on the reactant and transition state structure properties. A few important assumptions this theory makes are[1]:
- Every trajectory that has enough energy to roll over the TS will definitely go to form the products. This means that once the reactants have crossed the energy barrier they can't go back to form reactants.[1] Therefore the overall rate of reaction of reactants to products increases, overestimating the rate.
- The concentration of the TS is in equilibrium with the reactant concentration; this is known as the Quasi-equilibrium hypothesis ([X]‡ = 0.5 KC‡ [A][B], where A + B → X‡ → P). This means that even though there is no equilibrium between reactant and product molecules, the transition states that are becoming products are distributed among their states according to the Maxwell-Boltzmann laws.[1] This leads to an overestimate of the rate of reaction.
- Quantum tunnelling is not taken into account; the theory is treated purely classical as a translation. If quantum tunnelling was taken into account the rate would increase so in this case the theory underestimates the rate.
As the first assumption is the most crucial, it has a larger weighting effect on the rate compared to quantum tunnelling. Therefore overall the TS theory predictions overestimate the reaction rate values compared to the experimental values.
Clearly laid out. Good job. Are the effects of quantum tunnelling evenly weighted for heavier and lighter atoms? Mys18 (talk) 10:48, 26 June 2020 (BST)
Exercise 2: F - H - H system
By inspecting the potential energy surfaces, classify the F + H2 and H + HF reactions according to their energetics (endothermic or exothermic). How does this relate to the bond strength of the chemical species involved?
The F + H2 reaction (forward reaction) is exothermic as the reactants are at a higher energy in comparison to the products therefore energy is released to the surroundings. The H + HF reaction (backward reaction) is endothermic as the products are at a higher energy than the reactants. The exothermicity of the forward reaction indicates that the bond strength of HF is larger than that of HH as the energy required to break the HH bond is less than the energy released upon forming HF. Also, the endothermicity of the backward reaction means that the energy required to break the strong HF bond is greater than the energy released to form the products (F and H2). This is confirmed by the literature values of HF and HH bond strengths of 565 kJmol-1 [2] and 436 kJmol-1 [2] respectively.
again this is exemplary. Can you further confirm the bond strengths using your bonding knowledge of H2 and HF... Mys18 (talk) 10:49, 26 June 2020 (BST)
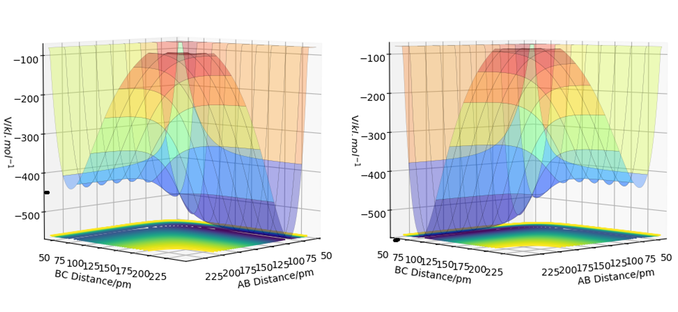
Locate the approximate position of the transition state.
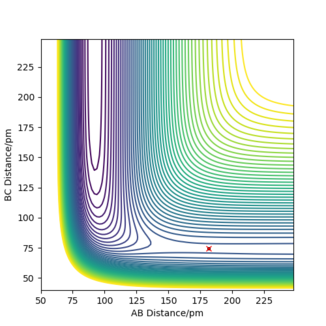
The transition state for both the forward (F + H2) and backward (H + HF) reactions is at the same point. As the system is not symmetric, the TS is not defined as the point where AB = BC, instead Hammond's postulate is used in order to determine the TS point. The Hammond's postulate states that the TS of a reaction resembles the reactants if the reaction is exothermic (an early TS) and it resembles the products if the reaction is endothermic (a late TS). Therefore, the TS would be close to the reactants of the forward reaction and the products of the backward reaction which is the same (F + H2). So by setting the initial conditions such that AB is a larger distance than BC (where A: F, B: H and C: H), the TS was found. The momenta values were set to zero because the nuclei are stationary at the TS as it is a saddle point.
The transition state position (rts) was approximated to be at an AB distance of 181.4 pm and BC distance of 74.5 pm (A: F, B: H and C: H).
These values gave force values along AB and BC of 0.000 kJ.mol-1 and 0.006 kJ.mol-1 respectively, which are close to zero, as expected at the TS point. They also gave Hessian eigenvalues/vectors of opposite signs which also indicated that this was the TS position.
Report the activation energy for both reactions.
The activation energy is the difference in energy of the TS and the minimum of the reactant channel. This difference is smaller for the forward (F + H2) exothermic reaction compared to the backwards (H + HF) endothermic reaction. The minimum point was found by testing different distance values until the energy value was constant as this is when the plateau has been reached.
The energy of the TS was found to be -433.98 kJ.mol-1.
For the F + H2 reaction, the minimum point (reactants energy) was -435.10 kJ.mol-1. The activation energy was found to be -433.98--435.10 = +1.12 kJ.mol-1 (where A: F, B: H, C: H and AB is a larger distance than the BC bond distance of HH).

For the H + HF reaction, the minimum point (reactants energy) was -560.70 kJ.mol-1. The activation energy was found to be -433.98--560.70 = +126.72 kJ.mol-1 (where A: F, B: H, C: H and BC is a larger distance than AB bond distance of HF).
The activation energies could also be found by performing a mep calculation (see Figure 13).
Great, the values are what I would expect! Good methodology. Mys18 (talk) 10:53, 26 June 2020 (BST)
In light of the fact that energy is conserved, discuss the mechanism of release of the reaction energy. Explain how this could be confirmed experimentally.
Excellent and very well discussed! Mys18 (talk) 10:55, 26 June 2020 (BST)
A reactive trajectory of the F + H2 reaction is shown in Figure 14, as a contour plot. Initially, the reactants have more translational kinetic energy therefore the atoms are moving very fast. Whereas, after the reaction has occurred (the region where the BC distance is increasing), there is more vibrational energy as there are more oscillations in the product valley. Therefore, potential energy is being converted to vibrational energy and the system releases the reaction energy as vibrational energy. In this way, the conservation of energy is held true. This could be confirmed experimentally by IR spectroscopy (IR absorption) and infrared chemiluminescence (emission of vibration by IR light).
IR spectroscopy
For the exothermic F + H2 reaction, initially, all the molecules are in the ground state in the H2 gas. However, as a result of the reaction, a small proportion of the molecules are excited and transfer to a vibrationally first excited state. This can be seen from the plot (Figure 14), as the vibrational energy increases in the product channel. Therefore, the IR spectrum of the thermally relaxed sample would show one absorption peak. However, the excited sample would show a fundamental peak, corresponding to the excitation from the ground state to the first excited state, and also an overtone peak, corresponding to the excitation from the first excited state to the second excited state, at a lower wavenumber. The peaks would be at different wavenumbers due to the anharmonicity of the potential energy surface. By measuring the intensity of the overtone over time, the number of molecules that are vibrationally excited as time goes on can be deduced. The intensity of the overtone would decrease, as energy would be released as radiation due to exothermicity of the reaction, therefore there would be fewer molecules in the first electronically excited state over time. Whereas, the intensity of the fundamental peak would increase as more molecules would be in the ground state which could be excited to the first excited state.
Infrared chemiluminescence
This is another method for examining the energy distribution in the products. In this case, vibrationally excited molecules emit infrared radiation as they return to their ground states. The populations of the vibrational states of the products may be determined by studying the intensities of the IR emission spectrum.[3]
Discuss how the distribution of energy between different modes (translation and vibration) affect the efficiency of the reaction, and how this is influenced by the position of the transition state.
From Polyani's rules, it can be deduced that for exothermic reactions, translational energy is more effective than vibrational energy at overcoming the TS barrier. Whereas, for endothermic reactions, vibrational energy is more effective than translational energy at passing the TS barrier.[4] Therefore, an early energy barrier favours more highly vibrational products and a late energy barrier favours products with more translational energy.[5]
For exothermic reactions the TS is located in the reactant channel (early TS) therefore molecules with most energy in motion would easily be able to surmount the barrier. This is because a vibrationally excited reactant molecule would be too busy oscillating from side to side and so wouldn't have enough energy left to reach the top of the TS barrier. Therefore, the reactant vibrational energy in excess of the TS barrier height may be ineffective for the reaction.[5]
For endothermic reactions, the TS is located in the product channel (late TS), therefore reactant molecules with most vibrational energy would easily be able to cross the barrier. This is because the vibrationally excited reactant molecules would be travelling down the reactant channel; they have to travel further in order to cross the TS barrier. The chances of the reactant molecules with the correct phase finding the TS barrier is higher due to the higher amount of vibrational energy. A reactant molecule with more translational energy, in this case, would simply slam into the repulsive inner wall of the potential surface and bounce back into the entrance channel.[5]
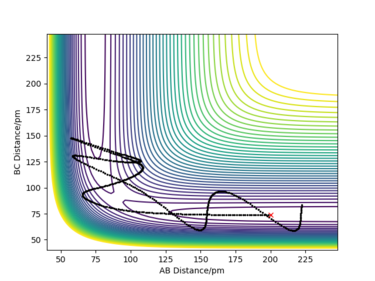
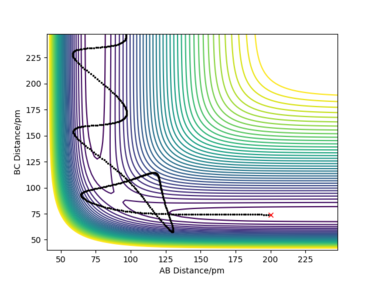
Some example trajectories are given in the table below in order to show this concept.
Fantastic, it is obvious you have clearly understood Polanyi's rules! Mys18 (talk) 10:57, 26 June 2020 (BST)
Conclusion
In conclusion, the outcomes of chemical reactions were studied by analysing transition states, reaction coordinates, contour plots and potential energy surfaces. The systems studied involved the collision and reaction between an atom and a diatomic molecule in a linear configuration in the gas phase. The reactions analysed were H + H2, F + H2 and H + HF. If the reaction had a reactive trajectory, it formed a new diatomic molecule and an atom. Lastly, for a chemical reaction to take place the energy must be distributed correctly in the molecules; they must be in the right vibrational and translational modes at the right time.
It is even rarer to see conclusions. Perfectly summarised. Mys18 (talk) 10:58, 26 June 2020 (BST)
References
- ↑ 1.0 1.1 1.2 I. Steinfeld, J. S. Francisco, W. L. Hase, Chemical Kinetic and Dynamics 2nd ed., Prentice-Hall, 1998, Ch. 10, pg. 290
- ↑ 2.0 2.1 Darwent, B. deB., Bond Dissociation Energies in Simple Molecules. Natl. Stand. Ref. data Syst. 1970, 31, pg. 9-48.
- ↑ Atkins, P.; Paula, J. de; Keeler, J. Atkins’ Physical Chemistry, 11th ed.; Oxford University Press, 2018, Ch. 18, pg. 804
- ↑ K. J. Laidler, Chemical Kinetics, 3rd ed., Harper-Collins, 1987, Ch. 12, pg. 460-471
- ↑ 5.0 5.1 5.2 J. I. Steinfeld, J. S. Francisco, W. L. Hase, Chemical Kinetic and Dynamics 2nd ed., Prentice-Hall, 1998, Ch. 9, pg. 272-274

