MRD:01524069
Great report! You answered all parts showing good understanding. I would say your references are great, but to improve you could signify where in your text you used the references. Well Done! Mys18 (talk) 22:39, 1 June 2020 (BST)
H-H-H system
On a potential energy surface diagram, how is the transition state mathematically defined? How can the transition state be identified, and how can it be distinguished from a local minimum of the potential energy surface?
- The transition state is mathematically defined as the point on Potential Energy Surface (PES) diagram where the the first derivative of the potential energy with respect to the distance is 0 and any deviation from that transition state will involve a decrease in potential energy. However this point could also be a local minimum so to distinguish between the two you must calculate the second partial derivative with respect to the distances r1 and r2 between the atoms, these are orthogonal axes. If these give both positive values then the point you have found is a local minimum and not the transition state. The transition state would be a saddle point and this means that there would be one positive value and one negative value from the derivative.
- The transition state is the maximum point on a minimum energy path linking reactants and the products. Both a transition state and a local minimum will remain at these points if a trajectory was started exactly at the TS/local minimum with no momentum. However, if you change the trajectory slightly and it reverts back to the original state, it is a local minimum but if it rolls towards either the reactants or products (depending on the parameters), it is a transition state.
Great explanation. You could also include an equation to make your point eg for second derivative. Mys18 (talk) 22:21, 1 June 2020 (BST)
Report your best estimate of the transition state position (rts) and explain your reasoning illustrating it with a “Internuclear Distances vs Time” plot for a relevant trajectory.
- To find the TS you can use a plot of Internuclear Distances vs Time and test various bond lengths whilst keeping momenta values set to 0. The value which gives no oscillation will be the TS.
- The best estimate of the transition state is when rAB=rBC=0.90777 Å. This was concluded by using an internuclear distances vs time plot where AB=BC=0.90777 Å and p1=p2=0 (shown below) this shows that there is no oscillation in the internuclear distances as time goes on.

This figure shows the internuclear distances , A-B, B-C and A-C, are constant over time so there is no change in geometry meaning this is the position of the transition state. The forces along AB and BC are 0.000 g.mol-1.pm.fs-1.
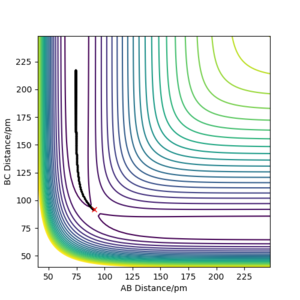
Comment on how the MEP and the trajectory you just calculated differ.
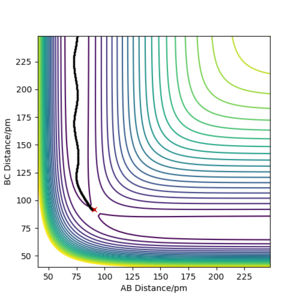
- The Minimum Energy Path (MEP) is the lowest energy pathway from reactant to product and therefore the most likely reaction mechanism that occurs. The calculations assume that the atoms have no mass and therefore the reaction trajectories have no oscillation so the plot shows a smooth line. These calculations consider the motion of the atoms to be inertial.
- The Dynamic trajectory shows the oscillations along the minimum energy trajectory as it treats the system as an atom and a diatomic molecule. The diatomic molecule has vibrational energy and so oscillations are shown.
Good! Mys18 (talk) 22:23, 1 June 2020 (BST)
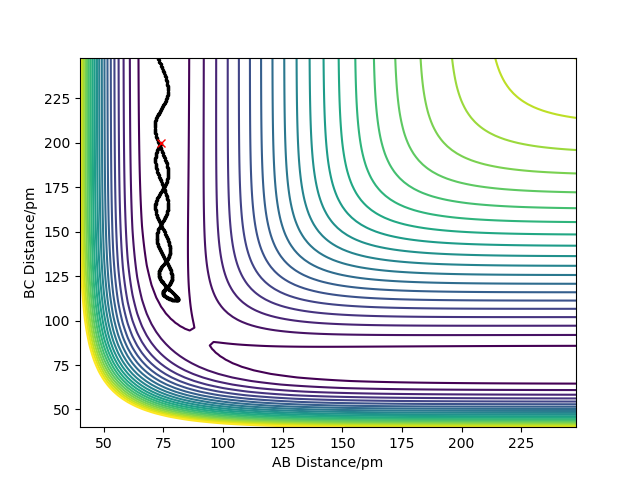
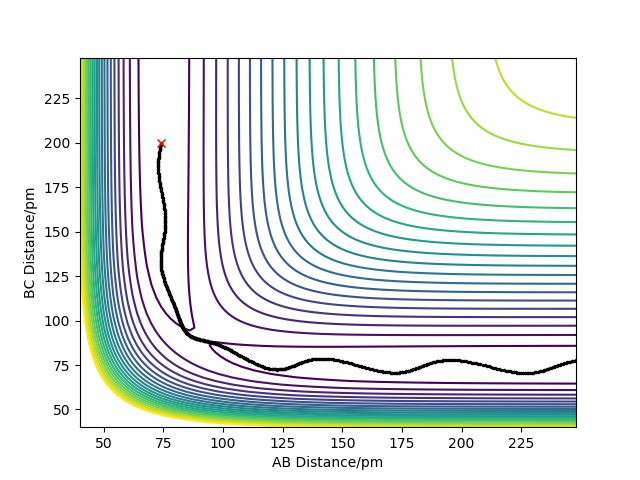
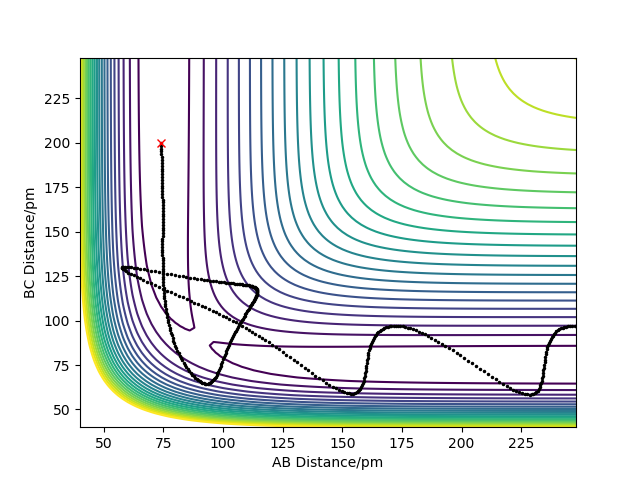
Complete the table by adding the total energy, whether the trajectory is reactive or unreactive, and provide a plot of the trajectory and a small description for what happens along the trajectory. What can you conclude from the table?
R1= 74 pm and R2= 200 pm
Given the results you have obtained, how will Transition State Theory predictions for reaction rate values compare with experimental values?
The main assumption of Transition State Theory (TST) is the Born-Oppenheimer approximation which is the assumption that the motion of atomic nuclei and electrons in a molecule can be treated separately as the nuclei are much heavier than the electrons. The nuclei move as if the electrons are equilibrated to their current position and electrons equate to the position of the nuclei at each moment in time. Another assumption is that the reactants must collide with enough energy to overcome the Transition State energy barrier. All collisions with kinetic energy higher than the activation energy should result in products being formed.
The TST overestimates the rate of a reaction. Electron tunnelling is not taken into account in this model and neither is the quantisation of vibrations. The TST assumes that when the reaction has gained enough energy to overcome the TS energy barrier that the formation of products is possible. It may not be as simple as this as some trajectories have high enough energies but the reaction does not result in the products being formed. This may be due to formed products having a high vibrational energy which causes the bond to break and barrier recrossing is observed. Barrier recrossing is not allowed in TST and so this could be why it overestimates the reaction rate. Conditions 1 and 3 are likely to give predicted rates of reaction similar to experimental values as the reactants overcome the TS energy barrier and form the products. Condition 2 does not have enough energy to cross the TS energy barrier so the reaction does not proceed. The rate for the reaction would be predicted accurately and be similar to the experimental value. Condition 4 crosses the barrier but it is likely the products have a very high vibrational energy and so barrier recrossing is observed which TST could not predict as TST says that 100% of barrier crossings form products. Condition 5 shows the formation of products but it does not occur through the TS. This could not be predicted by TST. The reason this reaction could go ahead may be due to higher vibrational modes in in the molecule being populated and so the trajectory does no pass through the TS as the TS is the lowest energy saddle point. The rates for condition 4 and 5 could not have been predicted accurately using TST.
Good, why is tunelling not considered? hint classical approach. Born-Oppenheimer Approx. is this directly the TST? Mys18 (talk) 22:53, 1 June 2020 (BST)
F-H-H system:
By inspecting the potential energy surfaces, classify the F + H2 and H + HF reactions according to their energetics (endothermic or exothermic). How does this relate to the bond strength of the chemical species involved?

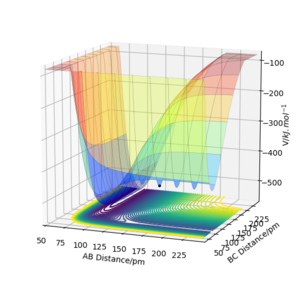
Atom A = H, Atom B =H and Atom C = F
Figure 3.1 shows the PES of the reaction of HF + H → HH + F and from this you can see that the reaction is endothermic as the reactants HF and H have more energy than the products HH and F. Figure 3.2 shows the PES of the reverse reaction of HH + F → HF + H which is therefore exothermic.
This tells you that the the HF bond strength (565 kJmol-1) is much stronger than the H2 bond strength (432 kJmol-1) as energy is released when the HF bond is formed. The relative bond strengths can be accounted for the fact the HF bond has some ionic character due to the difference in electronegativity of the H and F atoms.
Nice! Did you calculate those bond strengths? references needed if not... Good bonding justification. Mys18 (talk) 22:31, 1 June 2020 (BST)
Locate the approximate position of the transition state.
To find the transition state of the system both of the momentum values set to 0 g.mol-1.pm.fs-1 and the distances between the atoms were changed slightly until the TS was found. The transition state of the system was found be rHH =0.74486 Å rFH = 1.81120 Å. This is verified by the fact that on the Internuclear Distances vs Time graph, the lines have no oscillation to them. Also the forces along on the H-H and F-H bonds are 0.
These look correct. You could always include a figure to illustrate the TS position.. Mys18 (talk) 22:33, 1 June 2020 (BST)
Report the activation energy for both reactions.
The method I used to calculate the activation energy for both reactants was to give one of the bonds momenta until that bond had enough momenta to roll over the saddle point and revert the reactants of each reaction. The energy of the transition state and the reactants was noted and the difference calculated. this value corresponds to the activation energy for the reactions.


The activation energy for the reaction of FH+H → HH+H was found to be 126 kJmol-1 and the activation energy for there reaction of HH+H → FH+H was found to be 1.185 kJmol-1.
In light of the fact that energy is conserved, discuss the mechanism of release of the reaction energy. Explain how this could be confirmed experimentally.
A reactive trajectory for the HH + F → HF + H, the parameters used were: rFH= 181.120 with p = 0 and rHH = 74.486 with p=2.5.
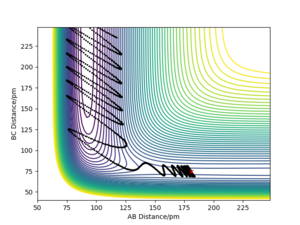
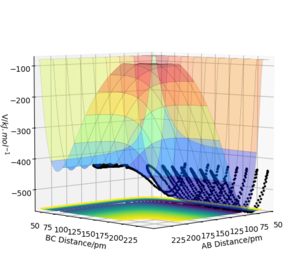


The contour plot shows that the product HF has a much higher vibrational energy than the reactants as the oscillations are much wider (this can also be seen on the PES).The Momenta vs Time graph shows how the momenta changes from the HH bond to the HF bond so you can monitor the course of the reaction through this graph. The Energy vs Time graph shows that energy is conserved throughout the reaction as the total energy is always constant. The energy of the system must stay constant as this is an isolated system. When the kinetic energy goes to a maximum, the potential energy accounts for this by dropping to a minimum.
When an excited HF molecule collides with other molecules the energy will most likely be released as heat to the surroundings. Experimentally, this could be confirmed by using a gas-phase FTIR spectrum of the product. This would show the vibrational excited state electrons relaxing back to the ground state by detecting the release of a photon. The energy of the photons would correspond to the difference in electronic states
Discuss how the distribution of energy between different modes (translation and vibration) affect the efficiency of the reaction, and how this is influenced by the position of the transition state.
Hammond’s postulate states that the TS of a reaction resembles either the reactants or the products, to whichever it is closer in energy. In an exothermic reaction, the TS is closer to the reactants than to the products in energy. So the TS of an exothermic reaction will resemble the reactants more. In an endothermic reaction, the TS is closer to the products than to the reactants in energy. So the TS of an endothermic reaction will resemble the products more.
Polanyi's empirical rules state that the influence of the initial distribution of reactant energy between vibrational and translation energy affects whether a successful reaction occurs and the successful ratio depends on the location of the TS energy barrier (whether it's an early or late TS). An early TS, which is shifted towards the reactants, in an exothermic reaction, can be crossed easier if there is higher translational energy in the reactants. A late TS, which is shifted towards the products, in an endothermic reaction, can be crossed easier if there is higher vibrational energy in the reactants.
Clear and simple explanation. Good job. Mys18 (talk) 22:36, 1 June 2020 (BST)
| p(HH) Reactants Vibrational Energy | p(HF) Products Translational Energy | HH + F → HF + H |
|---|---|---|
| -0.3 | -2.0 |  |
| -2.0 | -0.3 | 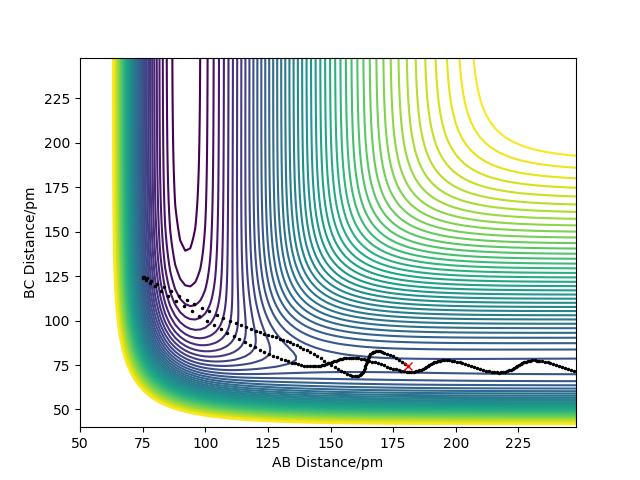 |
This table shows that having a higher translational energy in the reactants for a reaction which has an early TS and is exothermic, will lead to a successful trajectory. If you swap these values round and have a higher vibrational energy in the reactants for the same reaction, the trajectory will not be successful.
References:
- P. W. Atkins, Atkins' Physical Chemistry, 2018
- Keith J. Laidler (ed.), Chemical Kinetics 1987, 88
- J. E. Meany, V. Minderhout and Y. Pocker, Journal of Chemical Education, 2001, 78, 204 (DOI:10.1021/ed078p204)
- A. C. Vaucher and M. Reiher, Journal of Chemical Theory and Computation, 2018, 14, 3091-3099 (DOI:10.1021/acs.jctc.8b00169)
- J. C. Polanyi, 08 May 1987, Vol. 236, Issue 4802, 680-690 (DOI:10.1126/science.236.4802.680)


