MRD:01516896 rp318
Overall this is a nicely laid out report which was easy to follow (makes marking a joy!). There were a few misunderstandings especially at the start, but this improved as the report went on. It is obvious effort went into the report and there is emphasis on understanding not simply getting correct answers. But as mentioned previously understanding improved as the report progressed with great figures, so I will count that in your favour and your bonus point references. See below for comments. Mys18 (talk) 22:43, 24 June 2020 (BST)
H + H2 System
(r1 = rH1H2,r2 = rH2H3, p1 = pH1H2 and p2 = pH2H3)
Transition State of reaction
Defining the transition state
The transition state of a reaction is considered to be a hypothetical state in between the reactants and the products [1]. On a potential energy surface diagram, it is usually found at the point where the gradient of the potential energy surface diagram is zero and is a maximum. The point of zero gradient of potential energy surface diagram can be found from looking at the first derivatives et equal to zero. To find whether the point is a maximum, the second derivative of the graph is needed. A maximum is found when the second derivative of stationary point is less than zero.
Second sentence should read 'maximum on the minimum energy pathway' otherwise it is misleading to believe the TS to be a maximum, the gradient for aTS is always zero. You may be following the wrong idea here... If you search around what a saddle point is it may help with your understanding. With distinguishing between a local minimum and a TS you are correct you can take the second derivative. For a TS because of it being a first oder saddle point (search what that entails wrt. minima and maximums) you would expect the second derivative to be a minimum in one direction and the orthogonal direction to be maximum (positive or negative refers to which maximum or minimum?). A local minimum would not show this change from negative and positive regardless of direction. What would a local minimums second derivative always be, less than or greater than zero?Mys18 (talk) 22:14, 24 June 2020 (BST)
Position of transition state
The transition state of H +H2 will have r1 = r2 as the potential energy surface diagram is symmetrical. By starting the simulation with the trajectories of the molecule at the point where gradient is zero, the positions of the atoms at the transition state (rTS) can be found. The rTS was estimated to be 90.8 pm.

The graph of internuclear distance against time shows that the positions of the atoms are stationary. This shows that the trajectory will oscillate but never move any further suggesting that the trajectory is on a ridge on the potential energy surface where the gradient perpendicular to the ridge is zero.
Nice. Are you sure you think your figure implies oscillation? It looks like two flat lines to me which would signify no oscillation at this geometry hence, the TS.Mys18 (talk) 22:20, 24 June 2020 (BST)
Trajectories from r1 = rts+δ, r2 = rts
The difference between minimum energy pathway and dynamics calculations
The minimum energy pathway (mep) was found for the reaction. The MEP plot does not show the vibrational energy of the product, giving a straight line following the bottom of the well.


When the trajectories are changed from r1 = rts+δ and r2 = rts to r2 = rts+δ and r1 = rts, the internuclear distance against time plot give the same shape but with the distance of AB increasing instead.
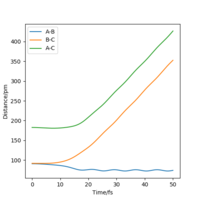
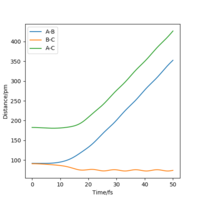
Calculations ran with final positions as the initial positions and changing the direction of the momenta showed the increase in energy of reaction up to the transition state and the reaction energy falling back down in the same well as it went up (reactants).
A note for presentations, always label your graphs and diagrams with 'Figure x.' so you can discuss them in your answer to make sure the reader is looking at he figure you mean. Here I know which to look for :). I think your Dynamic and MEP plots also show other main difference, visually what is the difference, I would say dynamic looks more wavy. Why do you think that is? Hint - consider atomic motion in your thoughts. follow up question, which would be more realistic MEP or dynamic?Mys18 (talk) 22:25, 24 June 2020 (BST)
Reactive and Unreactive Trajectories for H-H-H system
Reactions were run with a wide range of momentums. The table shows that the reaction run with greater momentums can be unreactive. This is due to the products having enough kinetic energy to revert back to the reactants. The reverse reaction would have the same activation energy as reactants and products are the same. As shown above, reactions can also happen with values of momentum lower than -3.1 < p1 / g.mol-1.pm.fs-1 < -1.6 and p2 = -5.1 g.mol-1.pm.fs-1.
ExcellentMys18 (talk) 22:26, 24 June 2020 (BST)
Comparison with transition state theory
Transition state theory states that reactants that have enough energy to reach the TS will form the products. From the experimental values, it shows that that is not the case as there is TS barrier recrossing and the reactants can be formed again. This would mean that the rate of reaction predicted by transition state theory would be an overestimation of the experimental rate of reaction.
Perfect! Don't be shy in referencing how you know things, did a textbook or paper tell you that TST assumes you go to completion from reactants to products? There are other assumptions of TST, although they may not directly apply to your findings above it's worth outlining them. Additionally one other may relate, look up quantum tunnelling and the significance of TST classical approch to this.Mys18 (talk) 22:29, 24 June 2020 (BST)
F-H-H System
(r1 = rH2H1,r2 = rFH2, p1 = pH2H1 and p2 = pFH2)
PES inspection
Classifying the F + H2 and H + HF reactions according to their energetics
The reaction F + H2 forming products H + HF is an exothermic reaction. This can be seen from a potential surface energy diagram as the well for reactants is higher in energy than the well for reactants. The reverse reaction is an endothermic reaction. The bond dissociation energy for H2 and HF are 436.0 kjmol-1 and 566.1 kjmol-1 [2] respectively.
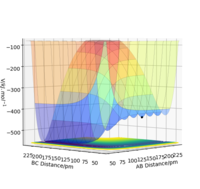
F + H2 is exo and H + HF is endo, good. Great search for bond dissociation energies! you could go one step further and expand on that. Do they make sense? H2 weaker bond than HF (Yes it makes sense!) you can go ahead and explain why in terms of bonding. Mys18 (talk) 22:32, 24 June 2020 (BST)
Locating the approximate position of the transition state
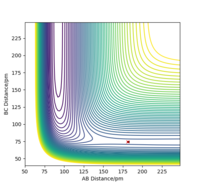
The transitions state of F + H2 was found by testing different initial conditions of r1 and r2 with p1 = p2 = 0.0 g.mol-1.pm.fs-1. The transition state was found when the forces along distances r1 and r2 are zero. Hammond's postulate, the transition state of a reaction will either resemble the products or reactants depending on whichever has closer energy [3], was taken into account in finding the position of the transitions state. As the F + H2 was exothermic, it can be deduced that the transition state would have positions that are similar to the reactants. The approximate position of TS was found to be r1 = 74.49 pm and r2 = 181.11 pm.
Activation energy for reactions
The activation energy of the reactions was found using mep calculations and plotting graphs of energy against time.


The activation energy for each reaction was found by finding the difference between the energy at reactants or products and the transition state energy. The activation energy for the reaction F + H2 and H + HF are +0.171 kjmol-1 and +126.588 kjmol-1 respectively.
Good job. Values look reasonable and units all perfect :)Mys18 (talk) 22:34, 24 June 2020 (BST)
Reactive and Unreactive Trajectories for F-H-H system
Reaction Trajectories for F + H2
A set of reaction trajectories that forms the reaction r1 = 74 pm and r2 = 200 pm with p1 = - 3.88 r1 and r2 with p1 = p2 = 0.0 g.mol-1.pm.fs-1 and p2 = -2.12 g.mol-1.pm.fs-1.
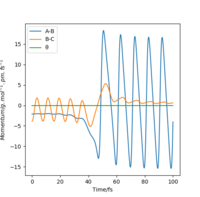
The graph of momentum against time shows that the HF formed have a large amount of momentum and therefore shows that it has a large amount of kinetic energy (as vibrational energy of bond). This can be measured experimentally by measuring the absorption or emission spectrum of the products. IR spectroscopy can be used to measure the absorption spectrum. As the products have gained vibrational energy, it is energetically excited which can be seen on the IR spectra as a small peak next to the main peak (as an overtone). Raman spectroscopy can be used to measure the emission spectrum of the product. Raman spectroscopy depends on the scattering of photons. When molecules absorb the energy of the incident photon, it moves up in energy state. The relaxation of energy state back to vibrational energy level causes an emission of a photon by the molecule.
Cool! you could look up 'chemiluminescence' which may be useful in monitoring the emission of infrared radiation from the sample.Mys18 (talk) 22:36, 24 June 2020 (BST)
| p1/ g.mol-1.pm.fs-1 | p2/ g.mol-1.pm.fs-1 | Illustration of the trajectory |
|---|---|---|
| -6.0 | -1.0 | 
|
| -5.0 | -1.0 | 
|
| -4.0 | -1.0 | 
|
| -3.0 | -1.0 | 
|
| -2.0 | -1.0 | 
|
| -1.0 | -1.0 | 
|
| 0.0 | -1.0 | 
|
| 1.0 | -1.0 | 
|
| 2.0 | -1.0 | 
|
| 3.0 | -1.0 | 
|
| 4.0 | -1.0 | 
|
| 5.0 | -1.0 | 
|
| 6.0 | -1.0 | 
|
The table above is a list of trajectories tested for the reaction F + H2 with the initial positions set at r1 = 74 pm and r2 = 200 pm. The graphs show that around half of the reactions form the product. All the graphs show that the product form has high amounts of vibrational energy, due to the conservation of energy, that can cause the reaction to reverse.

The trajectory r1 = 74 pm and r2 = 200 pm with p1 = 0.2 g.mol-1.pm.fs-1 and p2 = -1.6 g.mol-1.pm.fs-1 was run and a graph showing the reaction crossing the TS barrier, the product gaining vibrational energy and the energy of the product increasing to the TS energy again.
Reaction Trajectories for HF + H
Prior to running calculations for the reaction, the initial trajectory set was r1 = 200 pm and r2 = 92 pm with p1 = 0 g.mol-1.pm.fs-1 and p2 = 0 g.mol-1.pm.fs-1

Comparison to Polanyi's empirical rules
Polanyi's rules state that an endothermic reaction is activated more easily with vibrational energy while exothermic energy is activated by more easily by translational energy. Vibrational energy is able to activate reactions with late transition state as vibrational energy is able to put the trajectory of the reaction in a direction that would cross the ts barrier. Vibrational energy is less effective in activating reactions with an early transition state as it interferes the downwards flow of energy in an exothermic reaction. This is shown in the reactions above (F + H2 and H + HF).
Great work. But what would be more effective than the vibrational energy instead for an early TS? Mys18 (talk) 22:39, 24 June 2020 (BST)


