MRD:01514934
Exercise 1: H + H2 system
- On a potential energy surface diagram, how is the transition state mathematically defined? How can the transition state be identified, and how can it be distinguished from a local minimum of the potential energy surface?
On a potential energy surface, the transition state is defined as the saddle point or the local maximum, where the derivative of potential energy V with respect to the coordinate ri is zero (i.e. ∂V(ri)/∂ri=0). To distinguish the local maximum from the local minimums, a second derivative can be calculated. If the second derivative is larger than 0, it means that the stationary point is a local minimum. If it is smaller than 0, it indicates a local maximum, which is thus the transition state.
Good description, a diagram can support this Sf3014 (talk) 19:19, 31 May 2020 (BST)
- Report your best estimate of the transition state position (rts) and explain your reasoning illustrating it with a “Internuclear Distances vs Time” plot for a relevant trajectory.
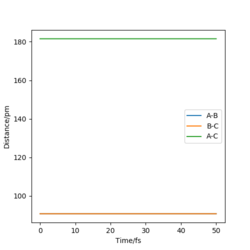
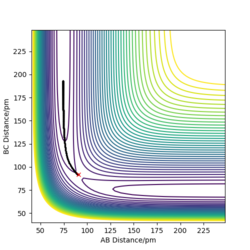
The estimated transition state position (rts) is at 90.77 pm. At the transition state of this system, the distances of AB and BC would be the same and the forces acting on the atoms (the first derivatives) would be zero, meaning that the atoms are stationary. In the "internuclear distance vs time" plot (Figure 1) , the distances of AB, BC and AC remain unchanged and the distances of AB (r2) and BC (r1) have the same values. Therefore, 90.77 pm is the transition state position.
Good but why are the AB and BC distances the same? Sf3014 (talk) 19:19, 31 May 2020 (BST)
- Comment on how the mep and the trajectory you just calculated differ.
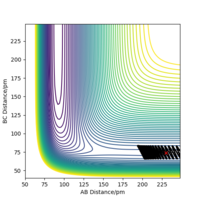
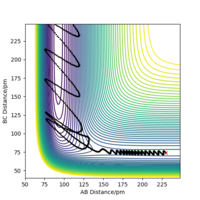
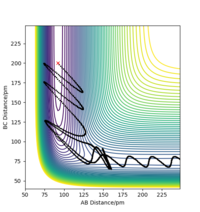
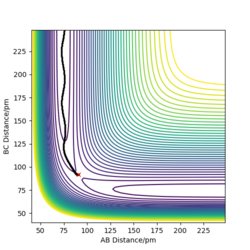
The mep does not include kinetic energy so it will not show the atom motions. In contrast, the dynamics trajectory includes kinetic energy so the distance of AB oscillates slightly, which is shown in Figure 3, whereas mep shows a linear trajectory in Figure 2.
Good but your comparison. But if you compared more evidence, like your momenta vs time graphs you’ll have more information to add in your comparison between dynamic and mep calculations. Sf3014 (talk) 19:19, 31 May 2020 (BST)
· Look at the “Internuclear Distances vs Time” and “Momenta vs Time”. What would change if we used the initial conditions r1 = rts and r2 = rts+1 pm instead?
If the initial conditions r1 = rts and r2 = rts+1 pm are used, the distance AB (r2) is the one that increases instead of distance BC (r1), and p2 is the one that oscillates instead of p1.
The last geometry is: r2=74.05 , p2 =3.20, r1=352.59, p1=5.07.
· Setup a calculation where the initial positions correspond to the final positions of the trajectory you calculated above, the same final momenta values but with their signs reversed.
The motion of atoms are reversed. Before they were moving oppositely. Now they approach each other.
- Complete the table above by adding the total energy, whether the trajectory is reactive or unreactive, and provide a plot of the trajectory and a small description for what happens along the trajectory. What can you conclude from the table?
The total energy includes the kinetic energy and potential energy of the system. For the trajectory to be reactive, the total energy must be distributed correctly so that the kinetic energy is higher than the activation energy. Even though the requirement for kinetic energy is fulfilled, it is still possible that the trajectory is unreactive like the second last case, which suggests that the transition state region can be recrossed. Therefore, energy is not the only factor that decides whether the trajectory is reactive or not.
Very good table layout and conclusion Sf3014 (talk) 19:19, 31 May 2020 (BST)
- Given the results you have obtained, how will Transition State Theory predictions for reaction rate values compare with experimental values?
The predictions of Transition State Theory is overestimated compared to the experimental values. In TST, once the reactants have enough kinetic energy along the reaction coordinates to cross the transition state, it cannot go back to the reactants, which contributes largely to the overestimation of the reaction rate values. If recrossing is available, the reaction rates would decrease. TST ignores the possibility of quantum tunneling, which would increases the reaction rates but the effect is negligible.1
Very good but why are quantum tunnelling effects negligible? What scale are we looking at? Sf3014 (talk) 19:19, 31 May 2020 (BST)
Exercise 2: F-H-F system
PES inspection
- By inspecting the potential energy surfaces, classify the F + H2 and H + HF reactions according to their energetics (endothermic or exothermic). How does this relate to the bond strength of the chemical species involved?
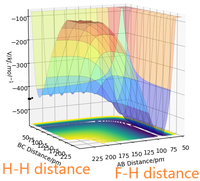
The PSE of F-H-F system (Figure 4) shows that the F + H2 reaction is exothermic because the reactants have higher energy than the products. This means that the formation of H-F bond of the product releases more energy than the energy required to break the H-H bond of the reactant. The H + HF reaction is endothermic because the reactants are lower in energy than the products. This means that the breaking of H-F bond requires more energy than the energy released by formation of the H-H bond of the product. Therefore, it can be concluded that the H-F bond is stronger than the H-H bond.
Very good and clear descriptions but how does this compare to the published bond energies? Sf3014 (talk) 19:19, 31 May 2020 (BST)
- Locate the approximate position of the transition state.
For exothermic reactions, the transition state resembles the reactants more so it has an early transition state. For endothermic reactions, the transition state resembles the products more so it has a late transition state. Along with the fact that the Hessian matrix has one positive eigenvalue and an negative one and the forces are zero at transition state, it can be estimated that the position of the transition state is r(FAHB)ts = 180.6 pm, r(HBHC)ts = 74.5 pm.
Your explanation on how you found the position of the transition state (TS) is unclear. Firstly, why does the TS resemble the reactants for exothermic reactions? Where is this information from? Secondly how does the Hessian matrix relate to the TS? This is not mentioned anywhere. Sf3014 (talk) 19:19, 31 May 2020 (BST)
- Report the activation energy for both reactions.
The energy of the transition state is -433.981 kJ mol-1. The energy of the reactant was found by displacing the transition state slightly towards the reactants. The energy of H + HF is -560.141 kJ mol-1. The energy of F + H2 is -435.100 kJ mol-1. Therefore, the activation energy of the F + H2 reaction is 1.119 kJ mol-1. The activation energy of H + HF reaction is 126.16 kJ mol-1.
Good but your description on the activation energy would be clearer if you referred to the energy vs time graph and included it in your report. Sf3014 (talk) 19:19, 31 May 2020 (BST)
Reaction dynamics
- In light of the fact that energy is conserved, discuss the mechanism of release of the reaction energy. Explain how this could be confirmed experimentally.
For the exothermic F + H2 reaction, once the product is formed, the release of reaction energy causes the vibrational excitation of the product. The IR chemiluminescence can be used to confirm the mechanism because as the vibration excited product relax back to the ground state, it emits photons, which can be detected by this technique.2
Okay but this is not a discussion. You should use the relevant evidence to explain and show how energy is conserved and refer to that evidence. Also, explain how IR chemiluminescence can be used as the reaction proceeds, make it very clear to me how you make your measurements. Sf3014 (talk) 19:19, 31 May 2020 (BST)
- Discuss how the distribution of energy between different modes (translation and vibration) affect the efficiency of the reaction, and how this is influenced by the position of the transition state.
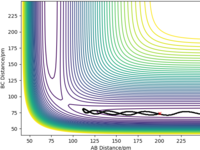
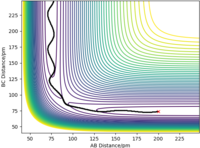
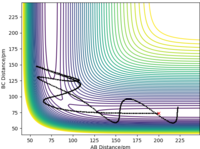
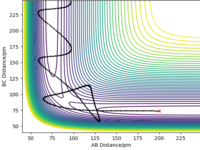
Endotheric reactions have a late transition state. For late transition barrier, the vibrational energy is better at promoting the reaction than the translational energy because if it's translational energy, the system would hit the barrier and bounces back to the reactants. In contrast, if the transition state is early for exothermic reaction, the translational energy would be more effective.3 The illustrations in the table below show some examples of the Polanyi's empirical rules. The first two set of conditions corresponds to the exothermic F + H2 reaction. Even though the reactants have higher kinetic energy in the first set of conditions than those in the second set, the first trajectory is not reactive because the vibrational energy increases as the kinetic energy increases and vibrational enery is not good at promoting the exothermic reaction. In comparison, the second trajectory is reactive because the low kinetic energy is mainly translational, which can promote exotheric reaction. The third and fourth sets of conditions are for the endothermic H + HF reaction. As shown, the trajectory becomes reactive with higher kinetic energy, meaning more vibrational energy.
Very good but number your trajectories so referring to them is clear. Also, your references are not linked properly, information on how to do this is given in your lab script. Sf3014 (talk) 19:19, 31 May 2020 (BST)
References
1 J. I. Steinfeld, in Chemical kinetics and dynamics, 2nd., 1989, pp. 287–321.
2 J. C. Poianyi, Science, 1987, 236, 680–690.
3 K. J. Laidler, in Chemical Kinetics, 3rd., 1987, pp. 460–471.


