MRD:01512921
Reaction dynamics report
Introduction
During this lab, the potential energy surfaces (PES) of three different reactions were analysed, along with their reaction trajectories. The PES were used to identify the transition state and observe how different momenta and inter-nuclear distances affect the outcome of the reaction. It was also observed how the position of the transition state determines which type of energy, vibrational or translational, is needed to overcome the energy barrier.
Chemical reactions can be simulated by taking into consideration the relative positions, such as the distances, between the atoms involved in the reaction. In fact, the interaction that causes the atoms' motion depends on their location and is described as a PES, a function relative to the coordinates of the atoms [1]. The region of space of the PES is separated into the reactants, where the system is before reacting, and the products regions, where the system is after reacting[2]. The boundary between these two regions is the transition state[2]. The PES allows to solve classical equation of motion for collision coordinates; for the systems analysed in this report, there are only two coordinates: r1, the distances between the atoms of the reacting molecule, and r2[1], the distance between the atoms of the product molecule. The path of the reaction can be mapped with a reaction trajectory. A reactive trajectory will pass through a saddle point of the PES, also know as transition state(TS[1]). On the contrary, an unreactive trajectory will roll back toward the reagents upon meeting the TS[1].
To understand the reactions and successfully predict their rates, the conventional transition state theory is used[3]. The only information necessary is the behaviour of the potential energy surface near the transition state and the reactants[4]. This theory is based on the following assumptions:
- It is possible to separate the motion of the collision from the other motions of the TS[3].
- Energy distributions is in accordance with the Maxwell-Boltzmann distributionc[3].
- it's impossible for a system to revert back to the reagents once the energy barrier is overcome[3].
- the reaction is treated classically and the quantum effects are ignored[3].
Exercise 1
For the exercise, A + BC ==> AB + C is mirrored by H + H2 ==> H2 + H. Therefore, AB= r2 and BC=r1
Q1: On a potential energy surface diagram, the transition state is defined as the saddle point, which causes the first derivative of the potential (the slope) to be zero. To test whether the point found is a saddle point or a local minimum, the second partial derivative test can be used. The test takes into consideration the determinant, D, of a Hessian matrix, a 2x2 matrix of partial derivatives of the function, which is generated by the program. If the determinant is positive, the point is either a maximum or a minimum. If the determinant is negative, then the point is a saddle point[5].
Good but what is the hessian matrix? Also, you need to be very clear if you are not going to show the derivatives of V(r1,r2) in your description, ie for your statement about the transition state you forget to mention that it is a partial derivative Sf3014 (talk) 21:43, 5 June 2020 (BST)
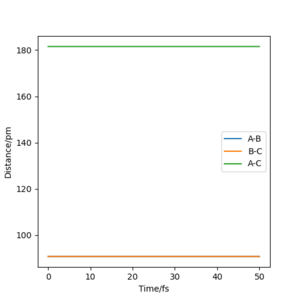
Q2: The best estimate of the transition state position (rts) is at AB=BC=90.8 pm. By having equal distances, neither hydrogen (A or C) is favoured in forming a bond with hydrogen B. It was identified by observing the forces on the single atoms: at TS, they all approached zero, as the vibrational energy is zero due to the absence of bonds. The value was obtained by trial and error: the first distance chosen was 150 pm, as it's the distance between atom A and C at the start of the reaction divided by two. The forces resulted to be quite negative (-1.759), so the value was lowered until eventually they reached zero. From the animation window, it was possible to observe how the atoms went from a periodic vibration ( at 150 pm) to being stationary at 90.8 pm. This can also be observed in the “Inter-nuclear Distances vs Time” plot, where the distances between the atoms are constant in time.
Good but what is your accuracy for the distances? If you round the value up you should state the accuracy, so your values are reliable. I noticed that you gave the forces to 3 d.p, so your distances can be to at least 3 d.p. Also, If you number your figures it will make it easier for you to refer to them and clearer for the reader. Sf3014 (talk) 21:51, 5 June 2020 (BST)
Q3: A MEP and a dynamics calculation for AB= 90.8 and BC= 91.8 were run. The dynamics calculation resulted in a longer distance between atom B and C once the reaction finished; the reaction rolls toward the products.
Okay, I think there is some misunderstands of what you were meant to do here. You were meant to comment on how the mep calculation differed from dynamic. You need to include evidence using the mep calculation and comment on it in comparison to the evidence you provided. So, when you mentioned that "dynamics calculation resulted in a longer distance...", longer than what? what does this mean for dynamics compared to mep calculation? Your evidence will show that mep is a minimum energy pathway which accounts for no vibrations and a zeroing momenta. Sf3014 (talk) 22:04, 5 June 2020 (BST)
If the values are exchange, AB= 91.8 and BC=90.8, then the transition state rolls back to the initial reagent and the molecule AB is not formed. This is illustrated by the following plots:
- in the Inter-nuclear distance vs time plot, the initial value of AB is equal to that of BC. However, as time increases, the distance between A and B increases while that of B and C gets smaller.
- in the momenta vs time plot, the initial values are the same. After a small amount of time, the momenta decreases and then increases in different ways. The molecule BC presents a vibrating momentum, while the momentum of A-B increases until it reaches a plateau when they are quite far.

Plot of the momenta vs time. The transition state rolls back to the reagents. 
Plot of the Inter-nuclear distances vs time. The transition state rolls back to the reagents.
With AB= 91.8 and BC=90.8 and the dynamic set up, the data in following table was obtained. Using the final values of the reaction, a new calculation was performed. This time, the result was the two reactant getting closer together to reach the transition state, where the calculation ended.
| distances | momenta | |
|---|---|---|
| r2 | 352 | 5 |
| r1 | 75 | 3.2 |
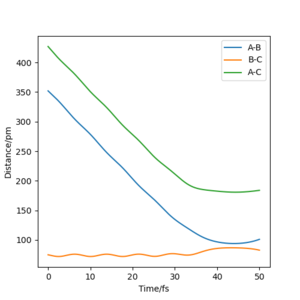
Q4: for the initial position of r1= 74 pm and r2= 200 pm, the following table was obtained using the momenta given.
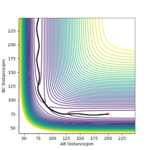
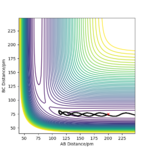
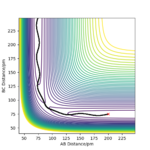
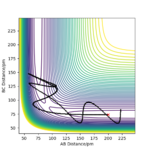
For a successful reaction, kinetic energy possessed by the reagents has to be enough to overcome the saddle point. The momenta were varied so that the molecules had different kinetic and vibrational energy, in order to observe if the product were formed and if they were formed in a vibrational mode. For the first three reactions, if only one of the reagent was in the momenta range proven successful by previous calculations ( -3.1 < p1/ g.mol-1.pm.fs-1 < -1.6 and p2 = -5.1 g.mol-1.pm.fs-1), then the reaction was successful [6] . The last two example are cases of barrier crossing [7], which goes against one of the assumption of the conventional transition state theory.
Good table layout but your descriptions could be clearer, ie describe the approach of the atom based on the decrease in the AB distance and comment on barrier recrossings (when the reaction does proceed). Your conclusion good but your range for p1 is confusing. Why the mention of transition state theory (TST) for the last two cases? Are you saying it doesn't abide by your rules because it doesn't abide by TST? Be careful with your wording. Sf3014 (talk) 22:22, 5 June 2020 (BST)
Q5:The conventional transition state theory assumes that as long as there is enough kinetic energy to overcome the energy barrier, then the reaction will proceed and it's not possible to recross the barrier[3]. However, the theory doesn't take into consideration the possibility of quantum tunnelling, as the conventional transition state theory is purely classical motion. [3]
In fact, if the system tunnels through the PES, then the kinetic energy could be lower than the one needed to reach the TS, as the system can go through it: therefore, the rate constant form the CTST KTST is overestimated [3] compared to that of the program which is used in this exercise (it takes into consideration barrier crossing).
Good, but this is not clear, what is CTST? You need to define abbreviations, ie conventional transition state theory (CTST) did you can abbrievate. Also, no barrier recrossing and classical model will have different effects on the experimental rate of the reaction compared to CTST, unles you clearly state that one will have a bigger affect than the other. Please, refer to your intro for the information on CTST, you put some work into it so use it. Sf3014 (talk) 22:22, 5 June 2020 (BST)
Exercise 2
Q1:
F+ H2 ==> FH + H, where AB=r1=H2 and HF=BC=r2
- The reaction is exothermic as the energy of the reagents is higher that that of the products.
- Position of TS: AB= 74.5 pm and BC = 181pm .
- It was identified thanks to Hammond's postulate: the position of the transition state determines if it will more closely resemble the products or the reagents[8]. In this case, the transition state is early, as the reaction is exothermic. Therefore, the TS will resemble the reagents and the separation between the hydrogens of the H2 molecule will be smaller than that of HF.
- Total energy-433.98 KJ mol-1.
- Energy of reagent:-560.592 KJ mol-1
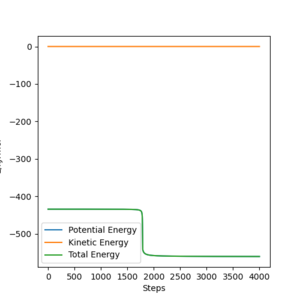
- Activation energy is: -126.612
H + HF ==> H2 +F where AB=r1=HF and H2=BC=r2
- The reaction is endothermic as the energy of the reagents is lower that that of the products.
- Position of TS: HF = 95 pm, H2=250 pm
- Energy is -433.98 KJ mol-1
- Reagent energy: -434.012 KJ mol-1
- Activation energy: -0.032 KJ mol-1

Strength of the bonds: Strength of H2 = 436 KJ mol[9]
Strength of HF = 569 KJ mol[9]
When breaking a strong bond to make a weaker bond, more energy is required and the reaction is endothermic. Therefore the formation of H2 from HF and H is endothermic, while the formation of HF is exothermic.
Good job on linking the bond energies to your description. However, this section seems really rushed. For the reaction types you should show the potential energy surface and refer to it in your description, since you tried describing it in your description. You need some more description and use of the relevant evidence to describe how you found the transition state positions but good try on that. And your calculations for the activation energy is not clear, refer to your graphs and support your description by zooming in on the total energy part of the graph and labeling it. Sf3014 (talk) 22:46, 5 June 2020 (BST)
Q2, part 1:
F +H2 ==> HF + H is an example of mixed energy release, where a high amount of the released energy is converted into vibrational energy of HF[10]. This can be confirmed by spectroscopic methods like infrared, as it would be possible to see overtones due to the transition from the first to the second vibrational excited state.
Good but use the relevant evidence to show how the energy released is being converted into vibrational energy. Also, more description is needed on how this can be measured, how will you gain IR results as the reaction proceeds? Sf3014 (talk) 22:53, 5 June 2020 (BST)
A reactive trajectory was found at r1=74 pm, r2=150 pm and the following momenta: pHF= -1.0 g.mol-1.pm.fs-1 and pHH= -2 g.mol-1.pm.fs-1.

A calculation was set up with r1=74 pm, r2=150 pm and the following momenta: pHF= -1.0 g.mol-1.pm.fs-1 and pHH between -6.1 and 6.1 g.mol-1.pm.fs-1. While changing value of the HF momenta, it was noticed that at pHF= -6.1 the atom HB bounced several time between the atom HA and F. Between -6.1 and -3.1, the transition state was still crossed more than once to go back to the reagents, but the number of times this happened decreased from value to value. From -3.1 to 3.1, the reaction was successful with high vibrational energy in the products. At 3.1, the reaction has a barrier recrossing, where the product forms only to roll back to the reagent and then a second time toward the product. At 4.1, there is a barrier recrossing but the reaction is not successful. Barrier recrossing is also seen at 6.1, with a successful collision. At 5.1 g.mol-1.pm.fs-1, the reaction reaches the Ts and then has a few barrier recrossing. However, the simulation ends with Hb exactly in the middle between Ha and F, not showing which reaction's side was preferred.
For the same initial conditions, the following changes were applied pHF=-1.6 g.mol-1.pm.fs-1 and pHH=0.2 g.mol-1.pm.fs-1. With these settings, the reaction was successful, with the excess energy released as vibrational energy in the HF bond.
This is all very hard to follow, there are lots of undefined numbers and descriptions of behaviours with no links to the evidence that you are describing. It's a long description with very little links to a potential conclusion, ie no mention of what these numbers are/what you are doing, in terms of vibrational and translational energies Sf3014 (talk) 23:05, 5 June 2020 (BST)
Q2, part 2: FH + H ==> H2 +F
A reactive trajectory was obtained with the following set up r1=HF=74 pm, r2=HH=200 pm and the following momenta: pHF= 4.5 g.mol-1.pm.fs-1 and pHH= 0.5 g.mol-1.pm.fs-1. The skew plot of the reaction is shown.

Q5: The energy distribution of the products can be determined by locating the energy barrier on the reaction coordinate (The TS). For a reaction is A+ BC:
- an early barrier or TS will result in high vibrational energy in the products. In an exothermic reaction, the energy is released while AB distance is changing
- a late barrier results in low vibrational energy in the products. The energy is released after AB is formed and BC is changing, which corresponds to the formation of the products and the translational energy.
Good but you need to state how you know this ie refer to your evidence and Polanyi's rules Sf3014 (talk) 23:05, 5 June 2020 (BST)
The position of the energy barrier would also help selecting what distribution of reactant energy is most likely to lead to a reaction.
- for an early TS, a molecule with high translational energy will be able to overcome the barrier, as all its motion along the reaction coordinates. On the other hand, a molecule with high vibration will not have enough energy to reach the barrier.
- for a late TS, the barrier will be overcome by vibrational energy rather than translational. In fact, a molecule with high translational energy will crash in the inner wall of the PES and bounce back[11].
Conclusions
The investigation of the reaction dynamics, for the three reactions examined in the lab, concerned with the PES and the reaction trajectories. Using the program, it was possible to identify the transition state of the reaction (using Hammond's postulate), the trajectories (both reactive and unreactive ones) and the activation energies (thank to the energy of the transition state and of the reactants). A comparison was made between the rate constant from the canonical transition state theory and the experimental one. It was noted how, since the CTST is treated classicaly and hence does ot take into consideration the tunelling effect, the CTST overestimates the rate of the reaction. By analysing the transition state, it was possible to observe how its position influences which energy, translational or vibrational, is required for the reaction to happen. An early transition state can be overcome with translational energy, while a late one will prefer high vibrational energy.
References
- ↑ 1.0 1.1 1.2 1.3 J.I Steinfeld, J.S. Francisco, W.L. HAse, Chemical kinetics and dynamics,Prentice-Hall, 2nd ed., 1989,Upper Saddle River, chap 8, pp 232-239.
- ↑ 2.0 2.1 T. Bligaard, J.K. Nørskov,Chemical Bonding at Surfaces and Interfaces,A. Nilsson, L. G.M. Pettersson, J. K. Nørskov,Elsevier,2008, Chap. 4, pp. 255-321.
- ↑ 3.0 3.1 3.2 3.3 3.4 3.5 3.6 3.7 K.J. Laidler,Chemical kinetics, Harper & Row, 3rd ed., 1987, London, chap 4, pp 88-123
- ↑ B. Peters,Reaction Rate Theory and Rare Events Simulations, Elsevier, 2017, chap 10, pp.227-271
- ↑ W. Kaplan, B. J. Berne, G. Ciccotti, D. F. Coker, Maxima and Minima with Applications: Practical Optimization and Duality, John Wiley & Sons, 1998, chap 2, pg 103-105
- ↑ Atkins, P. W., and Julio De Paula, Atkins' Physical chemistry. Oxford: Oxford University Press, 2006, chapter 18, pg 807-808
- ↑ W. Kaplan, B. J. Berne, G. Ciccotti, D. F. Coker, Maxima and Minima with Applications: Practical Optimization and Duality, John Wiley & Sons, 1998, chap 1, pg 3-23.
- ↑ Roman F. Nalewajski, Elżbieta Broniatowska, Information distance approach to Hammond postulate, Chemical Physics Letters, Volume 376, Issues 1–2, 2003, Pages 33-39
- ↑ 9.0 9.1 C. Yoder, 2020, "Common Bond Energies (D) and Bond Lengths (r)", Wired Chemist, http://www.wiredchemist.com/chemistry/data/bond_energies_lengths.html, May 2020.
- ↑ K.J. Laidler,Chemical kinetics, Harper & Row, 3rd ed., 1987, London, chap 12, pp 460-471
- ↑ J.I Steinfeld, J.S. Francisco, W.L. HAse, Chemical kinetics and dynamics,Prentice-Hall, 2nd ed., 1989,Upper Saddle River, chap 9, pp 272-274.

