MRD:01512138
Overall this is a very well put together report in terms of presentation and also your answers. You have provided clear explanations and in depth discussions throughout. Great job in including references. Keep up the great work! Mys18 (talk) 11:19, 26 June 2020 (BST)
EXERCISE 1: H + H2 system
Dynamics From the Transition State Region
The transition state on a potential energy surface (PES) is mathematically defined as the (stationary) point at which the gradient of the potential is zero: ∂V(ri)/∂ri=0. The transition-state structure is a saddle point that lies on the lowest energy path between two minima: physically it is the highest energy point on a reaction coordinate and the minima correspond to stable chemical species (reactants and products).
If a trajectory with zero initial momentum is launched at the transition state it will remain at that exact point forever. When the geometry is perturbed from this point in the direction of the reactants or products, the system will 'roll' towards the reactant or product states respectively. This makes the location of the transition state discernible by initiating one of the trajectories close to the transition state. The reactants, products and intermediates share the mathematical property of zero gradient and are all stationary points of the PES. The transition state can be distinguished from local minima by considering the Hessian matrix features: the eigenvalues of the computed matrix will disclose the mathematical nature of any stationary point. For the local minima (of non-linear molecules)the 3N-6 eigenvalues are all positive as movement in any direction will increase the energy. For the transition state, 3N-7 of these eigenvalues will be positive but one will be negative. This saddle point has minimum energy paths in the directions of local minima (reactants, products and intermediates) which represent the reaction coordinates, but the also represents a point of maximum energy. The eigenvector associated with he negative eigenvalue will reveal the direction of the reaction coordinate path.
Nice! To distinguish between TS and LM I would look to taking the second derivative. If it is a local minimum then I would expect a positive value in all directions. If it is a TS, as you mentioned is a saddle point on a PES, so it will give a negative value but in an orthogonal direction to that the value will then be positive - that will identify the TS. Mys18 (talk) 11:04, 26 June 2020 (BST)
Trajectories from r1 = r2: locating the transition state
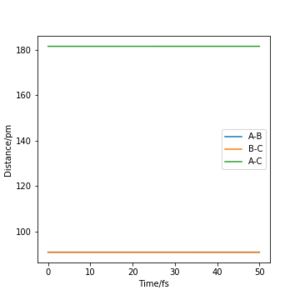
For the symmetric H + H2 surface the transition state was located considering r1 = r2 and p1= p2 = 0.0 g.mol-1.pm.fs-1. An estimate of the transition state position (rts) was found at r1 = r2 = 90.77 ppm. This is verified by looking at a plot of the internuclear distance as a function of time: the gradient of the the distance A-B = B-C = A-C = 0 showing that there is no oscillation of the atoms along the ridge r1 = r2.
Good!Mys18 (talk) 11:05, 26 June 2020 (BST)
Trajectories from r1 = rts+δ, r2 = rts
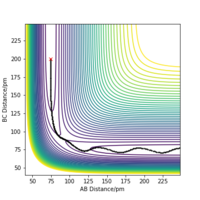
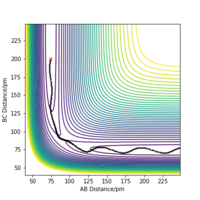
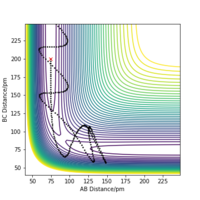
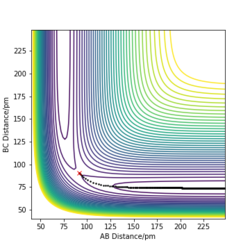
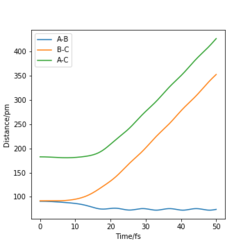
Figure 2. shows the minimum energy path (mep) trajectory run at the transition state; the trajectory simply follows the valley floor to H1+ H2-H3. Any point on the path is at an energy minimum in all directions perpendicular to the path and there is "infinite friction" acting on the system. This frictional force means that the system can gain no momentum and "rolls" along the lowest energy path. Contrary to this, the dynamics trajectory (Figure 3.) shows the system has some vibrational energy as the atoms oscillate. This is because of the momentum is increasing and the force on the atoms builds up and leads to vibration. The dynamics calculation therefore represents the system more realistically than the mep trajectory, since the atoms will have some vibrational energy.

Exactly! and we visually see a more wavy line for dynamic. Mys18 (talk) 11:06, 26 June 2020 (BST)
Trajectories from r2 = rts+δ, r1 = rts
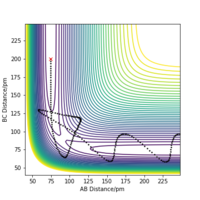
Looking at the “Internuclear Distances vs Time” dynamics trajectories for the displacement described above, r1 = rts+δ, r2 = rts, against r2 = rts+δ, r1 = rts it is apparent that the products of each reactive pathway are different. In the dynamics trajectory described above, the products are HB-HC + HA where as with new the initial conditions, r2 = rts+δ, r1 = rts, the products are HA-HC + HB. The trajectories are identical however the change in the displacement of specific atoms leads to this variation in the products.

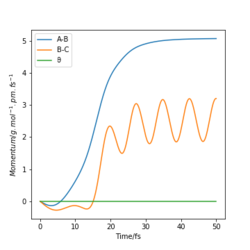
Likewise in the "Momenta vs Time" plots for each set of initial conditions, the plots illustrate how in each trajectory leads to the system 'rolling' into different sets of products. The products are represented in each case by the oscillating momentum as a function of time.

Reactive and Unreactive Trajectories
Determining the conditions for a reactive trajectory starting in the region of the reactants and passing near the transition state
The table of reaction trajectories above reveals the conditions necessary for a relative pathway: not only must the system have sufficient kinetic energy to overcome the activation barrier of the reaction pathway, but they must also have an appropriate balance of this kinetic energy with the vibrational energy of the products obtained. If the vibrational energy of the products is too large, and sufficient to overcome the activation barrier to reform the products (e.g. barrier recrossing), the reactants may reform and the pathway is therefore unreactive.
Precisely! Really good finds. Mys18 (talk) 11:07, 26 June 2020 (BST)
Transition State Theory
Transition State Theory allows for the average transmission rate with which the reactant trajectories reach the divide between the reactants and products on a potential energy surface. This is a functional way for calculating the rate of chemical reactions however, it makes some assumptions that limit its accuracy. One key assumption is the presumption that all trajectories with sufficient kinetic energy to surpass the activation barrier along a reaction coordinate will be reactive: the system cannot recross the barrier in the direction of the reactants.[1][2] In making this assumption the potential for barrier recrossing is ignored which, as demonstrated above, can occur practically. This means that in reality, a proportion of the trajectories with sufficient energy to surpass the activation barrier will end up reverting to the reactants, hence reducing the amount of reactive trajectories. Therefore, the actual rate of the reaction is lower than that predicted by Transition State Theory and is somewhat overestimated by the theory when compared to experimental values.
This a great discussion. What are the other TST assumptions. What is one assumption that may not have as big of an impact but still must be considered (hint - quantum tunnelling...)Mys18 (talk) 11:09, 26 June 2020 (BST)
EXERCISE 2: F - H - H system
PES inspection
Inspection of the potential energy surfaces for the F + H2 reaction the reaction type can be assigned according to the energetics. From the potential energy surfaces it can be seen that the activation barrier occurs early in the reaction pathway. This tells us, with reference to Hammond's Postulate, that the reaction is exothermic. Hammond's postulate states that the transition state for a reaction resembles either the reactants or products depending on which it is closest to in energy. In an exothermic reaction the transition state is closer to the reactants: it is early or 'reactant like'. Where as in an endothermic reaction the transition state is located closer to the products and is said to be late or 'product-like'. In a similar sense, the potential energy surfaces for the H +HF system reveal that the reaction is endothermic in nature; the activation barrier occurs late in the reaction pathway.2 The energetic properties are related to the bond strength of the species involved. In the F + H2 reaction a strong H-F bond is formed which will release energy and is therefore exothermic in nature. In the H +HF reaction this strong H-F bond is being broken. This is energetically demanding and therefore the products will be higher in energy than the reactants- the reaction is endothermic.
Good. We can take this further and explain why HF has a stronger bond than H2 (your bonding knowledge) and then you can search literature for bond energy values for HF and H2 to further support your explanation. Mys18 (talk) 11:11, 26 June 2020 (BST)
Locating the Transition State
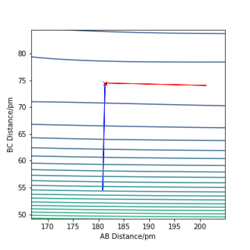
With the above knowledge of the reaction energetics, the transition state of the F-H-H system was located as H-F=181.3 pm and H-H=74.5 pm as demonstrated in Figure. 8. This is verified by looking at a plot of the internuclear distance as a function of time: the gradient of the the distance F-H = H-H = F-H = 0 demonstrating that there is very little oscillation of the atoms and hence very little force acting on the system.
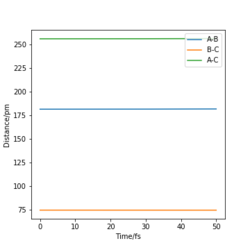
A contour plot showing the Hessian matrix eigenvectors can be used to exemplify this also: one vector shows the path of steepest accent, while the other shows the lowest energy decent towards the products. Since this is a property of the transition state it suggests this is a good estimate for the transition state location.
The Activation Energy
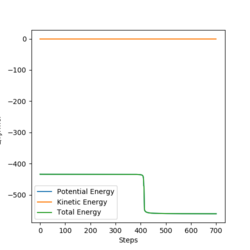
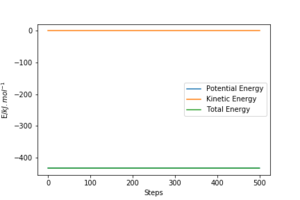
The activation energy for the reaction generating H-H and H-F were determined by running a trajectory displaced slight from the transition state, and looking at the "Energy vs Time" plots. In order to calculate the activation energy, the difference between the reactants energy and the transition state energy was determined in each case (as demonstrated in the figures below). This gave the H-H and H-F activation energy as 0.910 KJmol-1 and 126.447 KJmol-1 respectively.
Spot on! Mys18 (talk) 11:12, 26 June 2020 (BST)
Reaction dynamics
For the F + H2, since the attacking atom A (F) is much heavier than atoms B-C (H-H), it approaches atom B while the B-C bond breaks and the repulsion is reduced. This repulsion leads to atom B recoiling, but A-B does not recoil since the bond is still extended and hasn't yet fully formed.[2] This leads to a large vibrational energy in the product in comparison to the reactant molecule H2, as seen in figure 11. This is because the energy released due to the B-C repulsion pushes B closer to atom A and there is a resulting vibration in the product A-B (F-H). This is known as mixed energy release. This increase in kinetic energy in the products compared to the reactants can be measured by calorimetry: the increased vibrational energy of the system causes a temperature change that can be measured experimentally. Since the reaction is exothermic, heat energy will be released and the temperature of the surroundings will increase.
That is true. We can even look into IR and something called Infrared chemiluminescence (consider molecules being excited to excited states and then back to ground state). Mys18 (talk) 11:15, 26 June 2020 (BST)

Calculations starting on the reactants side of F + H2 were run, initiated at the bottom of the well rHH = 74 pm with a momentum pFH = -1.0 g.mol-1.pm.fs-1- exploring a variety values of pHH in the range -6.1 to 6.1 g.mol-1.pm.fs-1. The animations and “Momenta vs Time” plots showed that negative momenta resulted in a system with a lower kinetic energy than the corresponding positive momenta of the same magnitude. When the system initiated with greater vibrational energy, barrier recrossing occurred where there was an imbalance of translational and vibrational energy of the system. When this occurred the animation showed the product H2 molecule had less kinetic energy than in the initial reactant form (ie a loss of vibrational and translational kinetic energy occurred on barrier recrossing). For the reactive pathways, where HF was generated, the opposite occurred. Here, the HF product molecule had greater energy in the form of translational kinetic energy (seen in the animation) and also greater vibrational energy (seen in the contour plot) than in the reactant H2 molecule.
When the momentum pFH was increased slightly to pFH = -1.6 g.mol-1.pm.fs-1 yet the overall energy of the system was considerably reduced by decreasing pHH to pHH = 0.2 g.mol-1.pm.fs-1 the trajectory was still reactive (and no barrier recrossing occurred). During the reaction it is clear that potential energy was converted into kinetic energy since the products move away and oscillate faster.
The Reverse Reaction: H + HF
After attempting to find the reverse reaction trajectory by testing various initial conditions (low vibration motion of the H-F bond and high values of pHH), it was unsuccessful in generating a reactive reverse pathway. Likewise, use of the inversion of momentum procedure did not yield a reactive pathway: in no case did the reactants pass the activation barrier necessary to form the products. However, according to Polanyi's rules and the principle of microscopic reversibility (ie the rates of the forwards and reverse reactions are equal), for an exothermic reaction the energy provided for the reaction to occur is mostly in the form of translational energy.[2] Translational energy in the reactants is there most effective way to cross the activation barrier and therefore increases the rate of an exothermic process. Likewise for an endothermic reaction state, the converse is true, where the transition state is "product-like" or late, the energy provided to overcome the saddle point is mostly in the form of vibrational energy. Since this reverse reaction is endothermic, it is expected that vibrational energy in the reactants will be more efficient for overcoming the saddle point- this was evident when trying to obtain a reactive pathway.
Good, it would have been nice to see the trajectories you tested. Additionally, you can include 'late/early' energy barriers to make your answers fuller. But good understanding of Polanyi's rules shown! Mys18 (talk) 11:18, 26 June 2020 (BST)

