MRD:01508310
3/5 - Some very very good aspects to this report, unfortunately you let yourself down with some fairly hard-to-ignore gaps in several basic areas.
H-H-H system
Dynamics from the transition state region
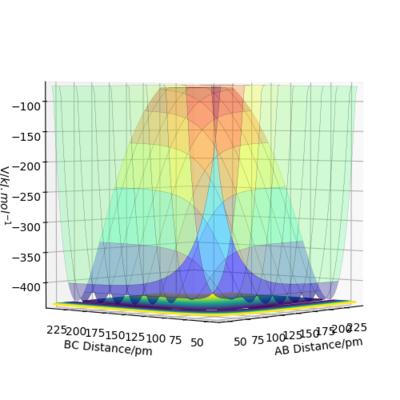
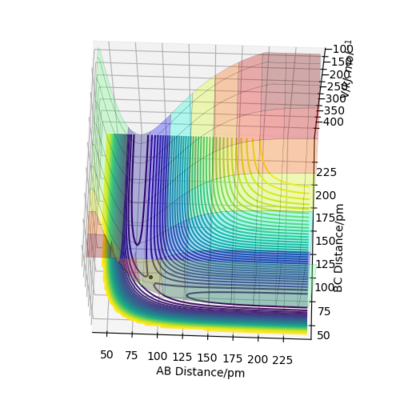
The transition state is the point on the potential energy surface that has ∂V(ri)/∂ri=0, where ri is the distance between two atoms.The transition state is a local maximum and its second derivative ∂2V(ri)/∂ri2 is < 0, whereas a local minimum will have a positive second derivative instead.
NO! The TS is not a local maximum. Look again at your TS and carefully consider the curvature in ALL directions.
Trajectories from r1=r2: locating the transition state
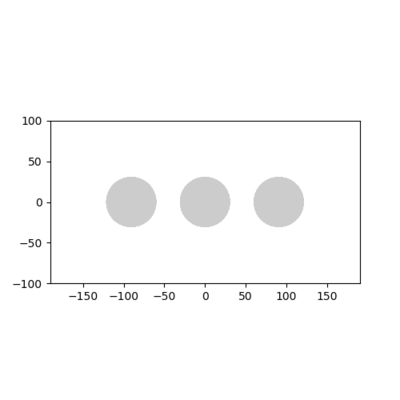
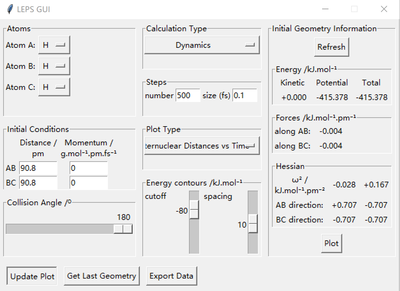
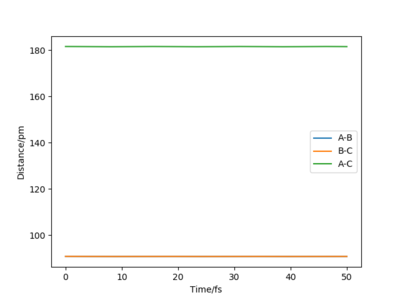
At the transition state, r1=r2=90.8 pm by estimation as this transition state is symmetric. At this separation, the forces acting along AB and BC are both -0.004 kJ.mol-1.pm-1, which is close to zero and the eigenvalues for the Hessian matrix are -0.028 and +0.167 kJ.mol-1.pm-2, indicating the presence of transition state. The Internuclear Distance vs Time plot suggests the distance between HA, HB and HC is equal, about 90 pm and the distance is constant over time suggests the atoms are static at the transition state.
Good TS estimate.
Calculating the reaction path
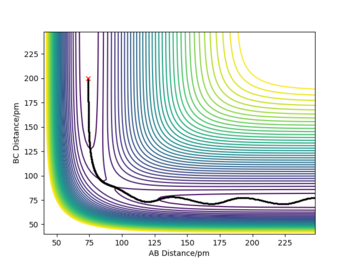
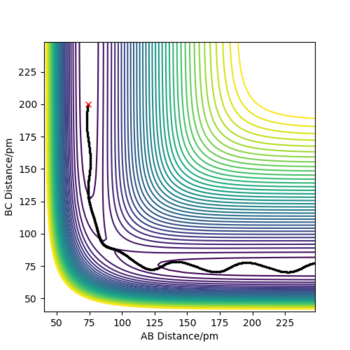
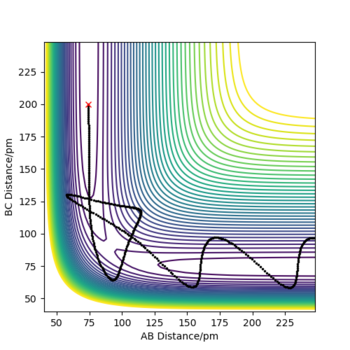
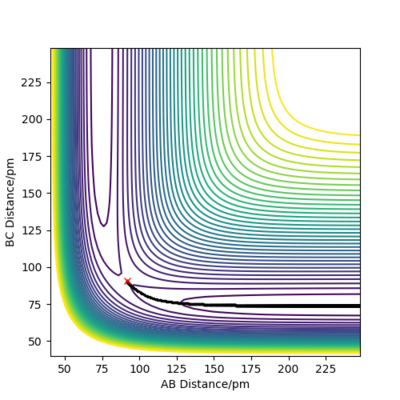
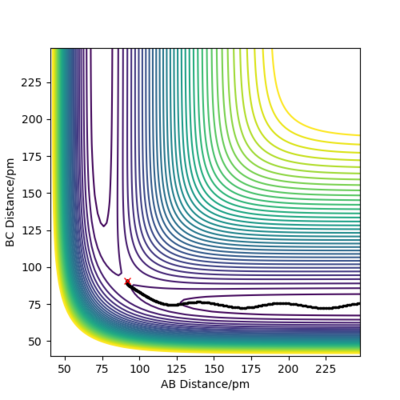
When rA-B is set to rts+1 (91.8 pm) and rB-C equals rts (90.8 pm),the transition state rolls towards HB and HC, HA remains as an atom. MEP and Dynamic reaction paths are different as MEP set the momenta to zero in every step of the reaction path, products are therefore static and hence the reaction path is relatively straight. The dynamic reaction path is more realistic. It takes the momenta of gaseous molecules into account,i.e. The reactants and the products have vibrational energies, that is illustrated by the wavy line along the reaction path.
Good!
MEP and Dynamics calculations comparisons
r1=91.8 pm, r2=90.8 pm, momenta set to 0 g.mol-1.pm.fs-1
HB and HC form a H2 molecule whereas HA moves away from the molecule. The distance between B and C decreased to 74 pm, which is the hydrogen molecule bond length [1].In MEP calculation, the momenta are set to zero at each time step.


Using Dynamics calculation, the outcome of the reaction is the same. The transition state rolls towards HB and HC and a hydrogen molecule is formed. One noticeable difference is that the hydrogen molecule now has some vibational energy as indicated by the wavy line along B-C in the Internuclear Distance vs Time plot.As for the Momenta vs Time plot, the system is linear, therefore the angle theta is zero. HA and HB are moving away from each other at an increasing velocity until the momentum reaches 5 g.mol-1.pm.fs-1.The oscillation along the B-C bond corresponds to the vibration of the bond.
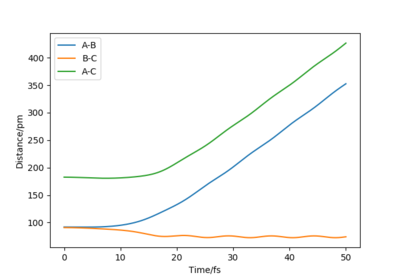

r1=90.8 pm, r2=91.8 pm, momenta set to 0 g.mol-1.pm.fs-1
Once the length of r1 and r2 switches, the shapes of the graphs are identical but instead of HB and HC forming a molecule, HA and HB now form the hydrogen molecule in the products.
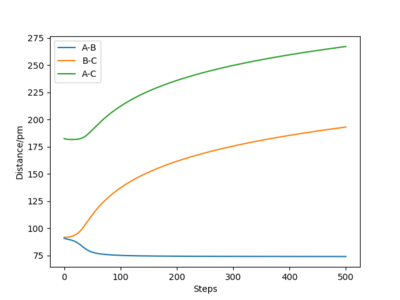
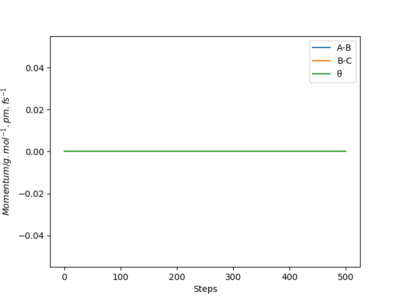
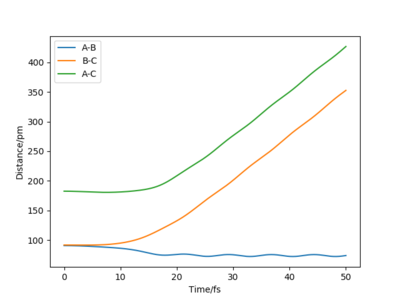
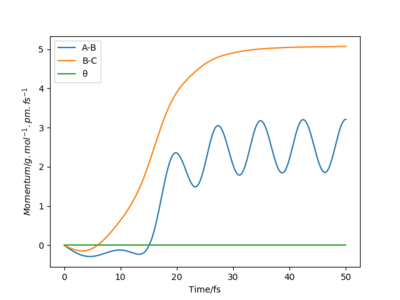
Trajectory starting with the final position and reversed momentum to the reaction path above
This trajectory starts at the end of the reaction path above and finishes at where the above reaction started. it is essentially a reverse of what happened in the reaction above. Good.
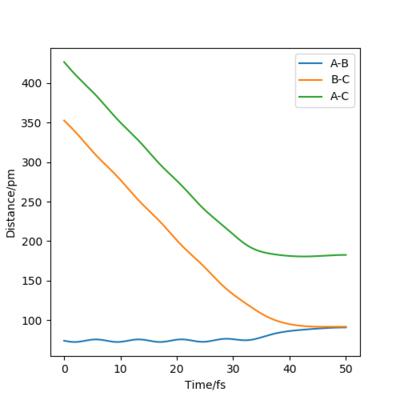
Recative and unreactive trajectories
In order to form products, a system must have sufficient energy to cross the transition state. Only molecules with the correct phase [2] can exit the product channel and form stable products. Recrossing the transition state can lead to either product formation or no reaction. It is possible to cross the transition state multiple times.
Transition State Theory
Transition State Theory is classical, it doesn't take quantum tunnelling into account.Quantum tunnelling is probable for this reaction as it involves the transfer of a hydrogen atom, particularly at lower temperatures [3].At low temperatures, the H atom can tunnel through the potential energy barrier instead of passing over the barrier, hence the activation energy is lowered and the reaction rate increases. However, recrossing the energy barrier is possible as seen with the simulations, this can have a negative effect on the reaction rate. At high temperatures, the system is thermally activated and the behavious is approximately classical[4]. Overall, the situation can be complicated as the theory assumes quasi-equilibrium between reactants and transition state (activated complexes). The activated complex can then either form products or revert back to the reactants with or without quantum tunnelling. The experimental reaction rate might still be greater than that predicted by the theory. It is possible but generally this is not the case.
F-H-H system
PES inspection
F+H2 (F1-H1-H2)
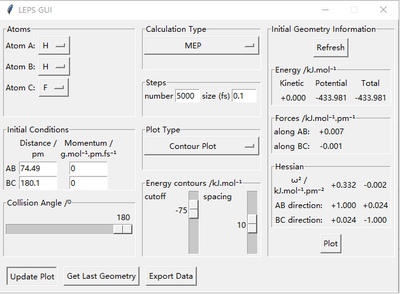
F+H2 is exothermic as the reactants are higher in energy than the products therefore during the reaction, energy is released to the surroundings. H-F bond is stronger than H-H bond as the products are lower in energy and therefore more stable.The transition state is located approximately at rF1-H1=181.10 pm and rH1-H2=74.49 pm. This is verified by the forces (close to zero) and eigenvalues for hessian matrix (they are of opposite signs). The activation energy is estimated by tilting the transition state towards the reactants and is shown to be 424 kJ.mol-1.
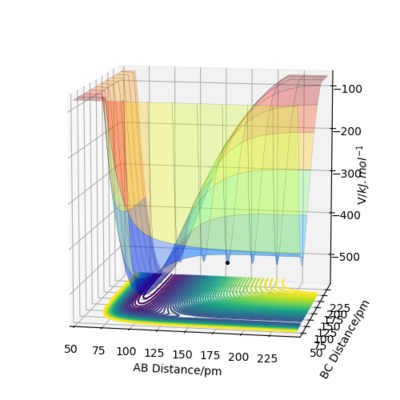


H+HF (H1-H2-F1)
This reaction is endothermis as the reactants are lower in energy than the products therefore energy is taken in from the surroundings to form the products. H-F bond is still stronger than H-H as the reactans are lower in energy and more stable. The transition state is located at approximately rH1-H2=280 pm and rH2-F1=92 pm. It is located with the same reasons stated above.With the same method, the activation energy is estimated to be 434 kJ.mol-1. The two activation energies should be identical as these two reactions are essentially the reverse of one another.
NO!! Look at your PES-- if you go in one direction, you spend most of your time going downhill, the opposite case is seen if you go in the opposite direction. The Ea values are not at all the same. Think about this as well: do you think fluorine will react more easily that H + HF?
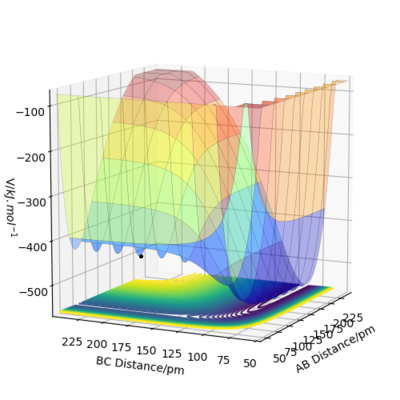


Reaction dynamics
F+H2 system
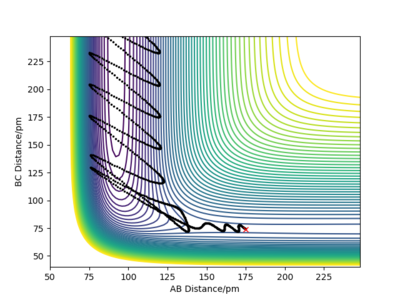
Initially, the reactants have kinetic energy in the form of vibrational and translational energies, and as it crosses the potential energy barrier, the kinetic energy is converted into potential energy. Once the system is exiting the product channel, the potential energy is converted into the vibrational energy of the product.One good experimental technique to prob the electronic structure of the reacting species will be IR spectroscopy.In the anharmonic oscillator model, exciting molecules in the relaxed state promotes excitation from the ground state to the first energy level mainly. This will give rise to a single peak in the IR spectrum. Howver, when exciting a sample of excited molecules, many transitions are possible. For example, from 0-->1, the fundamental or 1-->2, the first hot band. They will show up in the spectrum as 2 peaks, with the hot band being at a lower wavenumber as the energy gap decreases up the potential well. The intensity of the hot band decreases over time as the electrons can fall back to lower energy levels and energy is emitted as radiation. As this system is linear, rotational is not important electronic energy is not considered here.Photoelectron spectroscopy is also a viable method. [5] Interesting choice!
Varying the momentum of HH in the F+H2 system.
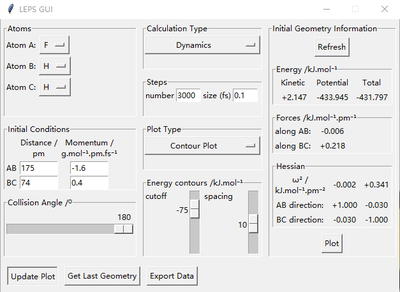
Conditions:rFH=182 pm, rHH=74 pm, PFH=-1.0g.mol-1.pm.fs-1
| PHH/g.mol-1.pm.fs-1 | Contour Plot |
| 0 | 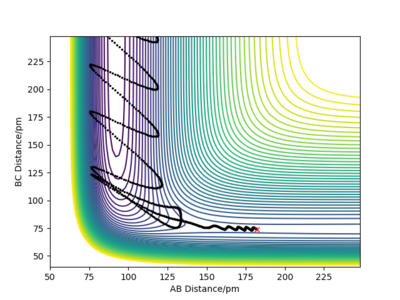 |
| 2 |  |
| 4 | 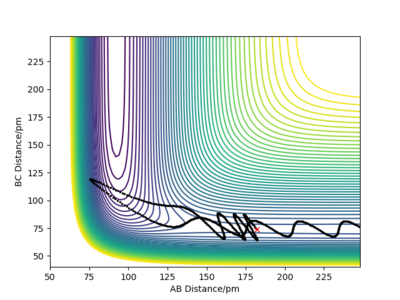 |
| 6.1 |  |
| -2 |  |
| -4 | 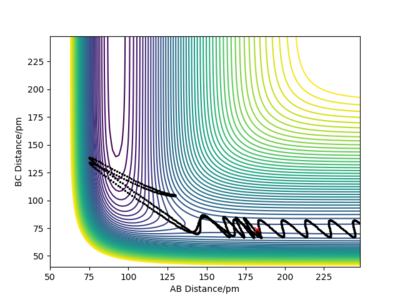 |
| -6.1 | 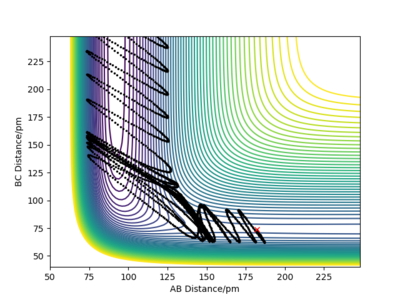 |
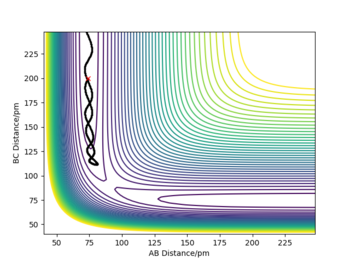
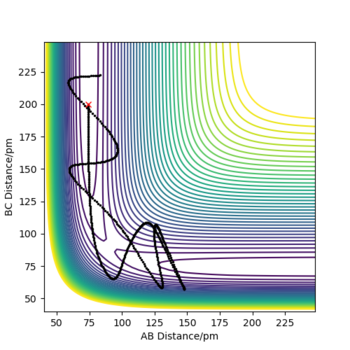
Although the amount of energy that is put into H-H vibration is much more than the activation energy of the reaction, the reaction does not always occur. The large amount of energy is demonstrated by the high frequency of those wavy lines. Recrossing the transition states multiple times can lead to no reaction or product formation depending on how the tragectory collides with the potential well.
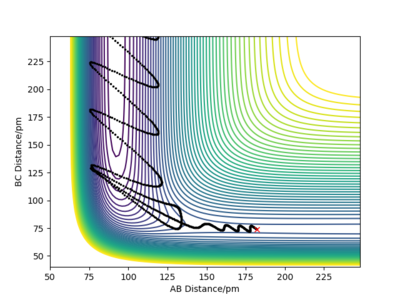
The system now has much less vibrational energy into the reactants than before. The reaction is still successful and the trajectory recrosses the transition states fewer times than before.This can be explained by the increased momentum of FH so that F can approach the closest H with more vibrational energy.
H+HF system
| Graph Number | p1(HH)/g.mol-1.pm.fs-1 | p2(HF)/g.mol-1.pm.fs-1 | Etot/kJmol-1 | Recative? | Illustration of the trajectory |
|---|---|---|---|---|---|
| 1 | -2 | -10 | -397 | No | 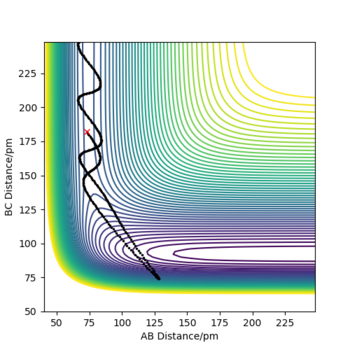
|
| 2 | 0 | -8 | -400 | No | 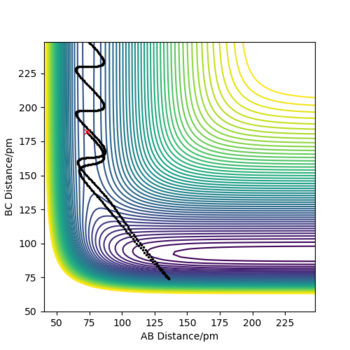
|
| 3 | 5 | -6 | -360 | No | 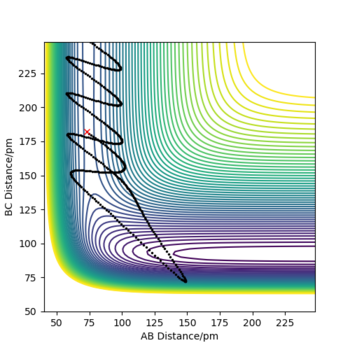
|
| 4 | 5 | -3 | -389 | Yes | 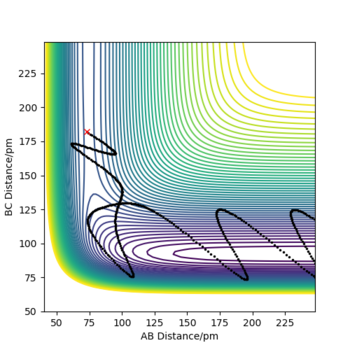
|
By referening to Polanyl's empirical rules, an exothermic reaction has an early barrier, which happens in the reactant channel. It tends to favour vibrational excitation of the products. On the other hand, an endothermic reaction has a late barrier, which occurs in the product channel. It tends to favour low product vibrational excitation. The location of the energy barrier is also crucial for a successful reaction. Translational energy of the reactants is the most effective at passing the early barrier whereas vibrational energy of the reactants is the most effective at surmounting the late barrier. This is undrstandable because in an endothermic reaction, if the reactants have mainly translational energy, it is more likely that the reactants will hit the potential well wall and results in no reaction.This reaction is endothermic, and hence it has a late barrier. In all the graphs, the reactants all have vibrational energy as indicated by the wavy line in the reactant channel.[2]
An excellent systematic study, well done!
References
- ↑ R. DeKock and H. Gray, Chemical structure and bonding, Univeristy Science Books, 1989.
- ↑ 2.0 2.1 S. Jeffrey I., Experimental Chemical Dynamics, Prentice-Hall, Upper Saddle River, 2nd edn., 1989.
- ↑ L. Keith J., Theories of reaction rates, Harper & Row, New York;London, 3rd edn., 1987.
- ↑ D. Brougham, A. Horsewill and R. Jenkinson, Chemical Physics Letters, 1997, 272, 69-74.
- ↑ S. Bradforth, D. Arnold, D. Neumark and D. Manolopoulos, The Journal of Chemical Physics, 1993, 99, 6345-6359.

