MRD:01507626
H+H2 system
The initial conditions of the simulation are shown in the table below.
| Distance/pm | Momentum/g.mol-1.pm.fs-1 | |
|---|---|---|
| AB | 230 | -5.2 |
| BC | 74 | 0 |
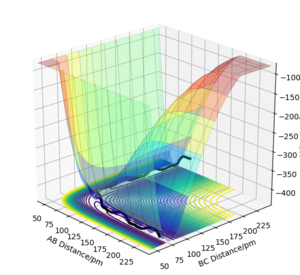
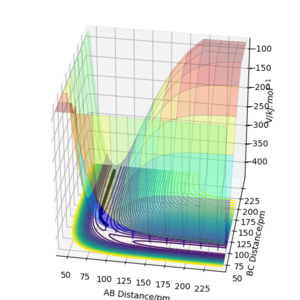
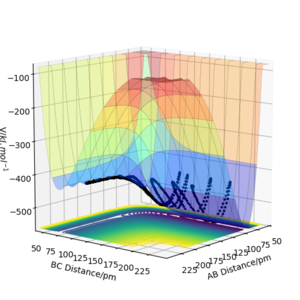
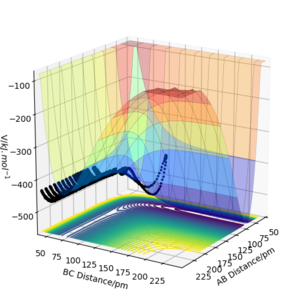
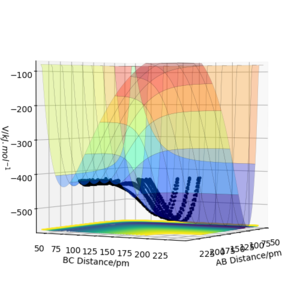
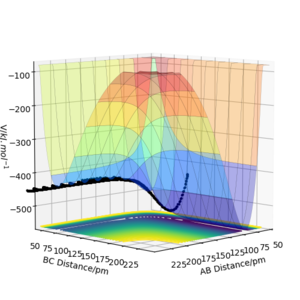
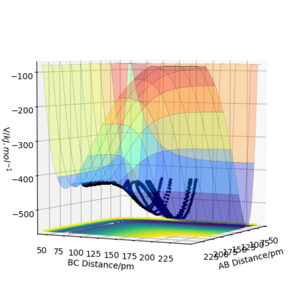
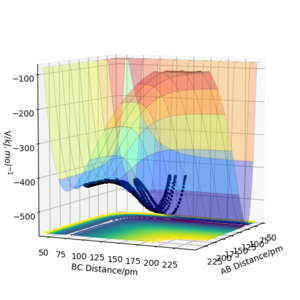
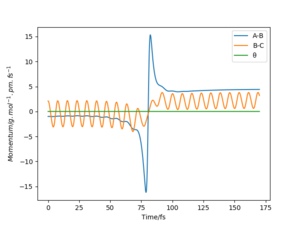
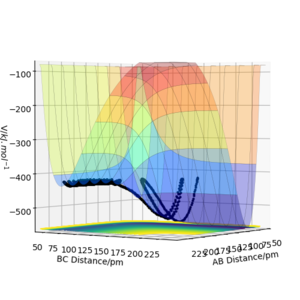
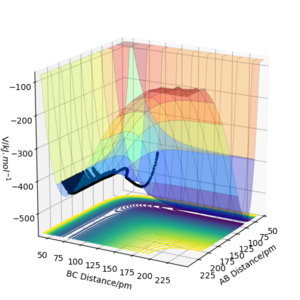
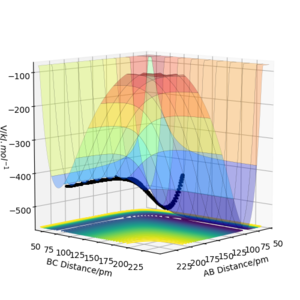
The results of the calculation are shown in Figure 1 in the form of the potential energy surface. The black line at the bottom of the surface shows the trajectory taken. The line is not straight due to the osciallations of the diatomic molecules. The part of the trajectory in which the BC distance stays constant at around 74 pm and AB decreases to about 74 pm, represents the reactants. The corner in the trajectory is the transition state of the reaction. The part where AB stays constant at 74pm while BC increases shows atom C moving away after the reaction while BC remains.
Transition state
The transition state is a saddle point on the potential energy surface (PES). Saddle points, maxima and minima are all stationary points. For a point to be a stationary point of the potential energy surface all partial derivatives have to equal 0 at the point.
The nature of the stationary point can then be determined by expanding the n-dimensional PES using the Taylor series around the point where N is the number of atoms. In most cases the quadratic approximation described below is suitable.

By introducing the Hessian matrix M one can rewrite the expansion.

The Hessian matrix is real and symmetric and therefore has n real eigenvalues λk and n orthogonal eigenvectors ek This is excellent, but it is only true when the eigenvalues are different. João (talk) 12:31, 14 June 2020 (BST)
.

ẟrs is Kronecker delta, showing the orthogonality between the eigenvectors. Since one can construct an n-dimesional vecor out of the n eigenvectors as base vectors. Therefore Δr can be expanded in terms of the eigenvectors.
Substituing the last equation into the taylor expansion, one obtains the following. Another way of looking at this substitution is decomposing the vector Δr into the eigenvectors of M.

One can think of the result as determining the nature of the stationary point along one eigenvector of M, along one dimension in the n dimensional vector speace. A positive eigenvalue represents a minimum in a given dimension while a negative eigenvalue represents a maximum for a given dimension. This leads us to the conclusion that if all eigenvalues are positive for all coefficients ak, the point is a minimum. If all eigenvalues are negative for all coefficients ak the point is a maximum. If some eigenvalues are positive while others negative the point is a saddle point. In the case of a 2 variable function a saddle point is defined as one eigenvalue having a different sign to the other, meaning along one eigenvector of M it is a minimum while a maximum along another orthogonal to the first one. In the case of an n variable function the point can be a maximum along an arbitrary number of eigenvectors, k, where k smaller than n-1, while being a minimum along n-k other orthogonal eigenvectors. However, a transition state only corresponds to those points where one eigenvalue is negative while all others positive. This ensures that it is still a point along the minimum energy path.
It should be noted that this method may fail in case some eigenvalues are 0 while others have the same sign. In this case numerical approximate methods need to be used.
In practice, the full PES is rarely computed due to the large computational cost and algorithms like the Berny algorithm need to be used. It starts off with a well guessed starting geometry, computes the Hessian matrix and takes a step on the PES towards the transition state and lowering the energy gradient, the condition of a stationary point. This method is only feasible when a good starting geometry was provided. This can be obtained by scanning along one direction on the PES, for example the by freezing all bond legths except one.
This is an excellent answer. You should probably have included some references. João (talk) 12:31, 14 June 2020 (BST)
Locating the transition state
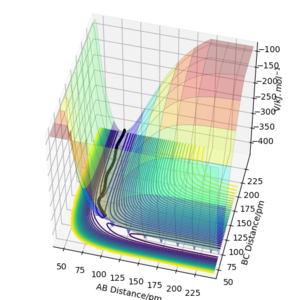
When looking at figure 2 one can see that the PES is symmetric along the plane rAB=rBC. Therefore The transition state must have the same symmetry. One way to search for the transition state is to start with the condition rAB=rBC and vary the distance. At the transition state, the particles should not move as long as no initial momentum is given. In this specific system transition state search is greatly simplified due to the constraint given by symmetry. If the PES was known the method of Lagrange undetermined multipliers could be used to determine an analytic answer. However, as the PES is not fully known the easiest method would be to find the minimum along the constraint. There are several methods to doing this but the simplest is using gradient descent along the constraint. The formula of the steepest descent is the following where k is a pre defined step length. Why use a fixed step length? If you use a step size proportional to the gradient magnitude (don't divide by the norm of the gradient) you would probably avoid the overshoot you see below. João (talk) 12:31, 14 June 2020 (BST)
Using the definition of force as the derivative of the energy this can be rewritten.
You probably don't want the minus here. João (talk) 12:31, 14 June 2020 (BST)
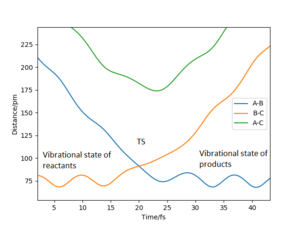
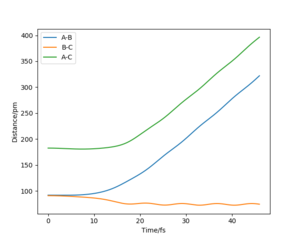
From figure 3 we can see that 90pm is a valid first guess. The step length was chosen as 0.5 pm. Convergence is reached when the sign of force vector changes. Then the step size is reduced to 0.05 pm.
| n | rn | Fn |
|---|---|---|
| 0 | 90 | |
| 1 | 90.3536 | |
| 2 | 90.7072 | |
| 3 | 91.0608 |
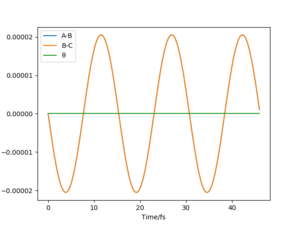
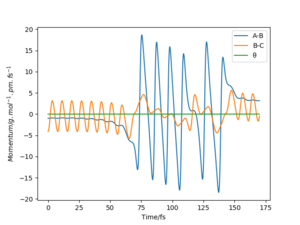
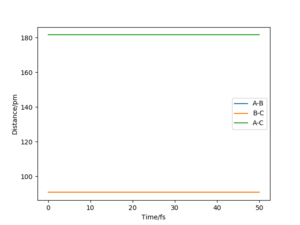
The transition state lies between 90.7072 pm and 91.0608 pm. The starting point is chosen by linearly interpolating the distance as 90.7743. The forces at this point are computed as 0 in both directions. Therefore the transition state has been reached at 90.7743. By interpolating the steps before and after the sign change, the converges much faster. For higher dimensional optimisation problems gradient descent is not very efficient close to the stationary point but efficient at optimisation far from the stationary point. Methods like Newton-Raphson or the previously discussed Berny-Algorithm that follows eigenvectors are much more efficient in those cases. The separation of 90.7743 pm can be confirmed as a transition state with the help of figure 4. No oscillations in the atom separations show that the atoms are still at their positions.
All of this is fine, but note that if you were doing a MEP or a trajectory starting with zero momenta and starting from a geometry with AB distane equal to BC distance, you would effectively be converging to the transition state in a more efficient way than a fixed step search. Once more you should probably be adding references to your answer. João (talk) 12:31, 14 June 2020 (BST)
Comparison of minimum energy trajectory (mep) with Dynamic trajectory
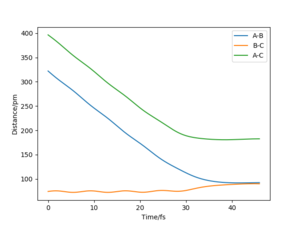
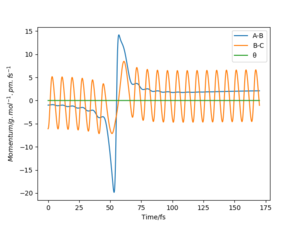
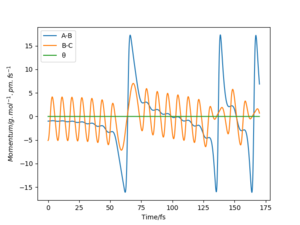
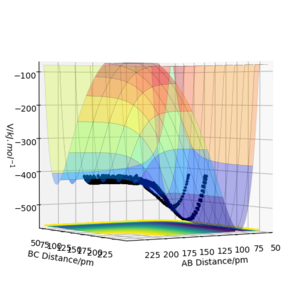
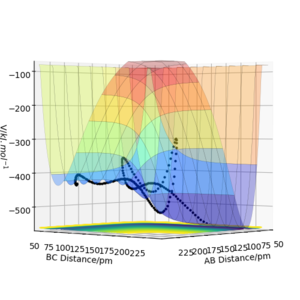
The mep corresponds to the reaction path with infinitely slow motion. The momentum of the atoms is set to 0 at every time step so that the trajectory follows the floor of the potential energy surface as shown in figure 5. When changing the type of the calculation back to dynamic as shown in figure 6, one can clearly see the vibrational energy of the products. In both cases the initial conditions were set as rAB=90.7 pm and rBC=90.7743 pm. Good. Pu12 (talk) 22:05, 11 June 2020 (BST)
Trajectories near the transition state
One can see that at the transition state there is no displacement, the atoms are still at their positions. A slight displacement of 1 pm from the transition state causes the distance rBC to decrease and oscillate while atom A steadily moves away from the molecule shown by the increasing distance rAB. When using the final state of the system for the initial state of another simulation with the signs of the momenta reversed, One can see that it follows along the same trajectory as before in reverse order. The reason why the transition state is not perfectly reached may be due to the uncertainty with which the final positions and momenta were determined.
Reactive and unreactive trajectories
In the following table a number of trajectories are analysed. In all cases the original starting distances were set to rAB=200 pm and rBC=74 pm.
| pBC/ g.mol-1.pm.fs-1 | pAB/ g.mol-1.pm.fs-1 | Etot | Reactive? | Description of the dynamics | Illustration of the trajectory |
|---|---|---|---|---|---|
| -2.56 | -5.1 | -414.280 | Yes | The F atom approaches the H2 molecule. The HF molecule is formed while the other H atom moves away.What about changes in vibrations? Pu12 (talk) 22:05, 11 June 2020 (BST) | 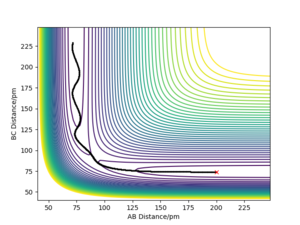
|
| -3.1 | -4.1 | -420.077 | No | The F atom approaches with insufficient energy to break the H-H bond. The F atom leaves again. | 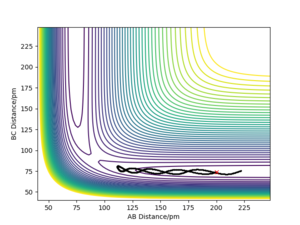
|
| -3.1 | -5.1 | -413.977 | Yes | The F atom approaches the H2 molecule. The HF molecule is formed while the other H atom moves away. | 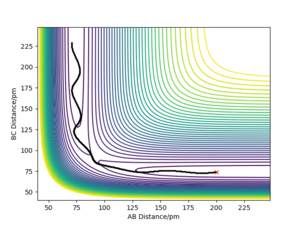
|
| -5.1 | -10.1 | -357.277 | No | The F atom approaches with large kinetic energy, The HF molecule is formed. Large oscillations in the bond cause it to break apart again. The reactants are reformed | 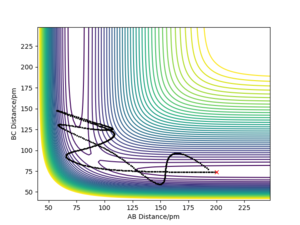
|
| -5.1 | -10.6 | -349.477 | Yes | The F atom approaches with large kinetic energy, The HF molecule is formed large oscillations in the bond cause it to break apart again. The reactants are reformed but large oscillations in the HH bond cause that to break and the HF molecule is formed. | 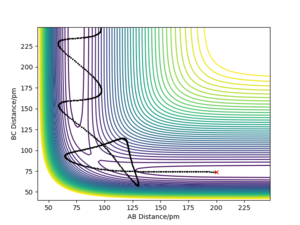
|
What can you condlude from the table? Pu12 (talk) 22:05, 11 June 2020 (BST)
Transition state theory
Transition state theory is based on three Three? Pu12 (talk) 22:05, 11 June 2020 (BST)
key assumptions.
- All systems with kinetic energy in the direction of the reaction coordinate greater than activation energy will be reactive.
- Kinetic energy along the reaction coordinate is populated according to the Boltzmann distribution.
When looking at the fourth trajectory in the previous section one can clearlz see that the system has crossed the transition state, entered the prodcut channel, crossed the transition state again and returned to the reactant channel. It is therefore an unreactive trajectory. However, according to Transition state theory it would be counted as a reactive one. Transition state theory therefore overestimates the rate of reaction. Transition state theory also doesn't take into account quantum tunneling since it is a classical theory. Quantum tunneling is an effect that increases the rate of reaction compared to transition state theory because a system can react by never reaching the transition state and tunneling through the activation barrier. For most systems this effect is however negligible since quantum is only substantially observed for very light particles. For some reactions this effect can be considerable but in most cases it will be negligible. Therefore, generally speaking transition state theory overestimates the rate of reaction.
F+H2 system
Inspection of the PES
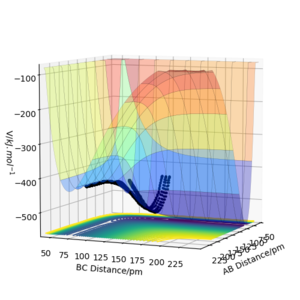
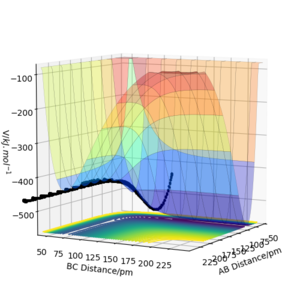
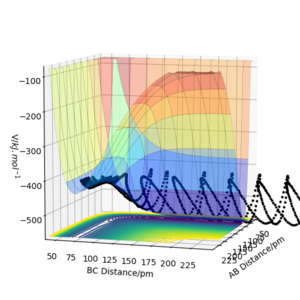
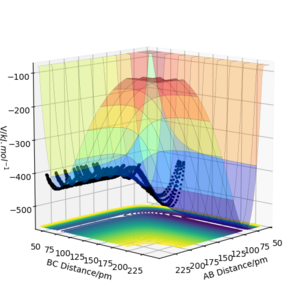
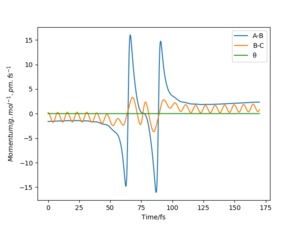
The following two figures show the trajectories of the F+H2 and the HF+F reaction respectively.
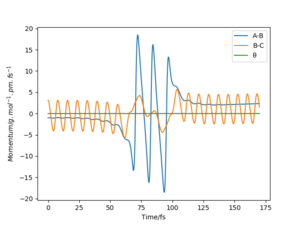
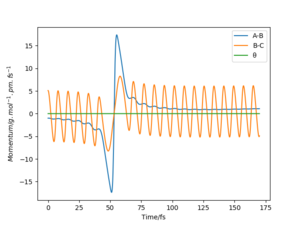
One can clearly see that for the F+H2 reaction the reactant channel is much higher than the product channel with an early transition state. One can clearly see the large vibrational excitation in the product channel. In the HF+H reaction the reactant channel is much lower than the product channel. The H atom has to collide with the molecule with a large momentum to provide the system with enough energy to overcome the transition state. The vibrations of the resulting H2 molecule are much smaller as seen in the Figure on the right.
Locating of the transition state
Hammond's postulate states that the transition state resembles the reactants or products of a reaction depending on whichever one it is closest to in energy. When selecting the exothermic F+H2 reaction from Hammond's postulate one can deduce that the transition state should resemble the reactants. When looking at the contours of the potential energy surface one can see that this is in fact the case. lower energy state of the HF+H state compared to the F+H2 state indicates that the HF bond is much stronger than the H2 bond.Good. Pu12 (talk) 22:05, 11 June 2020 (BST)
When it comes to finding the transition state precisely, various methods exist. Previously, the gradient descent method could be used due to the high symmetry of the system. In this case a two dimensional search method needs to be used. When faced with such a problem for a larger system, the initial guess for the transition state is obtained by the use of synchronous transit methods that estimate the position of the transition state either linearly or quadratically along a straight line or curve between reactants and products. Further search is then carried out using other methods like adapted Newton-Raphson or eigenvector following. In the following the latter algorithm will be employed to find the transition state. The basic principle of the algorithm comes from an intuition about the eigenvectors of the Hessian matrix introduced earlier. The eigenvectors point into a direction in which the curvature is independent of any other directions. The sign of the eigenvalue corresponds to the sign of the curvature in the direction of the eigenvector. From the definition of a transition state given earlier one could find a transition state by minimizing one eigenvalue while maximizing all others.
The first step of the RFO algorithm is to determine the shift parameter λ. In the simple gradient descent parameter that was previously used to obtain the transition state position this parameter was simply set to a sensible value. After rewriting the information included in the quadratic Taylor approximation in the form of a rational function with the help of a scaling matrix S. S is taken as the identity in the following since the scaling can be absorbed into the coordinates.
where λ=2Δr
One can represent this equation as two separate equations.
where g is the gradient of the PES at ri
The equation can be rewritten in component form.
where m_k are the eigenvalues of M and the diagonal elements of the diagonalised Hessian M along the eigenvectors
We can substitute this equation back into the separated RFO equation and obtain an expression for the change in V.
Therefore a step along or against the gradient in the direction of a specific eigenvector is determined by the sign of λ - mk. One possible way of using this algorithm is to determine the lowest eigenvalue of the original RFO matrix, compute the gradient and use the formula for Δri. Another method would be to use the second lowest eigenvalue of M as λ. Therefore the algorithm takes steps upwards in the direction of one eigenvector while simultaneously taking steps downwards in the direction of all other eigenvectors. In this form eigenvector following can be used to find a first order saddle point.
As initial initial guess for the search of the transition state on the F-H-H PES rFH=180 and rHH=75. In the first part a minimisation is done to ensure a first order transition state. In the second part the transition state is reached by climbing up the valley.
| Step | FFH,FHH | m1,m2 | eigenvectors |
|---|---|---|---|
| 0 | -0.006, -0.159 | -0.002,0.322 | (1,-0.025),(-0.025,-1) |
Walkthrough of the algorithm:
Step 1: Compute and diagonalise the Hessian
Step 2: Construct RFO matrix at initial position rFH=180 rHH=75 and compute eigenvalues λ.
λ1=-0.064 λ2=-0.002 λ3=0.396
Step 3: Select λ and take steps along the eigenvectors.
λ=-0.002
| Step | FFH,FHH | m1,m2 | eigenvectors |
|---|---|---|---|
| 1 | -0.002, -0.003 | -0.002,0.331 | (1,-0.024),(-0.024,-1) |
Step 1: Compute and diagonalise the Hessian
Step 2:
λ1=-0.003 λ2=0.001 λ3=0.331
Step 3:
λ=0.001
| Step | FFH,FHH | m1,m2 | eigenvectors |
|---|---|---|---|
| 2 | -0.001, 0.000 | -0.002,0.332 | (1,-0.024),(-0.024,-1) |
Step 1: Compute and diagonalise the Hessian
Step 2:
λ1=-0.002 λ2=0.000 λ3=0.331
Step 3:
λ=0.000
When computing the forces at this point they are equal to 0 in all directions. Therefore a stationary point is reached. When computing the Hessian we find it has a negative eigenvalue of -0.002 and a positive one at 0.332. Therefore the stationary point can be confirmed to be a first order saddle point, the transition state.
In this case, using MEP and a bit of trial and error would have saved you some work. But it is great that your learned about the implementation of these algorithms (which you should have referenced). João (talk) 12:31, 14 June 2020 (BST)
Determination of the activation energy
F+H2
F+HF
Reaction dynamics
F+H2 reaction
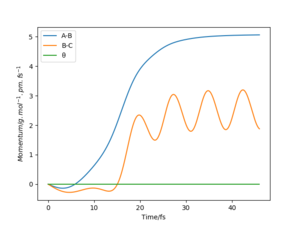
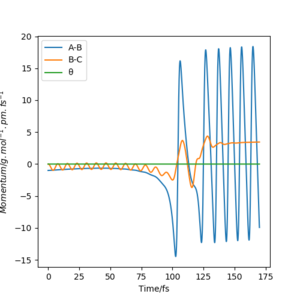
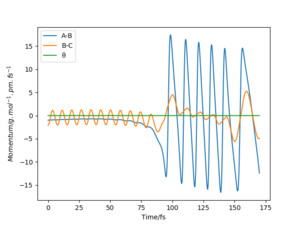
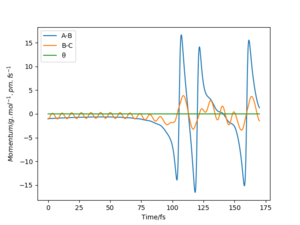
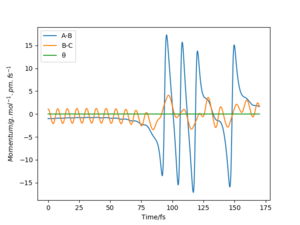
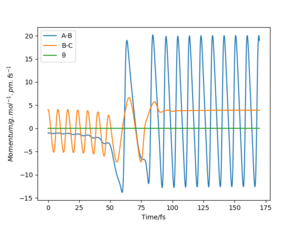
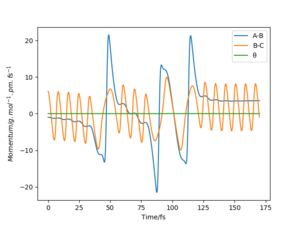
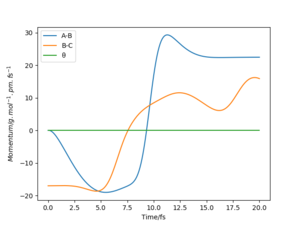
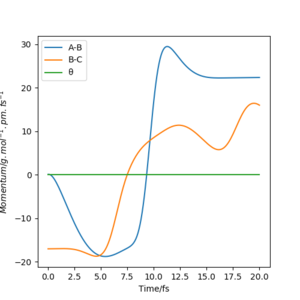
When looking at the momenta vs time graphs one can see how in each case the energy is conserved. If a reactant approaches the other with large translational energy some of it results in vibrations of either the formed product or the reformed reactant. The other part is transferred into translational energy of the other reactant or the same reactant but in the opposite direction.
Since the reaction is exothermic only a small amount of translational energy can lead to a large amount of vibrational energy in the product. This can be seen in the reactive trajectories above. Translational energy is related to internal energy and therefore temperature. Accurate changes in temperature can be measured using bomb calorimetry . Vibrational energy is radiated by photons in the IR spectrum. These photons can be detected using IR spectroscopy. The vibrational energy levels in a molecule are quantised. After a collision the HF molecule often enters an vibrationally excited state. Photons have an energy corresponding to the energy gap between the vibrational mode of the excited state and the ground state. The excited state does not necessarily need to be the first excited state. If it is a higher excited state, an overtone is seen.
Overall one can conclude that a mechanism resulting in large translational energy would result in a large change of temperature and close to no overtones observed. A mechanism with small translational energy released and large vibrational energy released would result in large overtones and only a slight change in temperature.
HF+H reaction
Conclusion
When looking at the reactive trajectories for both systems one can see that for the exothermic case the reactants mainly have translational energy while the products have vibrational energy. According to Polanyi's rules the reaction is more likely to go to completion when more translational energy is invested initially since it is more effective effective to pass the energy barrier close to the reactants.
For the endothermic case the reactants mainly have vibrational energy while the products have kinetic energy. The reaction is more likely to go to completion when more vibrational energy is invested initially since it is more effective effective to pass the energy barrier close to the reactants. Good, but would be helpful to reference Polanyi's rules and quote specific figures in the report. Pu12 (talk) 22:05, 11 June 2020 (BST)
References
1. https://pubs.acs.org/doi/pdf/10.1021/j100247a015, Date accessed: 15th May 2020 Here you are referencing an article, and your should reference it as such instead of as a website. João (talk) 12:31, 14 June 2020 (BST)
2. Atkins, P. W. Atkins' Physical Chemistry (2018), p806

