MRD:01503252
Exercise 1: H + H2 System
Running and visualising a trajectory
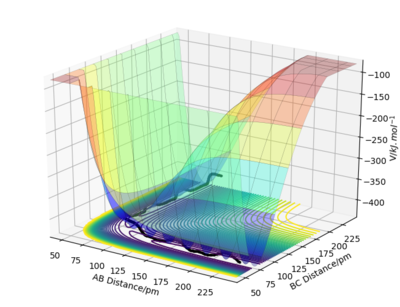
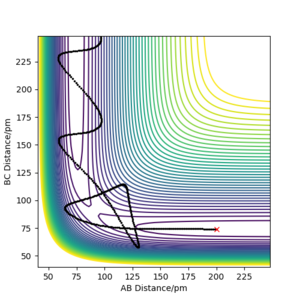
Figure 1 shows the potential energy surface for a linear triatomic system A-B-C, where A,B and C = Hydrogen, H. A potential energy surface describes the energy of a system, in terms of the positions of the atoms and the energy [1]
The initial parameters used in these scenario was:
| Distance / pm | Momentum / g.mol-1.pm.fs-1 | |
|---|---|---|
| AB | 230 | -5.20 |
| BC | 74 | 0 |
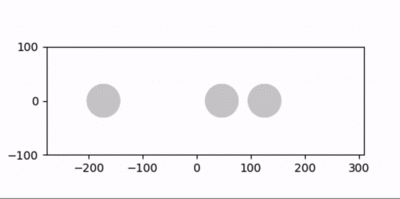
In these conditions, the AB bond breaks which allows B to collide with C allowing for the reaction to take forward, this form of trajectory is called a reactive trajectory .

The black oscillating line in figure 3 represents the overall reaction pathway, a lot of oscillating suggests translational energy is being converted into kinetic energy. In this figure, the maximum potential energy is -434.47 V/kJ.mol-1.
Determination of the Transition State
The transition state is defined as the the maximum on the minimum energy path linking reactants and the products [2]. At this point on a potential energy surface plot, ∂V(ri)/∂ri = 0 which means that the gradient of the potential equals zero [2]. In addition, a transition state is mathematically defined as a first order saddle point on a potential energy surface [3] where, ∂2f/∂x2 × ∂2f/∂y2 - [∂2f/∂x ∂y]2 < 0 [12] .reference 2 doesn't contain this equation. Pu12 (talk) 17:43, 26 June 2020 (BST)
In this case with the A-B-C linear triatomic system, the transition state is the peak of a reaction and is when the bond distances AB and BC equal each to other.
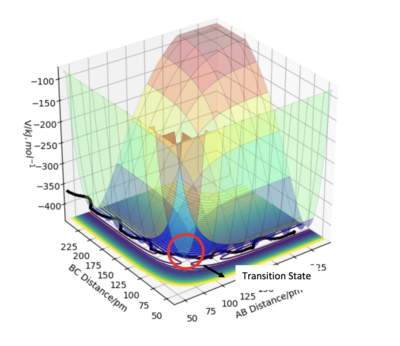
The transition state is the point of a potential energy surface where there is no vibrational energy, this means that the forces along AB and BC equal zero, so there is zero momentum. In a potential energy surface, the transition state lies on the symmetrical axis as observed from Figure 4. Note the transition state is a position on the PES, and thus depends only on how the potential energy changes with position. Vibrational energy is kinetic energy, so the transition state position is independent of the vibrational energy. The system can be at the transition state crossing it with a high kinetic energy, or crossing it slowly almost standing still. João (talk) 18:20, 4 July 2020 (BST)
The transition state was located by testing various initial conditions and making r1 = r2 , and p1 = p2 = 0.0 g.mol-1.pm.fs-1. This trial and error process gave a rough estimate on the position of the transition state, rts .
| Distance / pm | Momentum / g.mol-1.pm.fs-1 | |
|---|---|---|
| AB | 90.81 | 0 |
| BC | 90.81 | 0 |
The rough value of rts is 90.81 pm. This estimation can be further backed up with data from the internuclear distances vs time graph.

Calculating the determinant for figure 5 gives the value −0.999698 which is less than zero therefore, the transition state position calculated is a first order saddle point. The number being reported in the program GUI are the eigenvalues of the Hessian and not the Hessian itself. João (talk) 18:20, 4 July 2020 (BST)

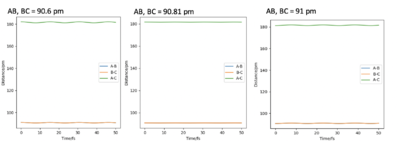
Figure 5 shows that as time increases, the distance remains stationary and does not change. This graph can only be seen with the initial conditions from table 2. Small deviations from these conditions leads to figure 6. Figure 6 shows that small changes in rts causes the graph to go from stationary to a repeating curve. This further suggests that 90.81 pm is a suitable estimate for rts.
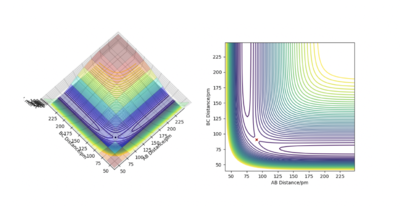
Figure 7 shows the location of the transition state from both a surface and contour plot. This plot shows that the transition state is located where both AB and BC equate to each other.
Good. Pu12 (talk) 17:43, 26 June 2020 (BST)
Trajectories from r1 = rts+δ, r2 = rts
In this situation, the initial conditions where changed from the values in table 2 to change the system such that it was slightly displaced from the transition state. In addition, the calculation type was changed from dynamics to MEP.
| Distance / pm | Momentum / g.mol-1.pm.fs-1 | |
|---|---|---|
| AB | 90.81 | 0 |
| BC | 91.81 | 0 |
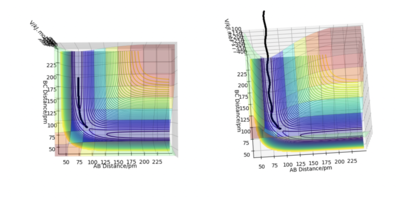
Comparing the MEP and dynamic trajectory the main difference is that the reaction path (minimum energy path) for MEP is a straight line whereas the dynamic reaction pathway is a wavy line. Since the trajectory for the dynamic reaction pathway is wavy it means that the diatomic molecule is vibrating whereas with the MEP reaction pathway, there is no vibration. In both pathways, the trajectory stops halfway around the position of the transition state. In addition, the dynamic trajectory is significant longer than the MEP trajectory and goes out of the axis. The reason for this is because for the dynamics calculation, the momentum is being taken into account whereas with the MEP calculation, the momentum is always zero.
The MEP calculation is not an observation seen, in reality all particles have momenta therefore the MEP calculation is only useful to observe the reaction in a simpler format. On the other hand, with the dynamics calculation, it behaves classically.
Reactive and unreactive trajectories
Initial positions AB = 200 pm and BC = 74 pm was used to run different trajectories with varying momenta values seen below:
To conclude, there is no overall trend in the trajectories, i.e. making the momenta values more positive or negative does not make the trajectory more reactive and vice versa. This can be seen from the table 4, as when p1 = -5.1 and p1= -10.1 is unreactive and p1 = -5.1 and p2= -10.6 is reactive therefore, small changes in momenta have a significant impact on the reaction trajectory. Good. Pu12 (talk) 17:43, 26 June 2020 (BST)
You analysed your results in terms of the magnitude of the momentum. This is ok, but probably easier to think about the total energy. João (talk) 18:20, 4 July 2020 (BST)
Transition State Theory
In transition state theory, the activated complexes are assumed to be in a quasi-equilibrium with reactants [4], this theory allows for a simple way of calculating the rate of a chemical reaction. However, this theory takes into account many assumptions for simplicity which need to be taken into account. The main assumptions and feature of transition state theory are:
- Transition state theory is a completely classical model and does not take into account quantum tunneling which would increase the rate if taken into account. However, in the model used for this reaction, there is no quantum tunneling assumed. As transition state theory is completely classical, the particle takes the path that requires the minimum energy to go from reactants to products whereas if quantum tunneling was assumed, the quantum particle would go through the path which reduces the action angle by the greatest amount [6].
- The theory is based on statistical mechanics [5]
- It assumes that once the transition state is reached at any trajectory, the reaction will go forward and products will form rather than going backwards [6] , which is not necessarily true
- The rate kts is calculated by focusing on the activated complexes which lie on the saddle point of the potential energy surface therefore at the transition state [5]
- Transition state theory assumes that the Born-Oppenheimer approximation is fulfilled [6]
- The system is in thermal equilibrium in the reactant state [6]
- The motion of the systems at the saddle point can be treated as free translation motion and expressed using kinetic theory [5]
- The activated complexes are in a state of quasi equilibrium with the reactants. This means that the concentration of complexed moving from reactants to products will not change
The transition state theory rate values are an overestimation in comparison to the values calculated using this model. This is because the system used in this model does not assume that once a complex reaches the transition state, a product will form. This is because not every collision will lead to the transition state as collisions need to be in the right orientation to lead to a reaction. With the quasi equilibrium, collisions can happen but it doesn't necessarily mean a transition state will form as the reaction can go backwards to reform the reactants. In addition, both models do not take quantum tunnelling into account which would increase the rate of reaction, this is because both models are classical and quantum tunnelling only occurs in chemical reactions done at a very low temperatures [10]. This is because at a low temperature the rate constant is smaller therefore tunnelling will have a greater contribution.
Exercise 2: F - H - H System
PES Inspection
For the reaction F + H2 (Reaction 1) and the reaction H + HF (Reaction 2) , there are two different potential energy surfaces formed. For reaction 1, the initial conditions used were:
| Distance / pm | Momentum / g.mol-1.pm.fs-1 | |
|---|---|---|
| AB | 600 | 0 |
| BC | 74.5 [8] | 0 |
For reaction 1, the AB bond length is significantly longer than the BC. This was done to see the potential energy surface of just the reactant H2 before any collisions have occurred, this leads to a potential energy surface where the axis with AB can be ignored due to its length. As the AB distance is very long it means that the F atom is not interacting in the system and can be ignored so only BC vs Potential Energy can be observed.

From figure 10, it can be observed that reaction 1 is an exothermic reaction. Furthermore, the product formed in reaction 1 is HF and H. Hydrogen Fluoride has a very high bond enthalpy (565 kJ.mol-1 [5] which is why the reaction is exothermic.
Comparing this to reaction 2, with the different initial conditions, the reaction coordinate changes.
| Distance / pm | Momentum / g.mol-1.pm.fs-1 | |
|---|---|---|
| AB | 74.5 [8] | 0 |
| BC | 600 | 0 |
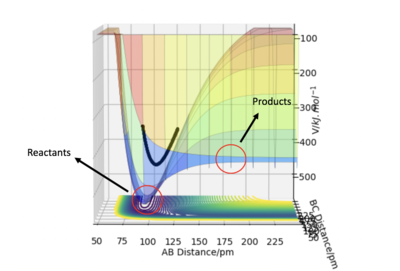
Figure 11 shows that reaction 2 is an endothermic reaction. In this reaction, as the initial BC distance is very long, it can assumed that BC is not involved and there no reactions occuring. This means that graph can be observed from the perspective of AB vs potential energy. In addition for reaction 2, you're a HF bond which has a high bond enthalpy and you're a weaker H2 bond therefore the overall reaction is endothermic. Good use of diagrams. Pu12 (talk) 17:43, 26 June 2020 (BST)
Determination of Transition State
| Distance / pm | Momentum / g.mol-1.pm.fs-1 | |
|---|---|---|
| AB | 180 | 0 |
| BC | 74.5 [8] | 0 |
The transition state is located at the values shown on table 7.

The determinant for figure 12 hessian matrix is −1.00058 which is less than zero therefore the transition state positions chosen in table 7 is a first order saddle point which means the value chosen is accurate. As above, what is reported in the program GUI is the eigenvectors of the Hessian, not the Hessian itself, so you cannot calculate its determinant. João (talk) 18:20, 4 July 2020 (BST)

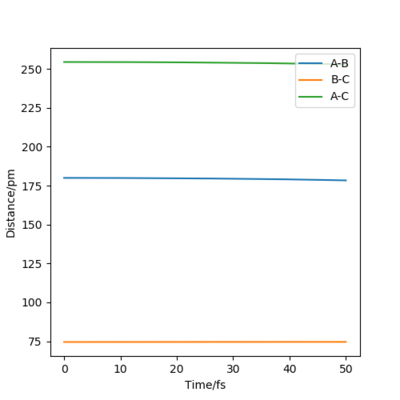
Figure 13 shows the position of the transition state. In addition, figure 14 shows that the initial positions chosen for the transition state are accurate. This is because the internuclear distance vs time graph is a completely straight line with no oscillation. This shows that the initial positions chosen for the transition state are correct as the straight line suggest that at that initial positions, the molecule is not changing length.
Determination of Activation Energy for Reaction 1
Using table 5 allowed to get the potential energy of the reactant state which was -435.057 kJ.mol-1. In addition, the potential energy from the transition state using initial positions from table 7 was -433.981. Subtracting -433.981 by -435.057 gave an activation energy value of + 1.076 kJ.mol-1 for reaction 1.
Determination of Activation Energy for Reaction 2
| Distance / pm | Momentum / g.mol-1.pm.fs-1 | |
|---|---|---|
| AB | 92 [8] | 0 |
| BC | 600 | 0 |
Using table 8 allowed for the calculation of the potential energy in the reactant phase which was -560.700 kJ.mol-1. Furthermore, the potential energy from the transition state using initial positions from table 7 was -433.981. Subtracting -433.981 by -560.700 gave an activation energy value of + 126.719 kJ.mol-1 for reaction 2. Correct. Pu12 (talk) 17:43, 26 June 2020 (BST)
Reaction Dynamics of F - H - H System
“Momenta vs Time”. In light of the fact that energy is conserved, discuss the mechanism of release of the reaction energy. Explain how this could be confirmed experimentally.
The initial conditions used to creative a reactive trajectory for reaction 1 (F + H2) was:
| Distance / pm | Momentum / g.mol-1.pm.fs-1 | |
|---|---|---|
| AB | 175 | -1.6 |
| BC | 74 | 0.2 |

Using the initial conditions from table 9 leads to a successful collision between the F atom and H atom thus forming HF. The initial conditions are not on the reactants valley, the system is already on the product's side when the trajectory is started.
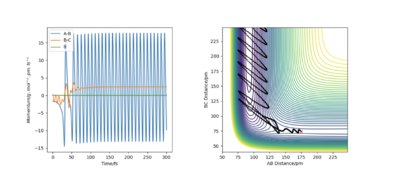
The contour plot from figure 16 shows that the reaction trajectory goes through the transition state therefore is a reactive trajectory. In addition, there is a lot of oscillations in the trajectory which suggests a lot of translational kinetic energy is being converted into vibrational kinetic energy. As the AB distance decreases and the H atom and F atom get closer together, there is a significant increase in vibrational kinetic energy at the point. This can be seen from the amount of oscillation before and after the reaction trajectory moves upwards towards the product channel. The energy in this system is released as kinetic energy.
This can be observed experimentally through infrared spectroscopy. The infrared spectrum after the transition state (collision has occurred) would have many overtones. This is because there is a greater population of molecules in a vibrationally hot level due to more absorption of infrared light. This means there will be more transitions from v = 1 to v = 2 which leads to several overtones. In addition, there would be a single peak due to the transition from v = 0 to v = 2.
Another way this can be observed experimentally is through the measured relaxation (MR) and arrested relaxation (AR) approach [11]. This reference doesn't mention measured relaxation or arrested relaxation. Pu12 (talk) 19:27, 26 June 2020 (BST)
Polanyi's Empirical Rules
Polanyi's empirical rules state that for reactions with an early transition state (exothermic reaction) between the two collision partners is the most effective in overcoming the activation energy to form products [9]. This means translation energy has a greater efficiency of promoting the reaction. On the other hand, reactions which have a late transition state (endothermic reaction), vibrational excitation has a greater efficiency of increasing the reactivity in comparison to translational energy [9].
However, Polanyi's rules only lead to qualitative predictions. This is because it is very hard to predict whether the transition state in a reaction will be an early or late one as the location of transition state is not always 100% accurate, there is some discrepancies [9].. In addition, due to these inaccuracies, it means the empirical rules provide only a small guidance on the vibrational and rotational modes of the molecules in the reaction [9].
Vibrational energy is more efficient in overcoming the activation barrier and promoting the reaction because if the atom just had translational energy and went through the reaction channel, the atom would just bounce off as the direction of the energy is not correct. However, with vibrational energy, the direction of the motion will align with the potential energy surface and into the reaction channel. This means with vibrational energy, there is an increased efficiency that the activation barrier will be overcome and a product formed. This means that reactions with a late transition state will form more product therefore, an endothermic reaction has a greater efficiency. This shows that the position of the transition state has a significant effect on whether the reaction is more likely to occur or not. However, translational energy is better at promoting an exothermic reaction in comparison to vibrational energy.
| Distance / pm | Momentum / g.mol-1.pm.fs-1 | |
|---|---|---|
| AB | 177 | -1.7 |
| BC | 74 | 0.8 |
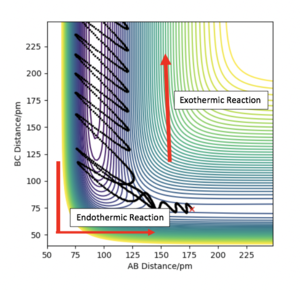
Figure 17 shows a reactive trajectory with two pathways, the endothermic pathway has a higher efficiency to vibrational energy whereas the exothermic pathway has a higher efficiency for translational energy.
References
1. Chemistry LibreTexts. 2020. 2.6: Potential Energy Surfaces. [online] Available at: <https://chem.libretexts.org/Courses/University_of_California_Davis/UCD_Chem_107B%3A_Physical_Chemistry_for_Life_Scientists/Chapters/2%3A_Chemical_Kinetics/2.06%3A_Potential_Energy_Surfaces> [Accessed 19 May 2020].
2. Wiki.ch.ic.ac.uk. 2020. CP3MD - Chemwiki. [online] Available at: <https://wiki.ch.ic.ac.uk/wiki/index.php?title=CP3MD#Objectives> [Accessed 20 May 2020].
3. Rossi.chemistry.uconn.edu. 2020. [online] Available at: <http://rossi.chemistry.uconn.edu/workshop/files/pes_ts_mep_exercises.pdf> [Accessed 20 May 2020].
4. Vallance.chem.ox.ac.uk. 2020. [online] Available at: <http://vallance.chem.ox.ac.uk/pdfs/ReactionDynamics.pdf> [Accessed 21 May 2020].
5. Laidler, K. J. & King, M. C. Development of transition-state theory. J. Phys. Chem. 87, 2657–2664 (1983).
6. Kästner, J. Theory and simulation of atom tunneling in chemical reactions. WIREs Comput. Mol. Sci. 4, 158–168 (2014). References
7. Chem.libretexts.org. 2020. Bond Lengths And Energies - Chemistry Libretexts. [online] Available at: <https://chem.libretexts.org/Bookshelves/Physical_and_Theoretical_Chemistry_Textbook_Maps/Supplemental_Modules_(Physical_and_Theoretical_Chemistry)/Chemical_Bonding/Fundamentals_of_Chemical_Bonding/Chemical_Bonds/Bond_Lengths_and_Energies> [Accessed 22 May 2020].
8. Cccbdb.nist.gov. 2020. CCCBDB Listing Of Experimental Data Page 2. [online] Available at: <https://cccbdb.nist.gov/exp2x.asp?casno=7664393&charge=0> [Accessed 22 May 2020].
9. Guo, H. & Liu, K. Control of chemical reactivity by transition-state and beyond. Chem. Sci. 7, 3992–4003 (2016).
10. POLANYI, J. C. Some Concepts in Reaction Dynamics. Science (80-. ). 236, 680 LP-690 (1987).
11. WIREs Comput Mol Sci 2013. doi: 10.1002/wcms.1165
Chemistry LibreTexts. 2020. Hammond’S Postulate. [online] Available at: <https://chem.libretexts.org/Bookshelves/Ancillary_Materials/Reference/Organic_Chemistry_Glossary/Hammond%E2%80%99s_Postulate> [Accessed 21 May 2020].


