
MRD:01502997
4/5 - Generally a strong report. There are one or two minor points that are commented, but otherwise an excellent piece of work!!
H + H2 system
Dynamics from the transition state region
Identification of Transition state
A transition state is a local maximum on a potential energy surface diagram (see figure1 and figure2 on the right) and can be defined mathematically by δV(ri)/δri=0. Both the transition state (local maximum on potential energy surface) and the reactants/products (local minimum on potential energy surface) can be represented by when the first derivative of potential energy equals to 0 (δV(ri)/δri=0). However, the transition state can be distinguished from the reactants or products using the second derivative of potential energy. When the second derivative is less than 0, this represents a local maximum and so the transition state. On the other hand, a second derivative greater than 0 corresponds to a local minimum, therefore the reactants or products.
Good, what is this kind of mathematical object called?


Estimation of transition state position
An estimated transition state position (rts) for the reaction between H and H2 will be when all three hydrogen atoms are 90.775 pm apart Well the farthest hydrogen atoms are 2x90.775 pm apart, but you have the right idea. At this position the force acting in either directions to form or dissociate a hydrogen hydrogen bond is close to 0. Hence, the distance between the atoms does not change with time and can be seen from figure3 on the right.
Good TS estimate
MEP and Dynamic calculations of trajectories
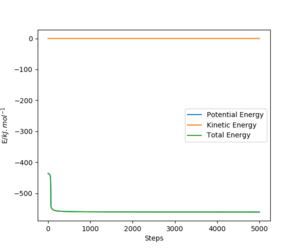
The minimum energy path (MEP) also known as the reaction path is, in this case, the reaction between HA-HB and HC to form HA and HB-HC that requires the minimal amount of energy. Calculations show that this is the collinear approach of the HC atom along the HA-HB bond.[1] Figure4 and Figure5 on the right shows the change in internuclear distance with time of the MEP after transition state and when masses of the atoms with there movement in gaseous phase (dynamics) are taken into account respectively. When calculated using MEP the graph shows smooth lines that corresponds to no vibration in the atoms whilst the dynamic calculation shows an oscillatory behaviour due to the vibration of the atoms. This atomic vibration is greatest within the atoms forming the new bonds as free atoms exhibit more translational than vibrational movement.
The oscillating behaviour is only seen when masses of the atoms are taken into account, such as in the dynamic calculation, as this corresponds to the present of both kinetic and potential energy. Hence, as the atoms in HB-HC vibrates the energy is constantly inter-converting between kinetic and potential energy. When considering MEP calculations however, the masses of the atoms and so potential energy are not taken into account. Hence, the smooth curves.
Furthermore, the plateau of the curves at around 194 pm representing HA and HB (r1) distance as well as HA and HC distance suggests that the atom HA and molecule HB-HC formed after the reaction stoped moving away from each other at 195 pm. This is different to the dynamic calculation where the newly formed products moved away from each other infinitely due to the potential energy being converted into kinetic energy of the products and can be shown by the exponential curves representing r1.
Good!
The reverse reaction of reactants to transition state
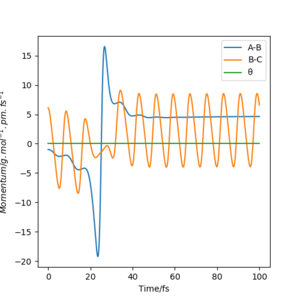
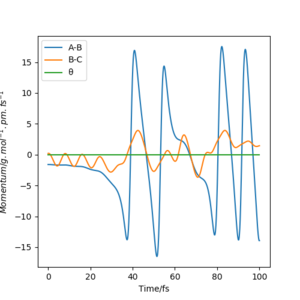
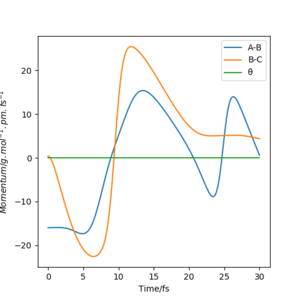
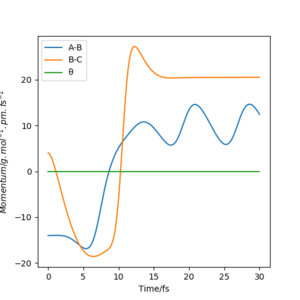
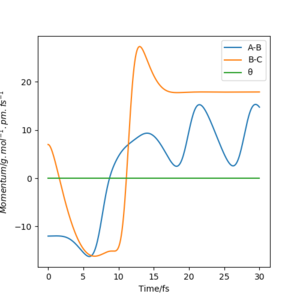
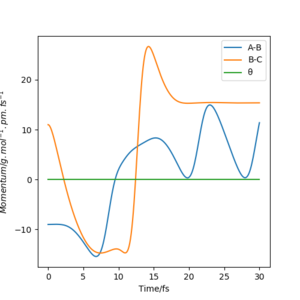
Below shows the internuclear distance against time(left) and momenta against time(right) plot. The top figures represents the reformation of HA-HB after the transition state was reached and the atom HC and molecule HA-HB moving further apart with time. The bottom figures represents the molecule HA-HB being approached by atom HC and eventually forming the transition state. The two distance against time graph are mirror images of each other and the momenta against time graphs are 180o rotations (C2 symmetry) of each other.
By putting the bottom and top reaction animations together. A trajectory of HC approaching HA-Hb, forming a transition state then reforming the initial reactants which rebound from each other can be seen. This suggests that no reaction has taken place as the transition state exerts momentum towards the reactant.
Furthermore, as the transition state is a local maximum on the potential energy surface the situations shown represent trajectories going down the valley from the transition state. unsure about your last bit, but everything else is broadly correct. Well done.


Reactive and unreactive trajectories
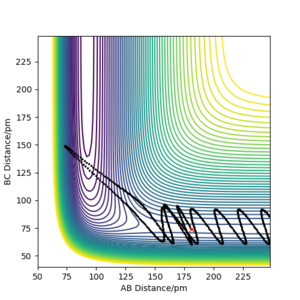
The reaction trajectory (represented by the black lines on the contour plots below) is a path that can be taken by the atoms involved in a reaction. Different to a reaction path, it does not have to be either of the reactants, products or transition state configuration and is used to explore the potential energy surface of a reaction.
The reaction path, on the other hand, is a path that connects the reactants, products and transition state.
Energy and reactivity
Summary of reactive and unreactive trajectories
| p1/ g.mol-1.pm.fs-1 | p2/ g.mol-1.pm.fs-1 | Etot | Reactive? | Description of the dynamics | Illustration of the trajectory |
|---|---|---|---|---|---|
| -2.56 | -5.1 | 414.280 | Reactive | HC approached HA-HB and forms the stable products HA and HB-HC via the transition state. The products moved away from each other after the reaction. An oscillatory behaviour can be seen as AB distance increases from 75 pm suggesting that HA- HB bind has broken and the vibration of the release HA is causing this oscillation. | 
|
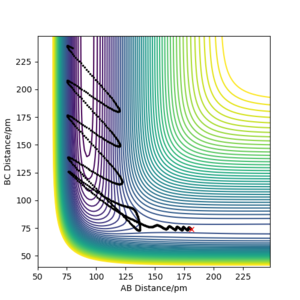
| -3.1 | -4.1 | 420.077 | Unreactive | HC approached HA-HB without enough energy to reach the transition state and so does not result in a reaction but stays as HC and HA-HB which moved away from each other after the approach. | 
|
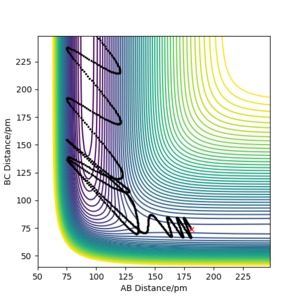
| -3.1 | -5.1 | 413.977 | Reactive | This is the same as the first case where HC approached HA-HB and forms the stable products HA and HB-HC via the transition state.The products moved away from each other after the reaction. An oscillatory behaviour can be seen as AB distance increases from 75 pm suggesting that HA- HB bind has broken and the vibration of the release HA is causing this oscillation. However, as the molecule HA- HB started with a larger momentum compared to case 1 the atoms within the molecule is oscillation more. Hence, the presence of an oscillating behaviour before approaching the transition state. | 
|
| -5.1 | -10.1 | 357.277 | Unreactive | Barrier Recrossing. HC approached HA-HB with enough energy to form the products HA and HB-HC via the transition state. However, the products formed with excess energy then reacted to reform the reactants which moved away from each other after the reformation. | 
|
| -5.1 | -10.6 | 349.477 | Reactive | Barrier Recrossing. HC approached HA-HB with enough energy to form the products HA and HB-HC via the transition state. However, the products formed with excess energy then reacted to reform the reactants which reacted again, with enough energy, to form the products that finally moved away from each other after the reformation. | 
|
Conclusion: Not all trajectories starting with the same positions but with higher values of momenta (higher kinetic energy) would be reactive. As shown in the table above, trajectories with a momenta (kinetic energy) too high may result in the reformation of the reactants in order to dissipate the excess energy. This may not react again to form the products if the reactants no longer have enough energy to react. Hence, it is crucial to have the right amount of kinetic energy for a reaction to proceed successfully. Also, having a greater kinetic energy and hence total energy does not guarantee the succession of the reaction if the same starting position is not kept as HC may not be approaching HA- HB in the direction (along the bond) which results in the MEP. Hence, more energy may be required to overcome the activation barrier and form stable products.
Transition state Theory
The transition state theory (TST) separates the reaction into two regions, the reactant region and the product region, by the transition state.[2] When applying TST to potential energy surfaces a few assumptions apply:[2]
1. The Born-Oppenheimer approximation applies
2. Quantum-tunnelling negligible
3. The energies of atoms in the reactant region are Boltzmann distributed
4. System that has reached transition state with momentum towards the product configuration will not reenter the reactant region
However, as discussed in section 1.2.1, products formed with enough energy can react to reform reactants by barrier recrossing and so reenter the reactant region. Hence, the TST overestimates reaction rates and calculations will result in rate values greater than the experimental rate values. Good! Keep in mind that QM effects to play a role (tunneling will increase the rxn rate relative to TST) but this is totally outweighed by TS recrossing.
F-H-H system
PES inspection
Energetics and transition states of the reaction between F + H2 and HF + H
The reaction between F and H2 forming a new F-H bond is exothermic whilst the reaction between H-F and H forming a new H-H bond is endothermic. This is due to the H-F bond (565 kJ/mol) [3] being stronger and so requiring more energy to break compared to the H-H bond( 432 kJ/mol)[3]. More energy is also released when the stronger H-F bond is formed compared to the H-H bond. Hence, an overall energy is given out during the reaction between F and H2 and an overall energy is required for the reaction between H-F and H. This can be seen in the Figures below (F + H2 on the left and F-H + H on the right) where A represents the F atom and B/C represents the H atoms.


Both plot may seem to be the same but the figure on the left representing F + H2 happened in the direction where AB decreases (right to left) whilst the figure on the right representing F-H + H happened in the direction where AB distance increases. Hence, the reactant energy (represented by the local minimum on the right of the graph) for the reaction F + H2 is higher than the product energy (represented by the local minimum on the left of the graph). This indicates an exothermic reaction where the excess energy from the reactant is given off to the surrounding. On the other hand, the reactant energy (represented by the local minimum on the left of the graph) for the reaction F-H + H is lower than the product energy (represented by the local minimum on the right of the graph). This indicates an endothermic reaction where extra energy is required from the surrounding to allow the occurrence/initiation of the reaction.
The transition state of the reaction between F and H2 is located at AB (where F=A, H=B and H=C) distance of approximately 181.104 pm and BC distance of approximately 74.488 pm.(shown by the red cross in figure6 below)

The transition state of the reaction between F-H and H is located at AB distance (where A/B=H and C=F) of approximately 74.488 pm and BC distance of approximately 181.104 pm. (shown by the red cross in figure7 below)

Locating activation energy for both reactions
The activation energy of an reaction is the energy difference between transitions state and the reactant. Hence, the activation energy can be calculated for both system from the transition state energy that was determined to be -433.981 kJ/mol and their reactant energy which can be determined from a energy against time plot.
The transition energy for both reactions are the same as the transition state are the same for both reaction.
For the exothermic reaction between F and H2 the reactant energy was found from the figures below to be -434.364 kJ/mol. The activation energy is therefore (-433.981+434.364=)0.383 kJ/mol. This is a little on the low side (the true value is >1), likely because you didn't let the simulation run for long enough. Your TS estimate appears sensible.

   The figure on the left represents the energy vs time plot and the figure on the right represents the contour plot which shows
   the reaction going in the direction that forms the reactants from the transition state.
   A=F B=H C=H


For the endothermic reaction between HF and H the reactant energy was found from the figures below to be -560.435 kJ/mol. The activation energy is therefore (-433.981+560.435=) 126.454 kJ/mol.
   The figure on the left represents the energy vs time plot and the figure on the right represents the contour plot which shows
   the reaction going in the direction that forms the reactants from the transition state.
   A=H B=H C=F


The calculated activation energies confirm that F + H2 is an exothermic reaction and HF + H is an endothermic reaction due to the reasons explained in 2.1.1.
Reaction dynamics
F+H2 system-Energy conservation


Figure8 below shows a reactive trajectory for the reaction F + H2 where the initial conditions were set to AB=181 pm and BC=74 pm. (where A=F B=H C=H) The initial momentum were set to 0 g.mol-1.pm.fs-1 for both reactant. This initial condition was used as it is close to the conditions of the transition state which resembles the reactant but not exactly the same as the conditions of the transition state so forces required to initiate the reaction is not 0. As the momentum are set to 0 the kinetic energies of the reactants are also 0. Figure8 shows the reaction started with little oscillatory behaviour which effect increased as the reaction progress to form the products. This behaviour can be explained by Figure9 where the initial vibrational (potential) energy of molecule H2 was converted to translational (kinetic) energy constantly (due to conservation of energy) causing one of the H atom to approach F and to exert van der waals forces on each other. This attractive force between the atoms caused further conversion of more of the H2 vibrational energy to its kinetic energy. Eventually, the attractive forces between the H and F atom became large enough to overcome the H-H bond strength and so the H-H bond break and H-F bond form. Some of the original vibrational energy of H2 converted to kinetic energy were then converted to the vibrational energy of HF. The rest of the original vibrational energy were converted to the kinetic energy of the H atom released and so the H atom moves away from the HF molecule formed. The increase in amplitude of the momentum of both A-B (HF) and B-C (H2) suggests that vibrational energy are converted to kinetic energy due to the conservation of energy as only vibrational energy was present before the start of the reaction. The effect of the conversion, and so amount of energy converted, became significant before 200 fs when the reaction has started.
The animation (figure9 and figure10) of the reaction is also a good demonstration for this.
The release of the reaction energy could be confirmed experimentally using bomb calorimetry. The calorimeter used is an isochronic system that measures the change in internal energy in the form of heat (temperature change) using the equation below.[4]
qcal=CcalΔT=−qv,system
Ccal is the heat capacity of the calorimeter.
Bomb calorimetry is generally not suitable as it doesn't distinguish between translational and vibrational KE.
F+H2 system-Energy and reactivity
When introducing an initial momentum to the reactants and hence, putting a significant amount of energy (much more than the activation energy) into the system on the H - H vibration the reaction does not always end up forming the products (depending on the amount of extra energy put in). However, it may form products as an intermediate with high enough energy to react and reform the reactants. This effect is demonstrated in the figures below. Therefore, a right amount of energy and momentum in the correct direction are required for the reaction to proceed and end up on the product side.
The initial distance between AB and BC are kept the same as in 2.2.1 but pHF = -1.0 g.mol-1.pm.fs-1 and pHH varied from -6.1 to 6.1 g.mol-1.pm.fs-1.
pHH=-6.1 g.mol-1.pm.fs-1 Overall=unreactive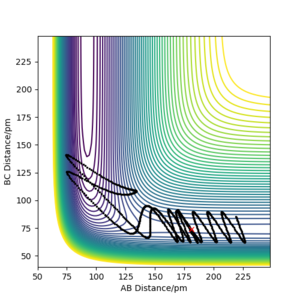
pHH=-3.0 g.mol-1.pm.fs-1 Overall=unreactive

pHH=0.0 g.mol-1.pm.fs-1 Overall=reactive
pHH=3.0 g.mol-1.pm.fs-1 Overall=reactive
pHH=6.1 g.mol-1.pm.fs-1 Overall=unreactive


The above finding can be further proved by increasing pHF by a little in the same direction but greatly reducing the magnitude of pHH and hence reducing the overall energy of the system.
   pHF=-1.6 g.mol-1.pm.fs-1 pHH=0.2 g.mol-1.pm.fs-1
   Overall=reactive


The reaction is reactive despite the decrease in energy of the system. In conclusion, the increase in energy of the system may increase the oscillation strength and frequency of molecules as well as increase kinetic energy of the reactants and products (proportional to magnitude of momentum) but it does not necessarily increase the chance of succession of the reaction.
H+HF system
The initial condition for a reactive trajectory of H + HF was set to AB=200 pm, BC=92 pm, pHF=0 g.mol-1.pm.fs-1 and pHH=-17 g.mol-1.pm.fs-1. (A=H B=H C=F) This is shown in the figure below.
pHH was set to be above the activation energy to ensure that the H atom approaches HF with high enough kinetic energy to initiate the reaction and form stable products.


Further determination of reactive trajectories by decreasing the value of pHH and increase the value of pHF shows that a small displacement of pHH from the initial condition requires a even smaller increase in pHF to result in a reactive trajectory. Hence, translational energy has a bigger effect on the system than the vibrational energy. However, as the displacement of pHH from the initial condition becomes larger, the effect of vibrational energy on the system increases and overcomes the effect of translation energy. Hence, a greater increase in pHF ( compared to the increase in pHH) is required to result in a reactive trajectory. This is illustrated in the figures below.
pHF=0.40 g.mol-1.pm.fs-1 pHH=-16 g.mol-1.pm.fs-1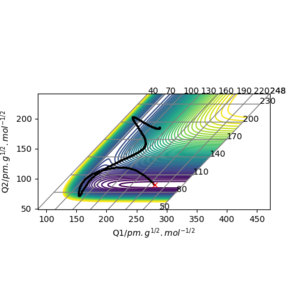


pHF=2.0 g.mol-1.pm.fs-1 pHH=-15 g.mol-1.pm.fs-1


pHF=4.0 g.mol-1.pm.fs-1 pHH=-14 g.mol-1.pm.fs-1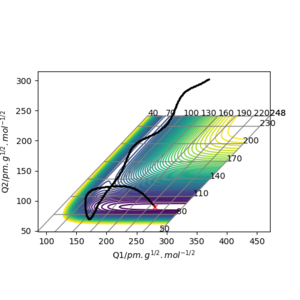


pHF=7.0 g.mol-1.pm.fs-1 pHH=-12 g.mol-1.pm.fs-1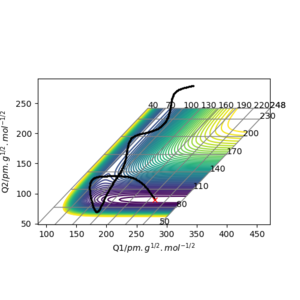


pHF=11.0 g.mol-1.pm.fs-1 pHH=-9 g.mol-1.pm.fs-1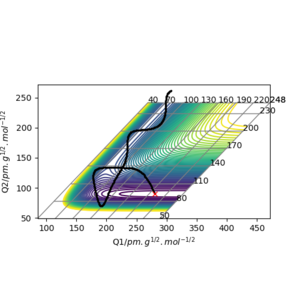


The two momentum are set to be acting in opposite directions so a smaller (decreasing) magnitude of pHH is required each time to result in a reactive trajectory.
Polanyi's empirical rules
Polanyi's rule states that vibrational energy is more efficient in promoting a late transition state reaction than translational energy.[5] This explains the previous experiments where the vibrational energy becomes more efficient in promoting the endothermic, late transition state, reaction of H + HF than the translational energy.
Further experiments on the exothermic, early transition state, F + H2 reaction can be conducted to see if translational energy is more efficient in promoting a early transition state reaction than vibrational energy.
Good examples! Absolutely correct.
References
- ↑ Atkins, P. W. (1940) Chapter 18 Reaction dynamics. Atkins' Physical chemistry. Eleventh edition. Oxford, United Kingdom : Oxford University Press 2018. ISBN 9780191092183 ; ISBN 9780198769866.
- ↑ 2.0 2.1 Bligaard, T. and Nørskov, J. K. (2008) ‘Heterogeneous catalysis’, in Chemical Bonding at Surfaces and Interfaces. Elsevier, pp. 255–321. doi: 10.1016/B978-044452837-7.50005-8.
- ↑ 3.0 3.1 Covalent Bond Strengths | Grandinetti Group (no date). Available at: https://www.grandinetti.org/covalent-bond-strengths (Accessed: 21 May 2020).
- ↑ Bomb Calorimetry (no date). Available at: https://ch301.cm.utexas.edu/section2.php?target=thermo%2Fthermochemistry%2Fbomb-calorim.html (Accessed: 21 May 2020).
- ↑ Zhang, Z. et al. (2012) ‘Theoretical study of the validity of the polanyi rules for the late-barrier Cl + CHD3 reaction’, Journal of Physical Chemistry Letters. American Chemical Society, 3(23), pp. 3416–3419. doi: 10.1021/jz301649w.