
MRD:01497384
Molecular Reaction Dynamics: Applications to Triatomic systems
Ng611 (talk) 18:34, 22 May 2020 (BST) Overall 5/5 - An excellent (really, near perfect) piece of work. Well done. One or two minor comments are outlined throughout.
H + H2 system
Dynamics from the transition state region
The transition state on a potential energy surface (PES) is neither the local maximum nor the local minimum, it is the configuration corresponding to the maximum (which is also termed a 'first-order saddle point') in the direction of the minimum energy path, and a minimum in all other directions perpendicular to the path. The minimum energy path is highlighted by the oscillating black line in Figure 1 and 2.
-
 Figure 1. A Potential Energy Surface plot showing the minimum point in the direction orthogonal to the minimum energy path.
 -
 Figure 2. A Potential Energy Surface plot showing the maximum point along the minimum energy path.


A mathematical view
The transition state is defined mathematically as having a partial derivative of 0 with respect to each of its axes on the PES, given by ∂V(rAB)/∂rAB= ∂V(rBC)/∂rBC= 0, which is characterised by a zero gradient. A simple criterion for distinguishing between a saddle point and a local minima is to compute the Hessian Matrix at the point of the PES function. A local minima would have a negative Hessian matrix determinant while a saddle point would have a positive Hessian determinant.
If :
, AND , the point is a local minima.
, AND , the point is a local maxima.
, the point is a saddle point.
The Hessian is defined along the AB and BC direction. The eigenvalues of the Hessian matrix correspond to the vibrational frequencies and determines the curvature along its eigenvectors. A local minima only has positive eigenvalues as the curvature at the point in all directions are positive. The saddle point of the transition state has one (and only one) negative eigenvalue in its Hessian, as the point is a maximum in one direction along the reaction path and a minimum in all other orthogonal directions.
Ng611 (talk) 18:18, 22 May 2020 (BST) An excellent answer, well done!
Locating the transition state
Ng611 (talk) 18:21, 22 May 2020 (BST) Good estimate and a good rationale for the TS location, well done!
If a trajectory is set at the exact point of the transition state with no initial momentum, there will be no force acting on the atoms (gradient on the PES is zero), thus it will remain there indefinitely. The transition state bond length can be located by starting trajectories near the transition state and adjust accordingly upon observation of the signs of forces along on the atoms. According to the Hammond's Postulate, the transition state is symmetrical and the PES is symmetric. Thus it is expected that rAB=rBC at the transition state.
An initial estimation is made for the transition state bond length (rTS) by initiating a trajectory with rAB and rBC at 90.0 pm. The force along AB and BC are +0.132 kJ/mol/pm and slight oscillations of rBC could be seen on the Internuclear Distance vs Time plot shown in Figure 3. This suggests that 90 pm is not the exact transition state bond length. By expanding in to Figure 3, an average position of rTS was given to be 90.8 pm.
-
 Figure 3. Internuclear Distance vs Time plot when rTS=90 pm
 -
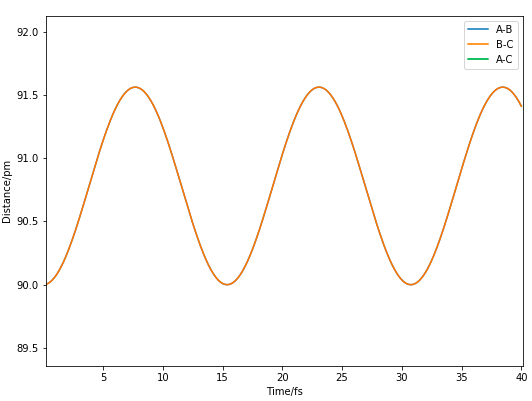 Figure 4. Expanded Internuclear Distance vs Time plot when rTS=90 pm


Further estimation of a 90.8 pm rTS showed the forces to be -0.004 kJ/mol/pm, showing that the forces acting upon the atoms are in the opposite direction from the first estimnation.
This allowed a satisfactory estimate of the rTS of 90.775 pm, where the forces are -0.000 kJ/mol/pm and straight horizontal lines with no oscillations are shown in the Internuclear Distance vs Time plot in Figure 5, indicating a zero potential gradient.
-
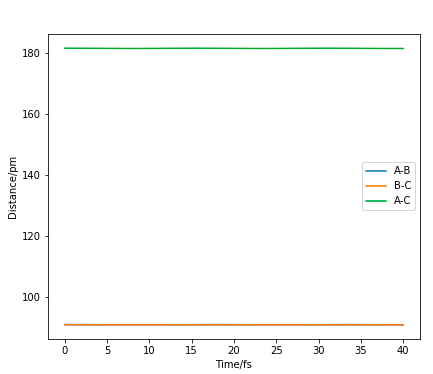 Figure 5. Internuclear Distance vs Time plot when rTS=90.775 pm

Thus, the best estimate of the transition state position (rts) is 90.775 pm. At this TS position, the Hessian has one positive and one negative eigenvalue, corresponding to a negative curvature in one direction and a positive curvature in the orthogonal direction.
Comparison between Dynamics and MEP trajectories
Ng611 (talk) 18:23, 22 May 2020 (BST) Excellent!!
The minimum energy path (MEP) is defined as the lowest energy reaction path with infinitely slow motion, such that at each time step, the velocities of the atoms are reset to 0, thus the atoms have no oscillations. A trajectory is initiated at a position of rAB= 90.775 pm and rBC= 91.775 pm with each atom having a zero initial momenta, resulting in a downhill trajectory forming the product of AB molecule. Figure 6.0 and 6.1 correspond to the MEP and Dynamics surface respectively, The difference observed can be seen in the oscillatory motion in the Dynamics Calculation which is not seen in the MEP calculation. The oscillatory motion observed in the Dynamics plot is due to the gain in momenta of the atoms, allowing them to be at positions with higher potential energies which result in their vibrational motions. The absence of oscillatory motion in MEP shows that the molecule is not vibrating, it simply follows the valley floor of the PES. This is because the inertial effect of the atoms are removed in a MEP calculation, thus does not gain any vibrational energy.This is not the case in reality.
-
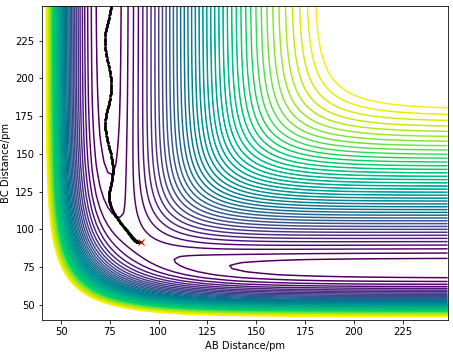 Figure 6.0. Dynamics Calculation of a contour plot.
 -
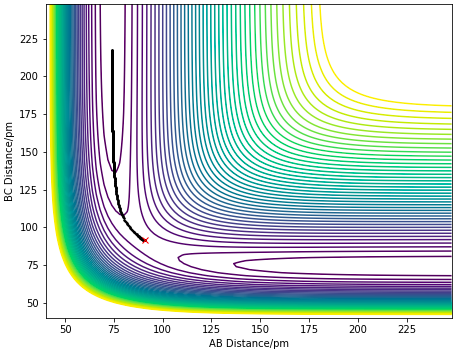 Figure 6.1 MEP calculation of a contour plot.


In Figure 7.0, the dynamics calculation shows oscillating momenta over time allowing the molecule to vibrate and have oscillating internuclear distance as shown in Figure 8.0. Whereas in Figure 7.1. of the MEP calculation, the momenta is constant over time showing no vibrational motions, thus giving a constant internuclear distance over time as shown in Figure 8.1.
-
 Figure 7.0. Dynamics calculation of H + H2 system with trajectory from AB=rTS and BC=rTS+ 1 pm..
 -
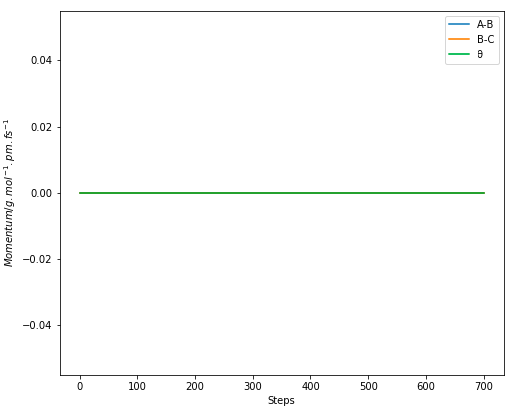 Figure 7.1. MEP calculation of H + H2 system with trajectory from AB=rTS and BC=rTS+ 1 pm..


-
 Figure 8.0. Dynamics calculation of Internuclear Distance vs Time.
 -
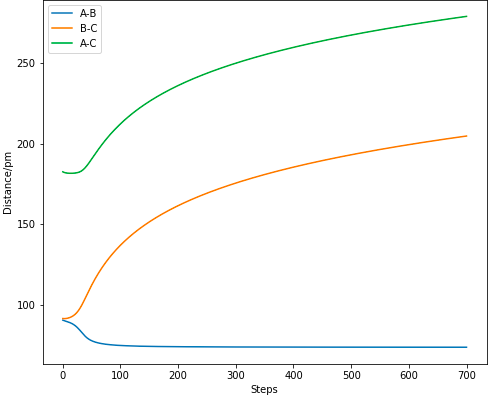 Figure 8.1 MEP calculation of Internuclear Distance vs TIme.


Changing the initial conditions of the trajectory
Changing the initial conditions by swapping the initial values of rAB and rBC would reverse the reaction, in which the trajectory would travel in the opposite direction forming the molecule BC instead of AB, illustrated in Figure 9.0 and 9.1.
-
 Figure 9.0. Dynamics calculation of H + H2 system with trajectory from BC=rTS and AB=rTS+ 1 pm.
 -
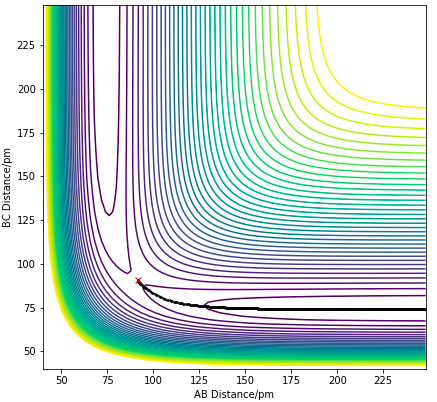 Figure 9.1. MEP calculation of H + H2 system with trajectory from BC=rTS and AB=rTS+ 1 pm. .


For a Dynamics calculation, initiating a trajectory with the final coordinates and the same values of momentum with inverted signs obtained from the calculations done above forms a pathway back to the same initial coordinates and momentum values. For an MEP calculation, the reaction pathway continues down the valley along the lowest energy on the PES as all of the atoms have zero momentum.
-
 Figure 10.0. Dynamics calculation of H + H2 system with trajectory from BC=rTS and AB=rTS+ 1 pm.
 -
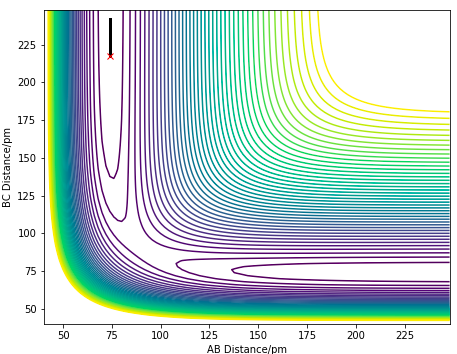 Figure 10.1. MEP calculation of H + H2 system with trajectory from BC=rTS and AB=rTS+ 1 pm. .


Reactive and unreactive trajectories
| Reaction | p1 | p2 | Etot | Reactivity | Contour Plot | Description of pathway |
|---|---|---|---|---|---|---|
| A | -2.56 | -5.1 | -414.3 | Reactive |  |
HA atom approaches a non-vibrating HBC molecule. The atoms/molecule have enough momentum to overcome the energy barrier at the TS, resulting in a new vibrating molecule HAB and HC departs. |
| B | -3.1 | -4.1 | -420.1 | Unreactive |  |
There is insufficient momentum/kinetic energy to overcome the energy barrier, hence molecule HAB does not form and HA is rebounded. |
| C | -3.1 | -5.1 | -414.0 | Reactive |  |
Atom HA approaches a slightly oscillating HBC molecule with sufficient kinetic energy to react and form the product of HAB molecule while HC departs. |
| D | -5.1 | -10.1 | -357.3 | Unreactive |  |
The HBC molecule was initially formed in the reaction. However, the excess kinetic energy resulted in recrossing of the barrier and the reactants are reformed. |
| E | -5.1 | -10.6 | -349.5 | Reactive |  |
The HA atom approaches a non-oscillating HBC molecule with high kinetic energy, subsequently forming a product with high vibrational energy. |
In conclusion, it is shown that a system with sufficient momentum i.e kinetic energy alone is not enough for a reaction to be reactive. This is because not every oscillation along the reaction coordinate takes the complex through the transition state and a molecule might be rotating about the wrong axis. The energy must be in the right vibrational modes and the reactants have to be in the correct orientation for a successful outcome of the reaction.
Transition State Theory
The transition state theory (TST) provide a means of calculating the rate constant of a reaction. It considers a critical dividing surface separating the reactants and the products and relies on a few assumptions:
1. A system that has crossed the TS (the dividing surface) in the direction of the product cannot recross the barrier and reform the reactants.
2. The energy among the reactants are distributed according to the Maxwell-Boltzmann law.
3. At the TS, any motion along the reaction coordinates can be treated classically as translation, any quantum tunnelling effects are neglected.
4. The Born-Oppenheimer approximation is applied.
Assumption 3 of the TST might lead to an underestimation of the rate constant as the theory neglects quantum tunnelling effect which will lead to the formation of products. This leads to a lower predicted rate constant as some particles with insufficient energy are able to overcome the barrier due to quantum tunnelling. However, this effect is negligible compared to assumption 1 which is more significant in the prediction of rate constants. This theory does not predict the recrossing of barrier in which the products reform the reactants, as seen in reaction D. Thus, the assumptions from the transition state theory would provide an overestimation of the rate constants in comparison with experimental values.
Ng611 (talk) 18:25, 22 May 2020 (BST) An exemplary answer to the question and an exemplary section 1 overall. Well done!
F - H - H system
PES inspection
Energetics of the reactions
Figures 11.0 and 11.1 show the PES of a F + H2 and a HF + H system respectively. The F + H2 is an exothermic reaction while the HF + H is an endothermic reaction. Both reactions are backward reactions of the other, thus they share an identical PES in opposite directions.
-
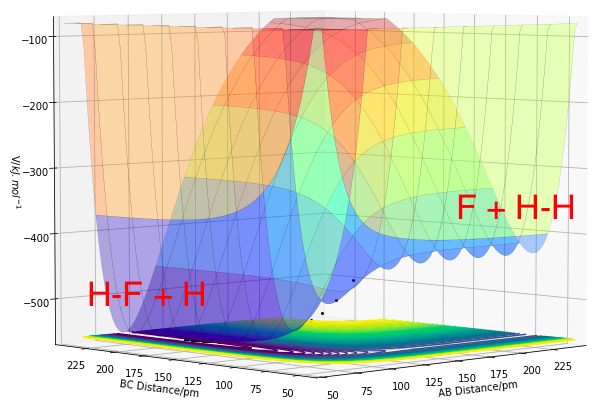 Figure 11.0. Potential Energy Surface of F + H2, where A=F and BC=H2
 -
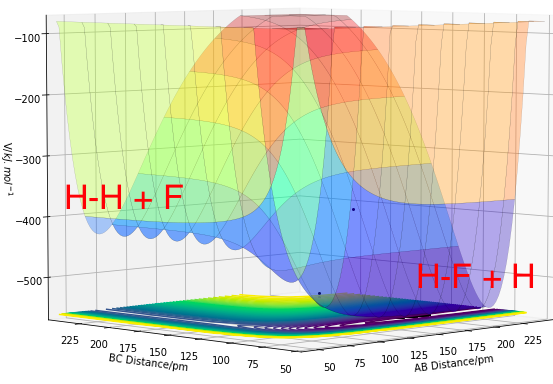 Figure 11.1. Potential Energy Surface of H + HF, where A=H and BC=HF .


In Figure 11.0, the reactants (H2 + F) have a higher potential energy than the products (HF + H), where rAB denotes the distance between H-F and rBC is the distance between the reactant atoms H2. This can be related to the stronger bond strength of the product H-F compared to the weaker H-H bond. The energy released from the formation of H-F bond is higher than the energy needed to break the H-H bond as a result of their bond strengths. Thus, the enthalpy change of reaction would be negative, suggesting exothermic reaction with a release in energy. Similarly for the reaction in the reverse direction (HF + H), the reactants (HF and H) have a higher potential energy than the products (H2 + F). For the same reason, a positive enthalpy change of reaction suggests formation of the weaker H-H bond and the dissociation of the stronger H-F bond, leading to an endothermic reaction, where energy is being taken into the system.
Approximate TS position
Since both reactions are reverse reactions of one another, they have the same transition state. According to the Hammond's postulate, the structure of a transition state would resemble that which is closer in energy to the TS. The exothermic F + H2 would have an early transition state, thus the H-H bond length in the TS would be expected to be similar the the reactant bond length, which is around 74 pm. Thus a BC distance of 74 pm would be a good starting point for the approximation of the TS position.
The TS can be found by finding a position at the PES where there are no net forces acting on the particles with zero initial momentum. The position of the F-H-H transition state was approximated, where the F-H distance is 181.1 pm and the H-H distance is 74.5 pm. At this position, there is zero net force on the particles, indicating a saddle point with zero gradient.
Ng611 (talk) 18:28, 22 May 2020 (BST) Excellent response. I'd also maybe also do a small experiment where you displace the system a little way from the TS and allow it to roll down either side of the barrier. The reason i'd recommend this is that for such a small energy barrier, the forces may disappear due to rounding, but they'll still have an effect on the trajectory.
-
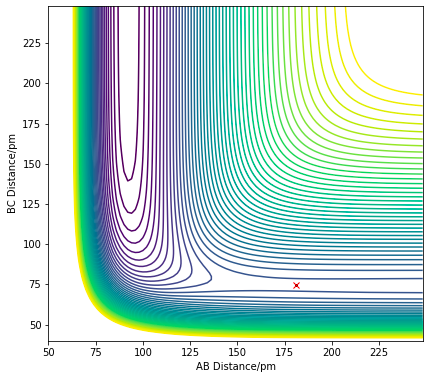 Figure 12.0. Contour plot showing the saddle point (TS) of F + H2 reaction
 -
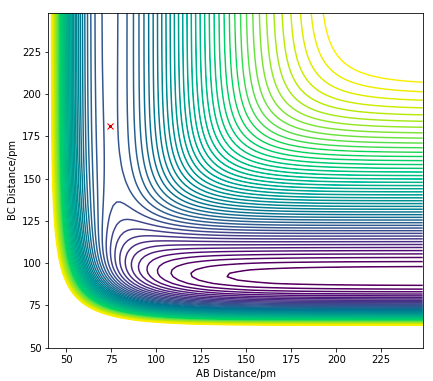 Figure 12.1. Contour plot showing the saddle point (TS) of H + HF reaction


Activation energy
The activation energies (Ea) of the reactant can be estimated by slightly displacing the particles from the transition state in the direction of the reactants and the products in the F + H2 system and plotting an MEP calculation of the total energy vs time. The total energy in an MEP calculation corresponds to the potential energy in the system, allowing us to calculate the Ea. The Ea is then taken as the difference in potential energy between the transition state and the respective energies of the reactants.
Figure 13.0 shows the Energy vs Time plot in the direction of the HF formation. The energy of the transition state is -434.0 kJ/mol while the energy of the products H + HF is -560.5 kJ/mol. Figure 13.1 shows the Energy vs Time plot in the direction of the H2 formation. The energy of the products F + H2 is approximately -434.9 kJ/mol.
Ng611 (talk) 18:29, 22 May 2020 (BST) These are good estimates of the activation barriers. Your F+H2 reaction barrier is about 0.2 kJ/mol too small (as you can see you still have a negative gradient in your energy vs time plot) but overall this is a minor thing so don't worry too much about it.
-
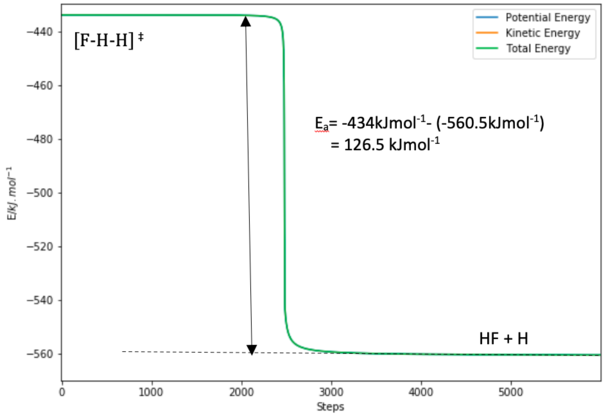 Figure 13.0. Energy vs Time plot of the formation of HF+ H from the TS
 -
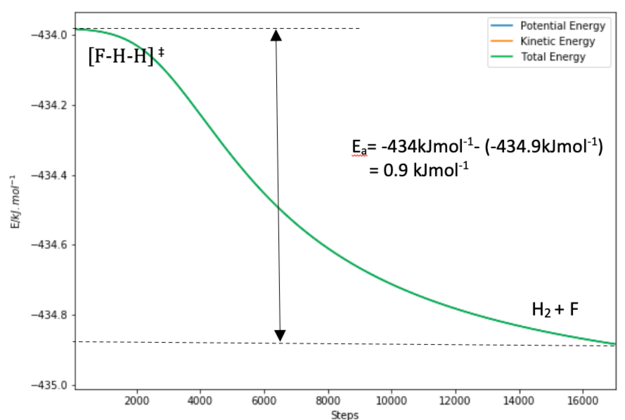 Figure 13.1. Energy vs Time plot of the formation of H2+ F from the TS


From Figures 13.0 and 13.1, the estimated activation energies are:
0.9 kJ/mol for the F + H2 -> HF + F reaction and
126.5 kJ/mol for the H + HF -> F + H2 reaction.
Reaction dynamics
Mechanism of energy release
From the Momenta vs Time plot (Figure 14) of the reactive trajectories for the F+ H2 system, it is observed that the system moves faster and has greater oscillations. This shows that the loss in potential energy associated with the reaction is converted to translational and vibrational kinetic energy as shown in the oscillating momentum. The kinetic energy gained in the system would then be converted to heat and released to its surroundings. Experimentally, this could be determined by measuring a change in temperature. The bomb calorimetric method- although useful in direct measurement of the increase in temperature as a result of gain in kinetic energy- is unable to distinguish between the 2 forms of kinetic energy.
A better alternative would be to perform an infrared chemiluminescence experiment. The intensities of the IR emission lines in the emission spectrum from the vibrationally excited molecules can then be used to measure the relative populations of the vibrational states of the product molecules. IR absorption spectroscopy would also be useful in analysing the vibrational states of the products. From the figures shown below, the products have higher oscillations than the reactants, showing that they are more highly vibrating. Thus, overtones could be observed in the absorption spectroscopy as a result of an increased population of the vibrational excited states of the products.
-
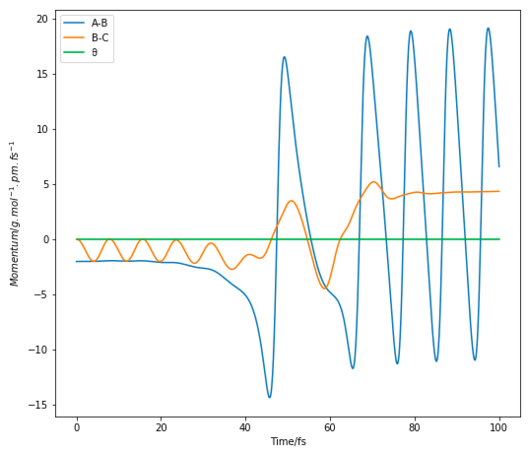 Figure 14 Momenta vs Time plot of F + H2 with initial conditions rFH= 194 pm, rHH= 74 pm, pFH= -2 g.mol-1.pm.fs-1, pHH= 0 g.mol-1.pm.fs-1

Ng611 (talk) 18:31, 22 May 2020 (BST) Good response. IR chemiluminescence was indeed how this mechanism of energy release was confirmed. Well done!
Polanyi's empirical rule
Ng611 (talk) 18:33, 22 May 2020 (BST) A very neat and well thought-out discussion of Polanyi's rules. Well done!
The Polanyi's empirical rule states that for a reaction with early transition state (i.e an exothermic reaction), translational kinetic energy is more effective than the vibrational energy in overcoming the activation barrier, and vice versa for a reaction with late transition state (i.e. an endothermic reaction), provided that the system has enough total energy to overcome the barrier. This provides a better understanding of the dependance of reaction rate constants on the distribution of energy over the different modes motions of the reactants.
| Case | RHF | RHH | ρHF | ρHH | Contour Plot |
|---|---|---|---|---|---|
| 1 | 190 pm | 74 pm | -1.0 | -3 | 
|
| 2 | 190 pm | 74 pm | -1.0 | 5.6 | 
|
| 3 | 190 pm | 74 pm | -1.6 | 0.2 | 
|
For the F + H2 exothermic reaction, several trajectories have been generated as shown in the table above, where ρHF is the translational momentum of atom F approaching the H2 molecule, and ρHH is the vibrational momentum of the H2 molecule. In case 1 and 2, the singular F atom has a relatively low translational energy while the H2 molecule posses high vibrational energies. In both cases, the trajectories are unreactive. In case 3, the kinetic energy of the approaching F atom is increased while the vibrational motion of the H2 molecule is significantly lowered. The initial conditions in case 3 led to a reactive trajectory successfully forming products. Thus, the results shown are in accordance with Polanyi's rule. This reaction is an exothermic reaction with an early transition state, therefore an increase in translational energy of a system is more effective in allowing the crossing of the barrier to form products.
| Case | RHH | RHF | ρHH | ρHF | Contour Plot |
|---|---|---|---|---|---|
| 1 | 190 pm | 90 pm | -10 | -0.1 | 
|
| 2 | 190 pm | 90 pm | -1.0 | 21 | 
|
| 3 | 190 pm | 90 pm | -1.0 | -26 | 
|
For the H + HF endothermic reaction, the ρHH is the translational momentum of atom H approaching the HF molecule, and ρHF is the vibrational momentum of the HF molecule. In case 1, the singular H atom has a relatively high translational energy while the H2 molecule posses low vibrational energies. This results in an unreactive trajectory. In case 2 and 3, the kinetic energy of the approaching H atom is decreased while the vibrational motion of the H2 molecule is significantly increased. The initial conditions in both cases led to reactive trajectories, successfully forming products. These results, again, follow Polanyi's rule. This reaction is an endothermic reaction with a late transition state, therefore vibrational kinetic energy plays a more important role in overcoming of the activation barrier to form products.
Bibliography
1. H. Bernhard Schlegel, Optimization of equilibrium geometries and transition structures, J. Comput. Chem., 1982, 3(2), pp. 214-218.
2. I. N. Levine, Physical Chemistry, McGraw-Hill, 6th edition, 2009, ch. 22.
3. J. C. Polanyi and W. H. Wong, J. Chem. Phys., 1969, 51(4), pp 1439-1450.
4. K. J. Laidler, Chemical Kinetics, 1951, 55 (5), pp 759-760