MRD:01496067HYT
Overall, I think you have completed this report well. However, your answers felt they were slightly missing some background/theory to them. It is obvious you know what you are doing, but do not be shy in writing out your train of thought/justifying why you concluded this/ how you know this is the case.Mys18 (talk) 01:05, 23 May 2020 (BST)
H + H2 system
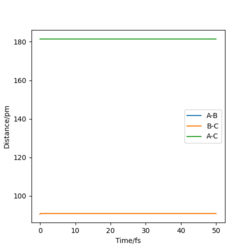
The transition state is mathematically defined as the saddle point of a surface. To distinguish the transition state from the local minimum, check that if it is a maximum on another set of axis perpendicular to the original axis.
What is the mathematical definition/ a saddle point in terms of a maximum/minimum and some relation to the gradient? I understand where you are coming from, but may be worth adding slightly more description to your answers to give it more context. The TS is a local minima in one direction and a maxima in the other (orthogonal to previous)...Mathematically we can take the second derivative and if it is >0 or <0 tells us if it is a TS or local minimum --> the wordy explanation explains the maths.Mys18 (talk) 00:37, 23 May 2020 (BST)
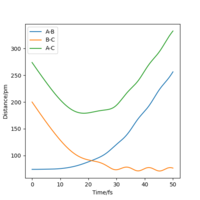
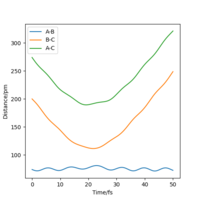
The best estimated rts is 90.774 pm. As seen that the internuclear distance vs time plot show three straight horizontal lines (where AB and BC distance overlap), which suggests that the atoms are in the energy stationary point, there is no change in distance over time and hence no oscillation is occurring. Assuming by overlap you mean equal. Good, but how do you know this? Some explanation to your reference?Mys18 (talk) 00:37, 23 May 2020 (BST)
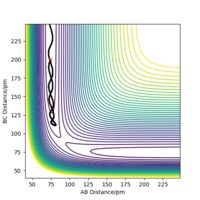
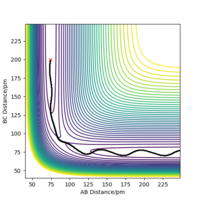
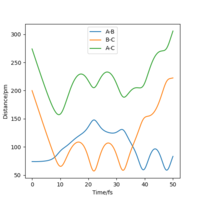
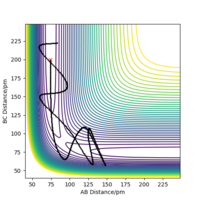
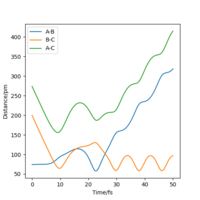
The MEP ignores the kinetic energy of the atoms, hence no oscillation is observed in the mep plot, and it only shows the minumum energy path that the system go through while proceeding the reaction; whereas in the actual trajectory, the atoms do oscillate due to conservation of energy. The energy released after passing the activation energy barrier is converted to kinetic energy of the particles, hence the molecule vibrates and shows a curly path in the trajectory.The actual trajectory meaning dynamic? Which one would you say is more realistic, MEP or dynamic?Mys18 (talk) 00:50, 23 May 2020 (BST)
| Type of Calculation | Countour Plot | Momentum vs time Plot |
|---|---|---|
| MEP |  |

|
| Dynamics |  |

|
A brief conclusion can be drawn that the a greater momentum does not always lead to a reactive trajectory. There need to be a balance between the translational energy and vibrational energy for the reaction to be successful.
The transition state theory neglects the tunneling effect and the fact that the product and the reactant are interconvertible,[1] hence it would overestimate the rate of the reaction slightly. It is shown by the simulation that it is possible for the trajectory to go pass the transition state whereas still be unsuccessful, however in the transition state theory it is considered as a reactive trajectory. The reversibility of the reaction reduces the rate of the forward reaction, and hence the rate is overestimated by the transition state theory. Tunneling effect makes the reaction with insufficient energy to overcome the energy barrier feasible, but this effect influences both forward and backward reaction, and hence will not affect the rate predicted by the transition state theory by a lot.
This is a really good discussion. I would say to list out the TST assumptions and so your discussion can be further appreciated logically. Your dynamics description, good observations, I would be inclined to make the descriptions more detailed specifically including 'kinetic energy, energy barriers etc'.Mys18 (talk) 00:49, 23 May 2020 (BST)
F - H - H system
PES inspection

A potential surface plot is drawn, were AB is the F-H distance and BC is the H-H distance. As shown in the plot, at low FH distance (i.e. FH + H state), the potential energy is lower; at low HH distance (i.e. H2 + F state), the potential energy is higher. This suggests that the reaction FH + H -> F + H2 is endothermic, and the reaction F + H2 -> FH + H is exothermic. From the thermodynamic nature of the reaction, it can be clearly seen that the F-H bond is much stronger than the H-H bond. The reaction FH + H -> F + H2 is endothermic, which suggests that the energy required for breaking the F-H bond is greater than the energy released when forming the H-H bond, hence a conclusion can be drawn that the F-H bond is stronger than the H-H bond.
Great explanation. It may be very obvious, but we must always support findings (where possible). We could search literature for bond energies for H-F and H-H to further experimentally support your finding.Mys18 (talk) 00:56, 23 May 2020 (BST)
The transition state position of the reaction is found at rFH=181.250 pm, rHH=74.484 pm shown as a dot in the surface plot.
Correct values, maybe support how you acquired these values? Mys18 (talk) 00:56, 23 May 2020 (BST)
F + H2
F + H2 -> HF + H
Overall exothermic reaction. The activation energy could be found by the difference between minimum potential energy calculated by MEP at H-F bond length which deviates from the transition state H-F bond length for 1 pm and the transition state potential energy.
As a result, the activation energy of this reaction is -433.981 kJ.mol-1 - (-435.067 kJ.mol-1) = 1.086 kJ.mol-1
| rFH / pm | rHH / pm | Contour Plot | Energy vs Time plot |
|---|---|---|---|
| 181.250 | 75.484 |  |

|
The H-H bond length was found to be 73.999 pm.
H + HF
HF + H -> F + H2
Overall endothermic reaction. The activation energy could be found by the difference between minimum potential energy calculated by MEP at H-H bond length which deviates from the transition state H-H bond length for 1 pm and the transition state potential energy.
As a result, the activation energy of this reaction is -433.981 kJ.mol-1 - (-560.583 kJ.mol-1) = 126.602 kJ.mol-1
| rFH pm | rHH pm | Contour Plot | Energy vs Time plot |
|---|---|---|---|
| 180.250 | 74.484 |  |

|
The H-F bond length is found to be 91.997 pm.
Well done on your estimates and correct units. Mys18 (talk) 00:58, 23 May 2020 (BST)
Reaction Dynamics

A chosen set of initial condition for the reaction F + H2 to take place is:
rFH = 180 pm
rHH = 74 pm
pFH = -1 g.mol-1.pm.fs-1
pHH = -1 g.mol-1.pm.fs-1
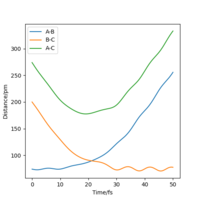
The momenta vs time plot for this trajectory is shown in the figure, where A, B and C denote the F, H and H atom respectively.
From the plot, it can be observed that if the reaction feasible, eventually the system would consist of a vibrating molecule (represented by the periodically oscillating AB line) and a translating atom (represented by the horizontal BC line). As a result, the excess reaction energy is released as vibrational energy and translational energy.This could be determined by infrared emission spectroscopy. When the system lies towards the reactant side, less vibrational energy is present in the system. The most populated vibrational state would be the ground state, and the IR emission spectrum will show a few overtones which corresponds to decay from higher vibrational states. As the system moves toward the product side, the energy initially put in to overcome the activation barrier is converted to the vibrational energy. As a result, more states could be populated and hence more overtones would be observed in the spectrum.
It is clearly seen in the surface plot that the transition state locates very close to the F + H2 side. As a result, the F + H2 reaction has a early transition state where the structure of the transition state resembles the reactants; the H + HF reaction has a late transition state where the structure of the transition state resembles the products.
According to Polanyi, the translational energy is more effective to make the reaction proceed when an early transition state is present, and the vibrational energy is more effective in prompting the reaction when having a late transition state. [2][3] The use of infrared chemiluminescence helps determine the contribution from different modes. IR chemiluminescence shows the variation of the rate constant with respect to change in vibrational, rotational and translational quantum numbers. [2][3]It is useful to find which combination of vibrational, rotational and translational states gives the maximum rate constant, and hence determine how different modes affect the reaction trajectory.
Good, I can see your understanding of Polyani's rule from it's application in your answer. Excellent job in your referencing in this section.Mys18 (talk) 01:02, 23 May 2020 (BST)
References
- ↑ Steinfeld J, Francisco J, Hase W. Chemical kinetics and dynamics. 2nd ed. Upper Saddle River: Prentice Hall; 1998.
- ↑ 2.0 2.1 Polanyi J. Concepts in reaction dynamics. Accounts of Chemical Research. 1972;5(5):161-168.
- ↑ 3.0 3.1 POLANYI J. Some Concepts in Reaction Dynamics. Science. 1987;236(4802):680-690.

