MRD:01412340
General remarks: Please do get in the habit of defining all your quantities (What is V? what is A,B,C?), giving proper references (were did you take Polanyi's principles from?), and also labelling and referencing your Figures (i.e. adding a caption with e.g. 'Figure 1', but also referring to every figure in the text. These general points are important to communicate science properly. Fdp18 (talk) 14:35, 9 May 2020 (BST)
H + H2 System
The Transition State (TS)
The transition state is where the potential gradient with respect to r1 and r2 are zero. Mathematically:
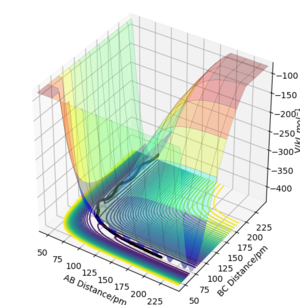
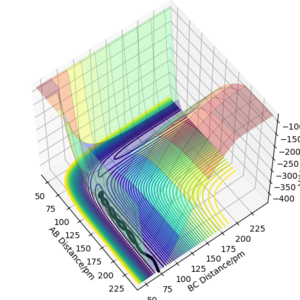
It is the maximum energy point along the reactive trajectory between reactants and products on a surface plot of the potential energy surface.
There appears to be a lot of vibration in the shown black line. Think of a better way of representing this, e.g. with an additional contour plot. Furthermore, the system is symmetric, so the transition state must be located in the middle.
Fdp18 (talk) 14:15, 9 May 2020 (BST)
The TS can be accurately identified by modelling trajectories near the estimated TS and observing if they move towards the reactants or products. The trajectories on either side of the TS should move towards different ends of the minimum energy path. Without initial momentum, there will be no trajectories and the system will remain in the same state at the TS indefinitely.
This H + H2 system has 2 orthogonal internal degrees of freedom with coordinates r2 + r1 and r2 - r1 (shown on a contour plot as diagonal directions relative to the plot coordinates r1 and r2). On a local minimum, the potential energy gradient with respect to these degrees of freedom will increase on each side of the minimum point, but the TS is a "saddle point" where the gradients change in opposite directions (one negative and one positive second derivative). It is where the energy is maximum along the reaction coordinate and where the energy is minimum in the plane orthogonal to it.
Locating the Transition State
Because the H + H2 surface is symmetric, the transition state must have r1 = r2. By testing different initial distances with p1 = p2 = 0, it was found that the best estimate for the transition state position rts = 90.8 pm. At this position, there is minimal oscillation along the r1 = r2 ridge, which is expected of the transition state. The system is expected to remain in the same state at the transition state if there is no initial momentum.
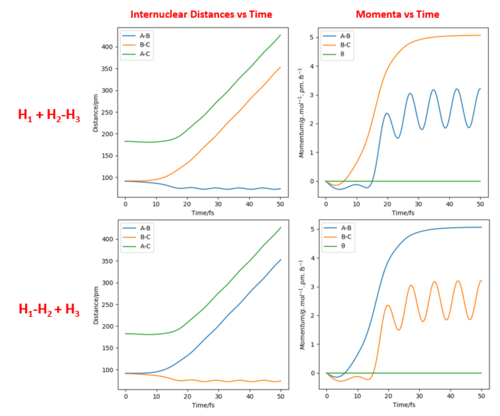
At r1 = r2 = 90.8 pm, the Internuclear Distances vs Time plot shows minimal variation of r1 and r2 and hence suggests that the system is at the transition state.
Minimum Energy Path and Trajectory
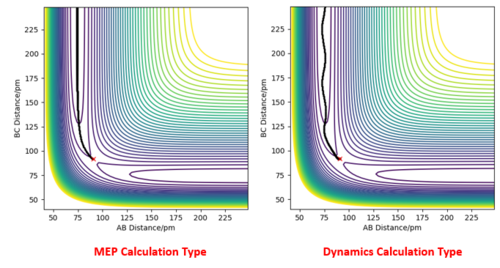
Using the initial conditions of r1 = 90.8 + 1 pm, r2 = 90.8 pm and zero momenta, the trajectories obtained are different when switching between "MEP" and "Dynamics" calculation types. The "MEP" plot follows the valley floor (the lowest energy path) to H1 + H2-H3 while the "Dynamics" plot takes into account the inertial effects of the atoms on their way to the product. Therefore an oscillation of the path can be seen as it progresses towards H1 + H2-H3.
subscripts are usually used different in chemistry. It is obvious in this case, but try to avoid it elsewhere - H3 can also mean 'trihydrogen'. Fdp18 (talk) 14:19, 9 May 2020 (BST)
Switching the values of r1 and r2 and using the conditions r1 = 90.8, r2 = 90.8 pm + 1 pm and zero momenta instead will change the direction of the trajectory in the opposite direction towards H1-H2 + H3. Comparing the Internuclear Distances vs Time plot and the Momenta vs Time plot, it can be seen that the trends of r1 and r2 over time have swapped when using the new conditions.
The final positions of the above calculation were then taken and used as the initial positions. The final momenta were used as the initial momenta values, but with signs reversed. In short, the conditions used were r1 = 74.01 pm, r2 = 352.62 pm, p1 = -3.20 g.mol-1.pm.fs-1 and p2 = -5.06 g.mol-1.pm.fs-1. It can be seen that the trajectory is the exact reverse of the previous calculation. If we extend the calculation time, we can see that after returning to the original positions of r1 = rts, r2 = rts + 1 pm, the trajectory reverses and eventually returns to the initial point. This can be seen from the Momenta vs Time plot where the momenta reverse sign after reaching r1 = rts, r2 = rts + 1 pm. The trajectory does not cross the transition state proceeding towards the product H1 + H2-H3.
Reactive and Unreactive Trajectories
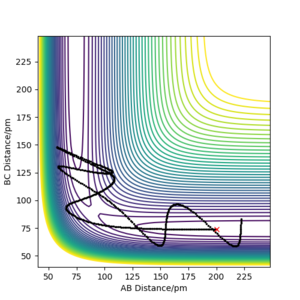
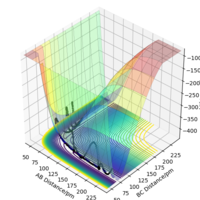
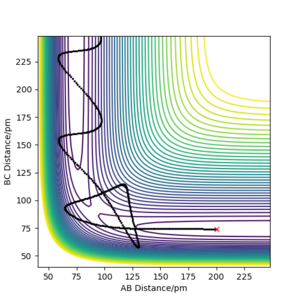
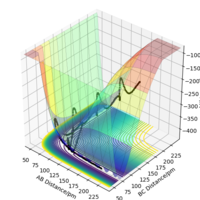
Using r1 = 74 pm and r2 = 200 pm, various trajectories were run with varying momenta.
We can therefore conclude from this that a trajectory is reactive not necessarily because of higher values of momenta and higher kinetic energy, since there are situations where high momenta can lead to unreactive trajectories (i.e. the 4th trajectory above). Recrossing of the TS region can occur in a few cases.
Using the Transition State Theory
The Transition State Theory uses a classical treatment of the system to predict the reaction rates and does not take into account quantum effects of tunneling, which is especially relevant for reactions of light species such as H atoms. It also assumes that systems can only pass through the transition state once, which is evidently not the case when experimentally modelled in the last 2 cases above. It also treats the motion along the reaction coordinate as separate from other motions – purely translation along the reaction coordinate at the lowest energy configuration. However other motions are important as the system is not truly always at the lowest energy configuration, and the effective activation energy can be higher than that at the lowest energy pathway. Therefore the experimental reaction rate values are likely to be lower that that modelled by the Transition State Theory, because of the possibility for the system to recross the transition state to return to reactants, and because of the higher than calculated effective activation energies.
general comment: please provide references, and list them at the end of your report. (In this particular case, where did you take the assumptions of transition state theory from? Fdp18 (talk) 14:24, 9 May 2020 (BST)
F - H - H System
Potential Energy Surface Inspection
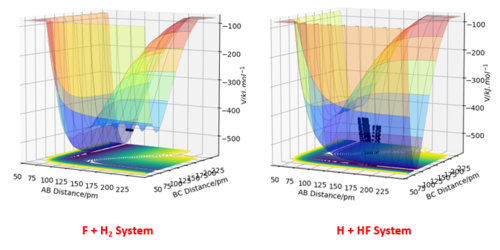
The potential energy surfaces of 2 different systems F + H2 and H + HF are examined using arbitrary values r1 = 74 pm, r2 = 200 pm and zero momenta (these are not important here since only the surface is examined). From the surface plots and the relative potentials of the reactant and product states, it can be concluded that F + H2 is exothermic as there is a net energy loss from reactants to products. Using the same concept, one can tell that H + HF is endothermic as there is a net energy gain.
What is A, what B in your surface plots? Fdp18 (talk) 14:26, 9 May 2020 (BST)
From the Surface Plots, it can be seen that the H + HF state is lower in energy and is hence more stable. Energetic stability is directly related to bond strength, and therefore it can be concluded the H-F bond is more stable and is stronger than the H-H bond.
To locate the TS, Hammond's Postulate is used since it is difficult to immediately identify the TS on the plots. It is assumed that the bond distances in the TS are similar to those in the reactants or products, to whichever it is closer in energy. Therefore, the initial starting value used for the H-H distance was 74 pm - the H-H bond length. The r1 and r2 values were then tweaked to achieve the best estimate for the TS position (to 1 decimal place).
The TS distances are estimated to be 74 pm between H-H and 181.4 pm between H-F. It is in this position where there is minimal variation of r1 and r2 values over time, as seen in the Internuclear Distances vs Time plot below.
The activation energies of each reaction were calculated through the "MEP" calculation type, by selecting an initial position close to the TS and letting the system "roll" towards the reactants. The initial and final energy values over time were then obtained and a simple subtraction gave the activation energies. Once again, the much higher activation energy for the H + HF state is a reflection of the stronger H-F bond.
| Ea / kJ.mol-1 | |
|---|---|
| F + H2 | 1.0088 |
| H + HF | 126.6866 |
Reaction Dynamics
Examining the F + H2 System
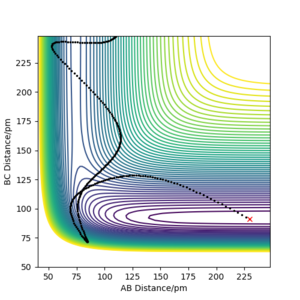
The initial conditions used to achieve a reactive trajectory were rFH = 230 pm, rHH = 74 pm, pFH = -1.5 g.mol-1.pm.fs-1 and pHH = -1.5 g.mol-1.pm.fs-1.
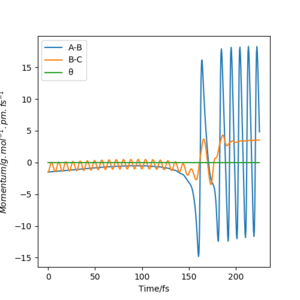
Much of the energy released after crossing the TS barrier is as vibrational energy in the product FH molecule than as translational energy in the leaving H atom. This can be seen in the Momenta vs Time plot, where the relative magnitudes of the momenta reflect the quantities of energy released in the vibrational/translational modes of the products.
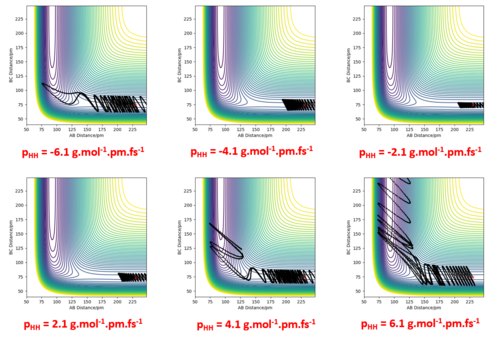
By exploring various values of pHH with rFH = 230 pm, rHH = 74 pm and pFH = -1.0 g.mol-1.pm.fs-1, it is seen that even though the energy put into the system is significantly larger than the activation energy, not all the cases proceeded to the products, though some crossed and recrossed the TS region.
Significantly reducing pHH to 0.2 g.mol-1.pm.fs-1 and just slightly increasing pFH to -1.6 g.mol-1.pm.fs-1 resulted in a trajectory that proceeded to products. This suggests that simply having a system with an energy larger than the activation energy does not mean it will go to products, and that the translational energy of the F atom is more effective in bringing about reaction than vibrational energy is. It is also evident here that a considerable amount of energy released goes into the vibrational energy of the product.
Examining the H + HF System
The initial conditions used to achieve a reactive trajectory were rHH = 230 pm, rFH = 91 pm, pHH = -17.4 g.mol-1.pm.fs-1 and pFH = 1.5 g.mol-1.pm.fs-1. By merely having high translational energy was insufficient in bringing about the reaction. By increasing H-F vibration energy from a low value, a reactive trajectory was eventually generated. This exemplifies the effectiveness of vibrational energy over translational energy in bringing about a reaction.
Discussion of Polanyi's Empirical Rules
The F + H2 reaction is an exothermic reaction with an early TS (closer to the reactants than products). It was observed that much of the energy released after crossing TS barrier went into the vibrational energy of F-H instead of the translational energy of the H atom. By using the principle of microscopic reversibility, in the endothermic late TS H + HF reaction (the reverse of F + H2), the vibrational energy is the most effective in bringing about reaction. This effectiveness is also shown in the examination of the H + HF system above.
On the other hand, for an exothermic reaction with a late TS, much of the energy is instead released as translational energy of products. Following the same principle, in the corresponding reverse endothermic reaction (early TS), translational energy of reactants is more effective in leading to reaction.
Whether the translational or vibrational energy of reactants is the more effective factor in leading to reaction depends very much on the position of the TS. However, a caveat to these "rules" is that other factors can cause variation, such as varying masses of atoms involved. Can cause variation in what? Fdp18 (talk) 14:31, 9 May 2020 (BST)


