MRD:01381641
Molecular Reaction Dynamics
EXERCISE 1: H + H2 system
On a potential energy surface diagram, how is the transition state mathematically defined? How can the transition state be identified, and how can it be distinguished from a local minimum of the potential energy surface?
The transition state(TS) is mathematically defined as the point on the potential energy surface where ∂V(ri)/∂ri=0. This is where the gradient of the potential is equal to zero.

It represents the highest energy point on the potential energy surface (maximum) which is on Pu12 (talk) 20:22, 6 June 2019 (BST)
the lowest energy pathway connecting the chemical reactant to its product. It can be identified as a saddle point and will always be either a maximum or minimum point depending on the direction it is looked at. A local minimum will always be a minimum regardless of the direction it is looked from. A local minimum would have a second derivative greater than zero. From Figure 1, the transition state is shown as a maximum. If looked at from the plane of the xy diagnosis and z axis, it is a minimum on the potential energy surface.
Trajectories from r1 = r2 : locating the transition state
Report your best estimate of the transition state position (rts) and explain your reasoning illustrating it with a “Internuclear Distances vs Time” plot for a relevant trajectory.
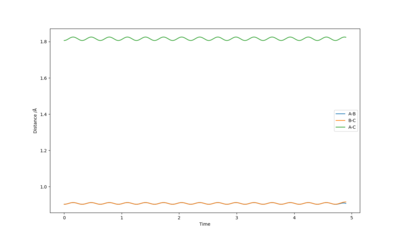
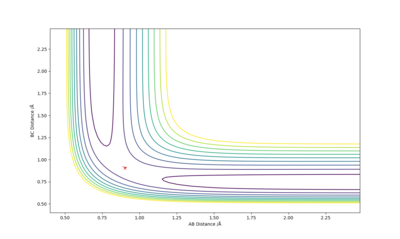
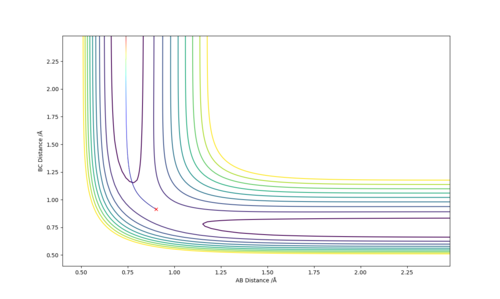
The best estimate of the transition state position is when r1 = r2 and this was found to be 0.903. Figure 2 shows a plot of Internuclear Distance vs Time and shows only vibrations of the atoms. This shows that the atoms do not fall off the ridge hence represents the transition state. The contour plot in Figure 3 confirms this position. This is an okay estimate, but you can get a better estimate where there is almost no vibration, at around 0.908. Pu12 (talk) 20:22, 6 June 2019 (BST)
Calculating reaction paths
Comment on how the mep and the trajectory you just calculated differ.
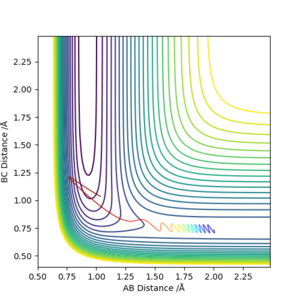
The minimum energy path(mep) trajectory in shown in the first picture(left). It does not give a realistic account of the motion of the atoms during the reaction. This is because the mep assumes the particles have no mass. It is seen as a straight line as the velocity always resets to zero in each time step. Changing the calculation type to 'Dynamics' gives a more realistic trajectory. It takes into account the mass of the system, producing a more accurate path the atom takes(right image).Should mention that vibrations are visible in the dynamic. Pu12 (talk) 20:22, 6 June 2019 (BST)
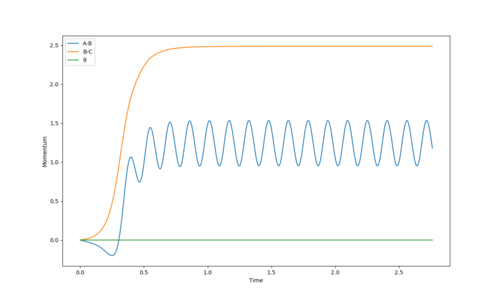
Reversing the initial conditions so that the initial positions corresponded tot the final positions , the same graphs are observed for “Internuclear Distances vs Time” and “Momenta vs Time” however the graphs are also flipped. Values of position and momenta at large t would show these changes:
The graph on the left shows a plot of Internuclear Distance vs Time. It shows that as time increases, the bond distance increases as atoms move further. At large t, the B-C distance increases to approximately 10Å whereas the A-B bond distance remains constant at around 0.5Å as these do not move away from each other. The graph on the right shows a plot of momenta vs time. It shows that as time proceeds, momentum increase. The average momenta for large t FINISH THIS
If the values were reversed, B-C bond distance would remain relatively constant but A-B distance will increase with time.
Reactive and unreactive trajectories
Complete the table by adding the total energy, whether the trajectory is reactive or unreactive, and provide a plot of the trajectory and a small description for what happens along the trajectory. What can you conclude from the table?'
For the initial positions r1 = 0.74 and r2 = 2.0, trajectories were run with the following momenta and the following table recorded:
| AB momentum | BC momentum | Etot | Reactive? | Figure |
|---|---|---|---|---|
| -1.25 | -2.5 | -99.02 | Yes | 4 |
| -1.5 | -2.0 | -100.46 | No | 5 |
| -1.5 | -2.5 | -98.96 | Yes | 6 |
| -2.5 | -5.0 | -84.56 | No | 7 |
| -2.5 | -5.2 | -81.80 | Yes | 8 |
 Figure 4: Reactive trajectory - C moves closer to the A-B bond. The A-B bond breaks and B-C bond forms.
 Figure 5: Unreactive trajectory - Though C draws closer to the A-B bond, its momentum is too low to break the A-B bond. Atom C moves away from A-B and the A-B bond remains.
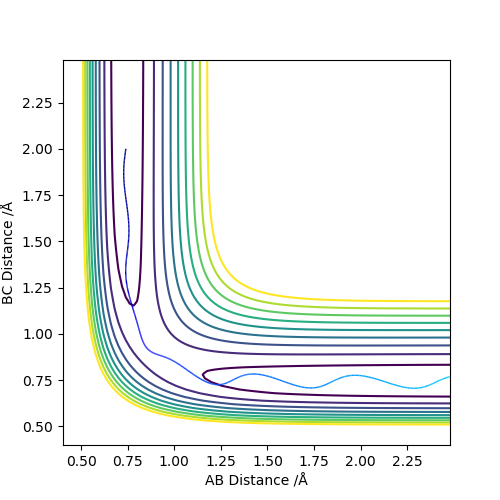 Figure 6: Reactive trajectory - Similar to Figure 4 but C approaches with less energy requiring more time to reach the transition state.
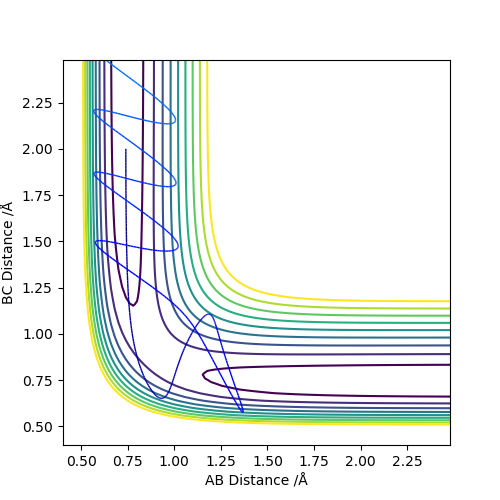 Figure 7: Unreactive trajectory - Atom C approaches the A-B bond with high levels of momentum. The transition state region is crossed and the B-C bond forms however the system reverts back to the initial reactants, rec-crossing the transition state.
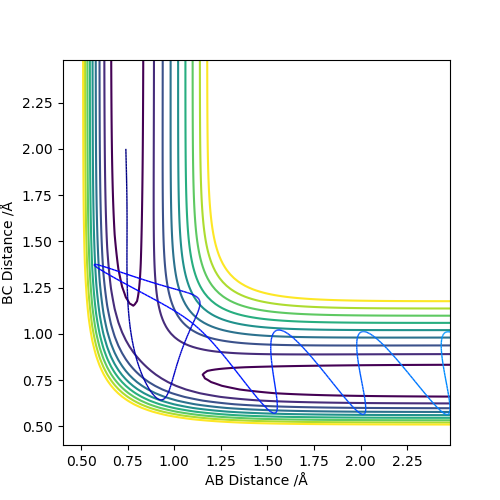 Figure 8: Reactive trajectory - C has enough momentum to approach and break the A-B bond. A oscillates to reform the A-B bond but atom C's momentum is high enough to retain the B-C bond.
You should discuss vibrations for each of these and give a conclusion of what you have learned from the table Pu12 (talk) 20:22, 6 June 2019 (BST)
Transition State Theory
State what are the main assumptions of Transition State Theory. Given the results you have obtained, how will Transition State Theory predictions for reaction rate values compare with experimental values?
Transition state theory (TST) gives a qualitative approach to understanding reaction rates of elementary chemical reactions. It follows the idea that all reactions proceed via a transition state. The theory ignores quantum effects such as energy quantisation and tunneling, taking a classical approach. If the reactants have enough energy to overcome the transition state barrier, a reaction will occur. However, from the observations, it can be seen that although reactants have enough momentum (and therefore energy) to react, re-crossing of the transition state can occur causing the system to go back to the reactants. TST also assumes that once reactants overcome the energy maximum, they cannot be converted back to products. TST predictions for reaction rates will likely be lower than experimental values as it does not consider quantum processes. Good, you also show that you have learned the most important conclusion from the above table. Pu12 (talk) 20:22, 6 June 2019 (BST)
EXERCISE 2: F - H - H system
Potential Energy Surface Inspection
By inspecting the potential energy surfaces, classify the F + H2 and H + HF reactions according to their energetics (endothermic or exothermic). How does this relate to the bond strength of the chemical species involved? Report the activation energy for both reactions.
1) F + H2 System
The reaction F + H2 --> HF + H can be classified as an exothermic reaction from the PES. This is because the reactancts are higher in energy compared to the products - see Fig. 9

There is a small activation energy to break the H-H bond resulting in an overall release of energy when the H-F bond is formed.
The following reaction conditions were set:
H-F Distance: 2 Å
H-H Distance: 0.74 Å
H-F Momentum: -0.5 kgms-1
H-H Momentum: 2.9 kgms-1

2) H + HF System
The reaction H + HF --> H2 + F can be classified as an endothermic reaction from the PES. This is because the reactants are lower in energy compared to the products - see Fig.10
There is a large activation energy to break the H-F bond resulting in an overall intake of energy despite the small amount of energy released when the H-H bond is formed.
The following reaction conditions were set:
H-H Distance: 2 Å
H-F Distance: 0.74 Å
H-H Momentum: -0.5 kgms-1
H-F Momentum: 2.42 kgms-1
The potential energy surfaces show that the strength of the H-F bond is greater than the H-H bond. Good Pu12 (talk) 20:22, 6 June 2019 (BST)
Locating the Transition State
Locate the approximate position of the transition state.
Conditions Used:
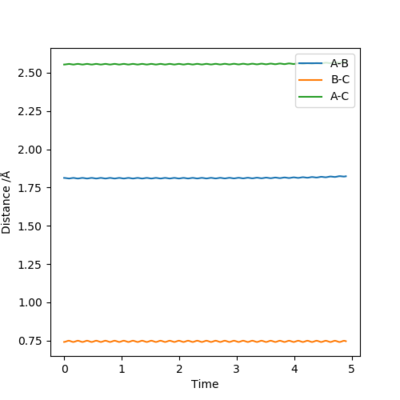
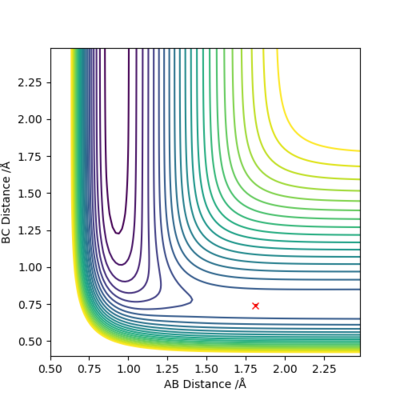
H-F Distance: 1.813 Å
H-H Distance: 0.7409 Å
The best estimate of the transition state position was found with the conditions stated above with momentum equal to zero. As the activation energy for the exothermic reaction is small, Hammond's postulate was used. It meant the transition state resembled the reactants and was closer in energy to the reactants. The image on the left shows a plot of Internuclear Distance vs Time and shows only vibrations of the atoms. This shows that the atoms do not fall off the ridge, hence representing the transition state. The contour plot (right image) confirms this position.
Activation energies
Activation energy is given by the energy difference between the reactants and transition state. The energy of the transition state was -103.746 kcal/mol
For the reaction F + H2 --> HF + H, 0.1 Å was added to the H-F bond length taking the trajectory to the reactants side. This gave the energy of the reactancts to be -103.765 kcal/mol. Hence the activation energy for this was 0.20 kcal/mol.
Subtracting 0.1 Å from the H-F bond length takes the trajectory to the products side. This gave the energy of the products to be -133.995 kcal/mol. Hence the activation energy for the reverse reaction is 30.249 kcal/mol.
Reaction dynamics

The following conditions were found to represent a reactive trajectory for the reaction: F + H2 --> HF + H (Fig. 9)
H-F Distance: 2 Å
H-H Distance: 0.74 Å
H-F Momentum: -0.5 kgms-1
H-H Momentum: 2.9 kgms-1
In light of the fact that energy is conserved, discuss the mechanism of release of the reaction energy. Explain how this could be confirmed experimentally.
The plot of energy vs time (Figure 11) for this reaction shows that energy is conserved. Kinetic energy is constantly converted into potential energy and vice versa.The system always oscillates between energy contours with the same value. Calorimetry can be used to confirm this experimentally as the reaction involves heat changes. Overall, heat energy is taken in as the reaction is endothermic. This means a drop in the temperature of the surroundings would be observed. Also the fact that vibrational energy is attained or lost highlights that heat will change. Pu12 (talk) 20:22, 6 June 2019 (BST)
Changing H-H Momentum Values
The conditions of the reactive trajectory stated about were used and the momentum of H-H varied from -3 to 3 kgms-1.
 p(H-H) = -3 kgms-1
  p(H-H) = -2 kgms-1
  p(H-H) = -1 kgms-1
 p(H-H) = 1 kgms-1
  p(H-H) = 2 kgms-1
  p(H-H) = 3 kgms-1
For pH-H = -3, -1, 1, 2, 3 kgms-1, an unreactive trajectory is seen. For -3, 2 and 3 kgms-1 The system crosses the transition state to form the products but re-crosses and turns back into the reactants.
For pH-H = -2 kgms-1 a reactive trajectory is seen resulting in the formation of the H-F bond.
Keeping the same initial positions and increasing slightly the momentum pH-F = -0.8, and considerably reducing the overall energy of the system by reducing the momentum pHH = 0.1 showed a reactive trajectory.
Reversing the Reaction: HF + H --> F + H2

The conditions for a reactive trajectory were found to be: (see Fig. 10)
H-H Distance: 2 Å
H-F Distance: 0.74 Å
H-H Momentum: -0.5 kgms-1
H-F Momentum: 2.42 kgms-1
Keeping the same initial positions, the momenta were changed to obtain the trajectory shown in Fig. 12
H-H Momentum: -7.5 kgms-1 (arbitrary high value)
H-F Momentum: 0.5 kgms-1 (low value)
Despite the H atom having energy above the activation energy, it collides with H-F but a reaction does not occur.
Polanyi's Empirical Rules
Discuss how the distribution of energy between different modes (translation and vibration) affect the efficiency of the reaction, and how this is influenced by the position of the transition state.
For reactions that have a early transition state (most resembling the reactants e.g exothermic reaction), relative translational energy of the reactants in the system is the most effective in overcoming the activation energy. However, for reactions with a late transition state (e.g. endothermic reaction), vibrational excitation is more efficient at enhancing the reactivity than the translational energy. For the F + H2 --> HF + H reaction, changing individual momenta but keeping total momentum constant caused a reactive trajectory to become unreactive. As this reaction is exothermic and has an early transition state, it shows its efficacy driven through translational energy.
This is a good report and it's clear that you understand each question. Only a few small corrections.Pu12 (talk) 20:22, 6 June 2019 (BST)

