MRD:01366863
Molecular Reaction Dynamics
Introduction
By calculating and simulating the molecular reaction dynamic trajectory, the reaction of a diatomic molecule and an atom will be analysed. The information of the chemical kinetics, such as the transition state, the activation barrier and energetics of the reaction will be obtained and help analysing the reaction system.
EXERCISE 1 : H + H2 System
Q1. On a potential energy surface diagram, how is the transition state mathematically defined? How can the transition state be identified, and how can it be distinguished from a local minimum of the potential energy surface?
The transition structure is a saddle point in the potential energy surface.
Saddle point is one of the three kinds of stationary points, which include local minimum, local maximum and saddle point.
For function f(x,y):
Stationary point: the partial derivatives fx = 0 and fy = 0.
Minimum: the second derivatives (fxxfyy - f2xy) > 0 and fxx > 0.
Saddle Point: (fxxfyy - f2xy) < 0
(Good, but I think you can describe it in detail rather than simply put on the equations.) Cq3417 (talk) 17:37, 23 May 2019 (BST)
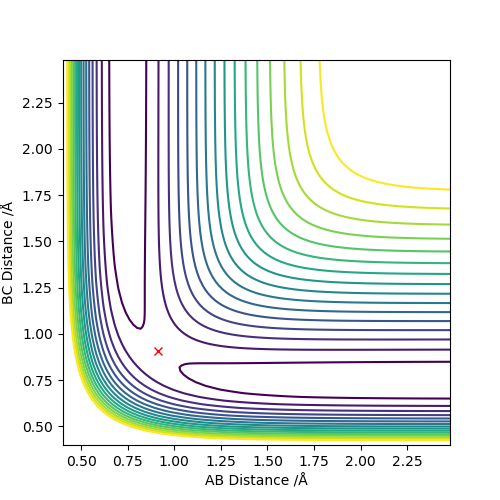
(I think a surface plot is better.) Cq3417 (talk) 17:37, 23 May 2019 (BST)
Q2. Report your best estimate of the transition state position (rts) and explain your reasoning illustrating it with a “Internuclear Distances vs Time” plot for a relevant trajectory.
Set r1 = r2 = 0.95, p1 = p2 = 0 :
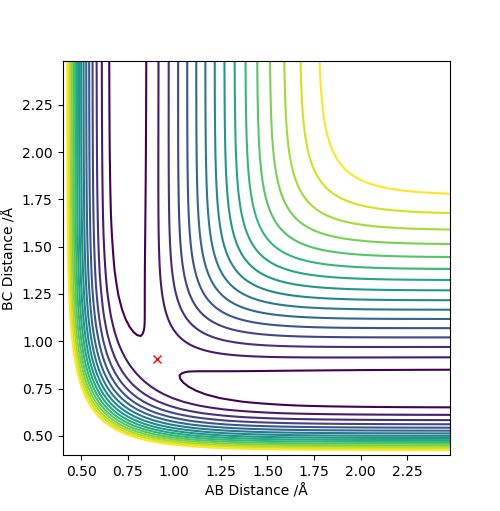
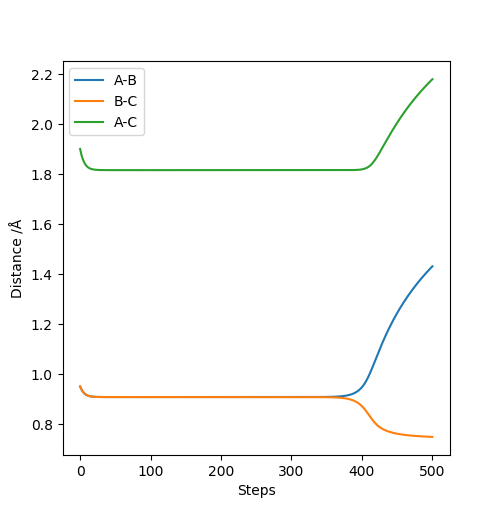
rts = 0.908
The line A-B and B-C separates at r = 0.908, which means the internuclear distances between A-B and B-C are the same, indicating the existence of the transition state.
(Any more comment with the internuclear distance vs time plot?) Cq3417 (talk) 17:37, 23 May 2019 (BST)
Q3. Comment on how the mep and the trajectory you just calculated differ.
Set r1 = rts + 0.01 = 0.918, r2 = rts = 0.908, p1 = p2 = 0 :
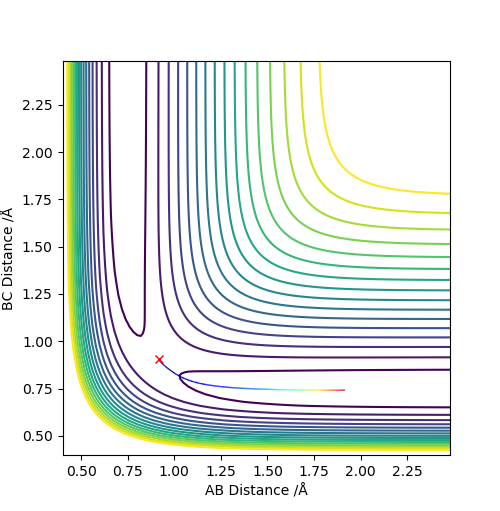

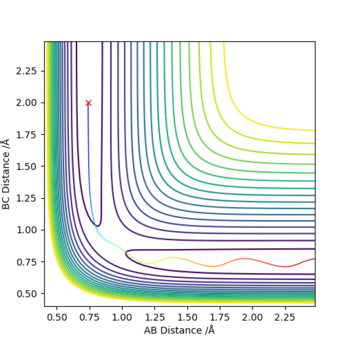
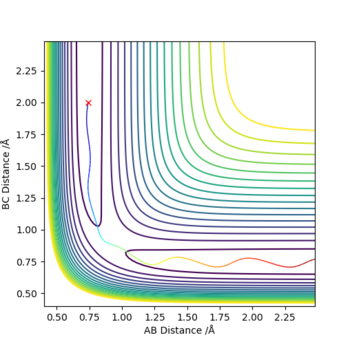
The minimum energy path (MEP) is a special trajectory that shows a slow motion. The momenta and velocity are set to 0, hence the kinetic energy as well (Ek = p2 / 2m = mv2/2). Thereby, in the MEP plot the vibrational motion (vibrating wavy line) was not shown. The dynamic method describes a realistic motion of atoms where the energy is conserved, hence the vibrational motion can be seen in the dynamics plot.
(Your description is not clear here.) Cq3417 (talk) 17:37, 23 May 2019 (BST)
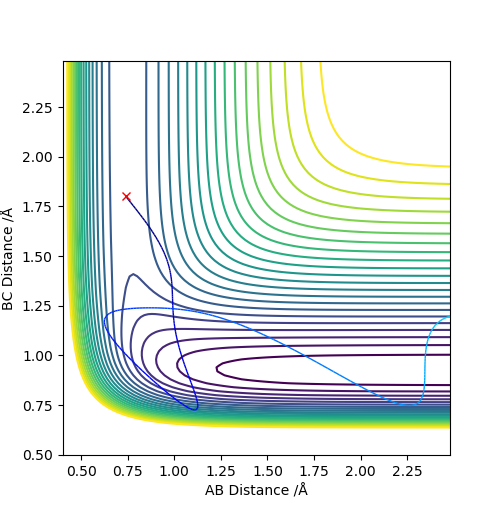
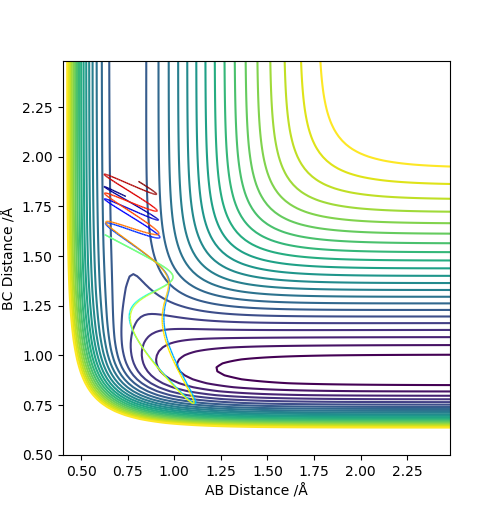
Q4. Complete the table above by adding the total energy, whether the trajectory is reactive or unreactive, and provide a plot of the trajectory and a small description for what happens along the trajectory. What can you conclude from the table?
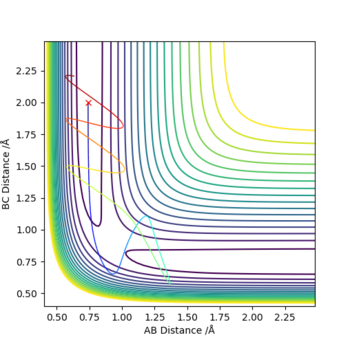
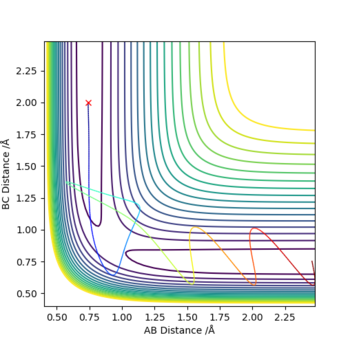
Conclusion: When the internuclear distances r1 and r2 stay constant, the momenta and the energy can decide whether a reaction can undergo or not. The higher the kinetic energy is, the more likelihood for the reaction to be reactive. Though -1.5 < r1 < -0.8 and p2 = -2.5 is stated to be the reactive range, the parameters outside the range are able to provide a reactive condition. The formation of the product is not permanent and the reformation of the reactants is possible.
Q5. State what are the main assumptions of Transition State Theory. Given the results you have obtained, how will Transition State Theory predictions for reaction rate values compare with experimental values?
Assumptions:
1. Molecular system that have crossed the transition state in the direction of products cannot return around and reform reactants.
2. In the transition state, motion along the reaction coordinate may be separated from the other motions and treated classically as a translation.
3. Even in the absence of an equilibrium between reactant and product molecules, the transition states that are becoming products are distributed among their states according to the Maxwell-Boltzman laws.
According to the fourth and fifth row of the previous table, it can be seen that in these reactions the transition state has been crossed repeatedly, though the fourth reaction is unreactive while the fifth is reactive. This behaviour violates the first assumption listed above. The experimental rate of reaction could be lower than the theoretical rate since in some situations the recrossing of transition state may occur, and it will lower the rate of reacting because certain part of the reactants do not transform into product successfully.
(Good, any reference?) Cq3417 (talk) 17:37, 23 May 2019 (BST)
EXERCISE 2 : F - H - H System
Q6. By inspecting the potential energy surfaces, classify the F + H2 and H + HF reactions according to their energetics (endothermic or exothermic). How does this relate to the bond strength of the chemical species involved? Locate the approximate position of the transition state.
Bond energy of H-H = +436 kJ/mol
Bond energy of H-F = +565 kJ/mol
| Reaction Undergo | Bond Breaking and Making | Energy Change | Energetics |
|---|---|---|---|
| F + H2 → H + HF | Break H-H bond, form new H-F bond | ΔE = +436 - 565 = -129 kJ/mol | Exothermic |
| H + HF → F + H2 | Break H-F bond, form new H-H bond | ΔE = +565 - 436 = +129 kJ/mol | Endothermic |
These two reactions are actually the same except for their opposite reaction direction (the second reaction is the reverse reaction of the first one), hence there should only be one transition state.
F + H2 :
Set A and B as H, C as F. Set r1 = 0.745, r2 = 1.811, p1 = p2 = 0.
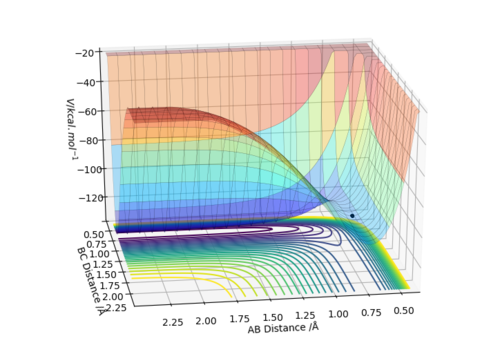
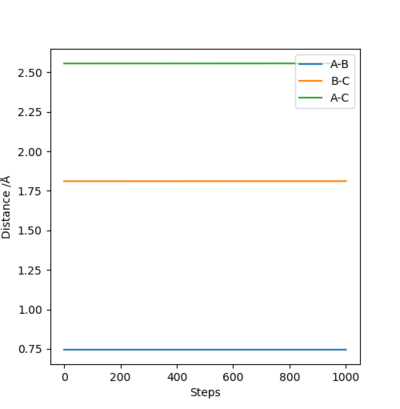
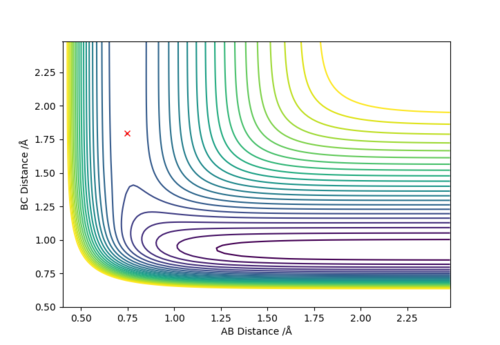
It can be seen that from the surface plot, from the reactant entry channel to product exit channel, the spot goes off a slope which means the reaction releases energy as heat in this process, hence it is exothermic. The distances between A-B and B-C are constant. Transition state: r1 = 0.745, r2 = 1.811.
H + HF :
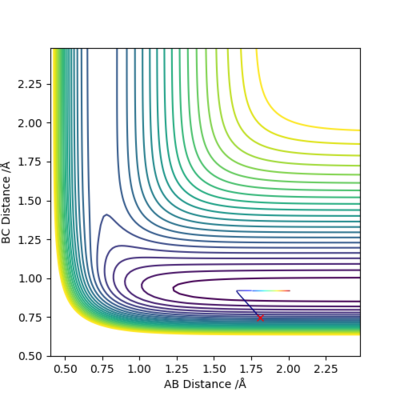
Set A as F, set B and C as H. Set r1 = 0.745 (now r1 = rH-F), r2 = 1.811, p1 = p2 = 0.
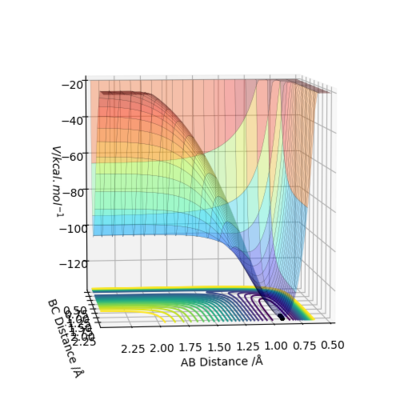
(I can't see the saddle point on this plot.) Cq3417 (talk) 17:37, 23 May 2019 (BST)
(Like you said before, they are sharing same transition state and the reaction is reversible. Why you changed r1 here?) Cq3417 (talk) 17:37, 23 May 2019 (BST)
It can be seen that from the surface plot, from the reactant entry channel to product exit channel, the spot climbs up a slope which means the reaction need to absorb energy to continue this process, hence it is endothermic.
Transition state: r1 = 0.745, r2 = 1.811. The plot does not match the transition state perfectly and it may be due to the difference bond length between the reactant H-F (about 0.917) and the previous reactant H-H.
Q7. Report the activation energy for both reactions.
F + H2 → H + HF :
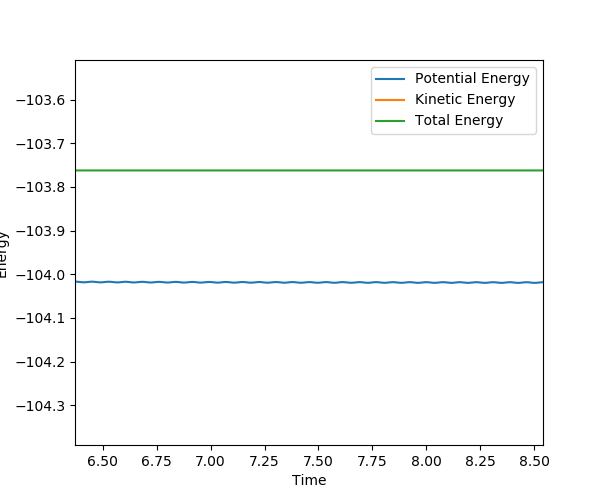
r1 = 0.745, r2 = 1.90, p1 = p2 = 0.
Activation energy = 104.0 - 103.8 = 0.22 kcal/mol
(Good, but how to get this plot?) Cq3417 (talk) 17:37, 23 May 2019 (BST)
H + HF → F + H2 :
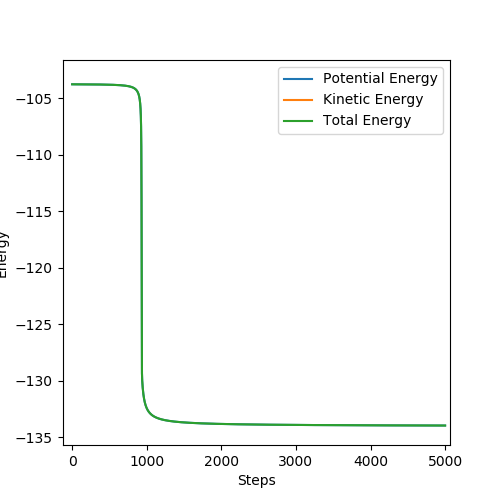
r1 = 0.745, r2 = 1.75, p1 = p2 = 0.
Activation energy = 133.76 - 103.52 = 30.24 kcal/mol
(Again, I think you need to describe more here.) Cq3417 (talk) 17:37, 23 May 2019 (BST)
Q8. In light of the fact that energy is conserved, discuss the mechanism of release of the reaction energy. Explain how this could be confirmed experimentally.
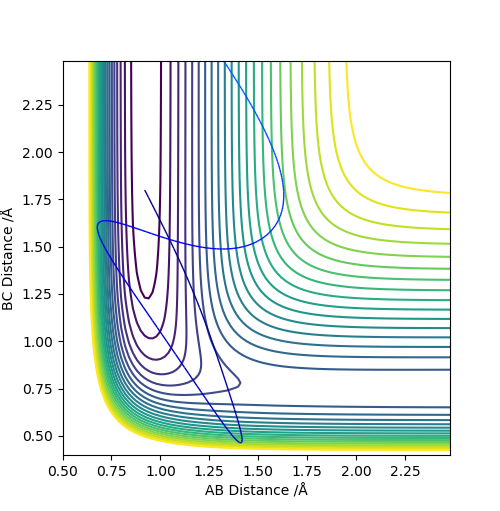
Set A and B as H, C as F, set r1 = 0.745, r2 = 1.9, p1 = -0.2, p2 = -0.8.
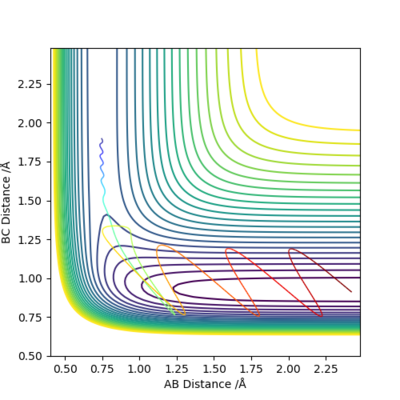

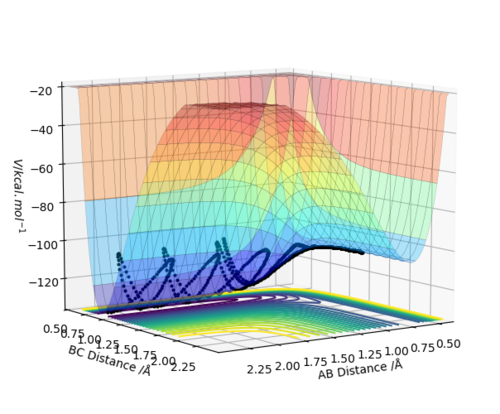
The reaction is exothermic. It can be seen from the surface plot that the potential energy decreases along the reaction coordination. Since the energy is conserved, the kinetic energy increases and is channeled into the vibration and rotation of HF molecule. The temperature of the reaction system goes up with the kinetic energy.
(channelled?) Cq3417 (talk) 17:37, 23 May 2019 (BST)
(Ok, but you have three plots here, any more comments on them?) Cq3417 (talk) 17:37, 23 May 2019 (BST)
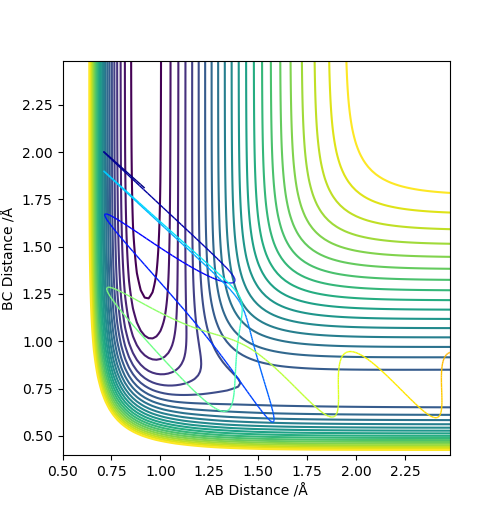
Q9. Discuss how the distribution of energy between different modes (translation and vibration) affect the efficiency of the reaction, and how this is influenced by the position of the transition state.
Using IR chemiluminescence, the energy distribution of HF can be measured.
By the Hammond's postulate, for exothermic reactions, the transition state favourably resembles the reactants which is closer in energy, hence an early transition state observed. In this case, the reactants with larger distribution of transitional energy will be more likely to cross the barrier successfully, and generally resulting in a vibrational excitation of the product.
As for endothermic reactions, transition state resembles product, a late transition state would be observed and the vibrational energy contributes to cross the barrier more effectively than the transitional energy does, and it
leads to high transitional excitation of product.
p1 (momentum of molecule bond A-B) represents the vibrational energy, p2 represents the transitional energy.
(Any reference here?) Cq3417 (talk) 17:37, 23 May 2019 (BST)
F + H2 (early transition state) :
H + HF (late transition state) :
Hence, the reaction with early transition state favours more transitional energy, and the reaction with a late transition state favours more vibrational energy.
(It is better to give detailed explanation on your experimental data rather than put on them and left few or no comments.) Cq3417 (talk) 17:37, 23 May 2019 (BST)
(Overall, I think you need to pay more attention on your description of this concept to show us your understanding and effort.) Cq3417 (talk) 17:37, 23 May 2019 (BST)
Reference
1. J. I. Steinfeld, J. S. Francisco, W. L. Hase, Chemical Kinetic and Dynamics (1st Edition), Prentice-Hall, 1998, p293-311.


